

Abstract
We describe direct determination of the state of intracellular water, measurement of the intercellular concentration of a cryoprotectant agent (dimethylsulfoxide), and the distribution of organic material in frozen mammalian cells. Confocal Raman microspectroscopy was utilized at cryogenic temperatures with single live cells to conduct high spatial resolution measurements (350 × 350 × 700 nm), which yielded two, we believe, novel observations: 1), intracellular ice formation during fast cooling (50°C/min) causes more pronounced intracellular dehydration than slow cooling (1°C/min); and 2), intracellular dimethylsulfoxide concentration is lower (by as much as 50%) during fast cooling, decreasing the propensity for intracellular vitrification. These observations have a very significant impact for developing successful biopreservation protocols for cells used for therapeutic purposes and for cellular biofluids.
Introduction
Biopreservation is an enabling technology for a wide array of applications including but not limited to:
-
1.
Industrial/medical use of recombinant proteins.
-
2.
Cellular therapies/regenerative medicine.
-
3.
Biobanking/biorepositories for medical, biotechnological and agricultural research.
In all of these applications, the critical properties of a biological system must be preserved during processing, transport, and storage.
Biopreservation (by cryopreservation, vitrification, freeze-drying, and desiccation) aims at altering the chemical activity of the intracellular water by changing its phase, temperature, or concentration. Reduction of the chemical activity decreases biochemical reaction rates and degradation, enabling storage of various organisms (ranging from weeds to mammalian cells) by freezing and/or desiccation (1). However, most organisms cannot survive freezing and desiccation unless a chemical protective agent (e.g., a cryoprotectant: CPA) is present in the medium (2).
It is hypothesized that CPAs help reduce the chemical activity of the intracellular water, stabilize the cellular structures, and increase the viscosity of the cytoplasm by altering its freezing kinetics (e.g., freezing temperature is suppressed and the ice crystal size is reduced) (3). However, the exact mechanisms of protection offered by CPAs, and the reasons for the significant variation in storage stabilities of different organisms in a frozen state, are yet to be determined. This is mainly because it has so far not been possible to probe directly the intracellular medium of a cell (e.g., determine the state of intracellular water, measure the hydration levels of the cellular structures, and measure the concentration of CPAs) in the frozen/cryopreserved state. Thus, methods that enable direct probing of the intracellular medium at a high spatial resolution are needed.
To visualize the ultrastructure of the cells and biological materials at the frozen state, cryo-scanning electron microscopy (SEM)/transmission electron microscopy (TEM), freeze-fracture replication, low temperature freeze-substitution and freeze-drying, and cryomicroscopy have frequently been used (4–6). Cryo-SEM and cryo-TEM can be used to visualize frozen samples that have undergone ultrarapid freezing with or without CPAs. The freeze-fracture method is based on applying a force on a brittle frozen specimen to cause fractures along the hydrophobic inner face of the cellular membranes, which are then imaged at cryogenic temperatures. The freeze-substitution method uses organic solvents to dissolve the ice in the frozen specimens (at temperatures low enough to avoid ice recrystallization) and injection with polymerizing resins followed by sectioning, staining, and visualization with TEM. Freeze-drying allows sublimation of ice at low temperatures followed either by direct visualization or resin embedding and processing similar to freeze-substitution. All of the techniques mentioned above require extensive sample processing and preparation before imaging and naturally, they do not permit visualization of live specimens.
On the other hand, cryomicroscopy allows direct visualization of live cells during freeze/thaw in different solutions using conventional light microscopy, but only at a lower spatial resolution. Cryomicroscopy can also be used to measure the dynamic volumetric response of the cell during freeze/thaw and indirectly report the formation of intracellular ice (7) through darkening or twitching of the cell (8). Additionally, fluorescent-probes (9,10), Raman/Fourier transform infrared spectroscopy, coherent anti-Stokes Raman scattering microscopy (11,12), and NMR (13) can be used to measure the changes in the properties of water in response to anisotonic stresses applied to cells. Generally, these techniques can only be used at temperatures above freezing, and although they permit measurement of the properties of the bulk sample water, they cannot provide direct chemical/physical information at a high spatial resolution.
In this communication (for the first time to our knowledge), the spatial distribution of the state of intracellular water (at a spatial resolution of 350 nm laterally, and 700 nm vertically), the distribution of organic material inside the cell, and the intracellular CPA concentration in single frozen mammalian cells, was determined using confocal Raman microspectroscopy (CRM). This information is critical for enhancing our knowledge of the cell's response to freeze/thaw, and thereby to the development of improved preservation protocols for cells that are refractive to current preservation techniques and to the development of alternative methods of preserving cells.
Materials and Methods
Mammalian cell culture
Human foreskin fibroblasts purchased from the American Type Culture Collection (ATCC, Manassas, VA) were incubated at 37°C with 5% CO2 using F-12 Dulbecco's modified Eagle's medium (without phenol red, including 75 mL fetal bovine serum, and 5 mL penicillin; Invitrogen, Carlsbad, CA). Human foreskin fibroblasts were trypsinized upon reaching 80–90% confluence, centrifuged for 8 min at 800 rpm, and resuspended in experimental solution. One microliter of the cell suspension was placed on the surface of the temperature-controlled stage, covered with a piece of mica (1–3 μm in thickness), and sealed using Kapton tape (Dupont, Wilmington, DE), to prevent evaporation/sublimation. Cell viability experiments were conducted using fluorescent analysis (propidium-iodide-stained cells were considered dead).
Confocal Raman microspectroscopy
CRM measurements were conducted using an Alpha 300R confocal Raman microscope (WITec, Ulm, Germany). The microscope was equipped with a UHTS200 spectrometer and a DV401 charge-coupled device detector (WITec). A 100× air objective (NA = 0.90; Nikon Instruments, Melville, NY) was used for all measurements. An Ar-ion laser at a wavelength of 514.5 nm and 15 mW of power was used for excitation. A multistage Peltier system was constructed to achieve cooling rates in the range of 0.1–50°C/min down to a minimum temperature of −65°C. N2 was used to purge the sample stage to avoid condensation. Ice was nucleated by touching the sample with a liquid nitrogen-cooled needle at the predetermined nucleation temperature. Each experiment was repeated with 3–5 cells and the CRM images presented here are representative. Ice/liquid water ratio was calculated using
and water/organic matter ratio was calculated using
where I is the Raman intensity at wavelength, λ.
Raman imaging and calibration
Raman spectrum of water is very sensitive to the changes in temperature and water-hydrogen bonding (whether it is induced by phase change or by the presence of solutes or other solvents). The ν-OH band of the liquid water is broad (2900–3600 cm−1) and asymmetric, with its peak located at 3420 cm−1. The ice and liquid water contrast images were generated by integrating the ice peak centered at 3120 cm−1 (3100–3185 cm−1), and the liquid water peak centered at 3420 cm−1 (3320–3485 cm−1), respectively. These peaks were corrected by subtracting the contributions from the water (or ice) peaks obtained from 1× phosphate-buffered saline (PBS) and ice (Fig. S1 in the Supporting Material) in the same spectral range. DMSO contrast images were generated by integrating the DMSO ν-C-S peak centered at 700 cm−1 (645–745 cm−1). In the presence of dimethylsulfoxide (DMSO), the water peak used in the 1× PBS calibration did not exhibit a linear dependence on concentration because the selected spectral range includes contributions from water-DMSO interaction. A calibration curve for DMSO concentration was constructed by measuring the 700 cm−1 peak intensity as a function of DMSO concentration for 2–50% v/v. (Please refer to a previous publication from our group for further details (14).)
Results
Mammalian cells frozen in the absence of a cryoprotectant agent
We used CRM to explore the manner by which different cooling rates affect the state and distribution of intracellular water and organic material in a frozen mammalian cell (human foreskin fibroblast). Fibroblasts suspended in 1× PBS were cooled down to TN = −2°C (i.e., 1.5°C supercooling) where extracellular ice was nucleated (see Materials and Methods). The cells were then subjected to slow (1°C/min), moderate (10°C/min), or fast (50°C/min) cooling.
During slow cooling, cells experienced a significant decrease in volume (Fig. 1 A). Intracellular ice formation was not detected even at temperatures as low as T = −50°C. Intracellular liquid water content was very low (Fig. 1 A, spectra), indicating that the cell underwent excessive dehydration. The organic material inside the cell was uniformly distributed.
Figure 1.

Light microscopy (first column) and CRM images (second and third columns) of fibroblasts frozen in 1× PBS. Images at 100× magnification were collected at T = −50°C after ice nucleation at TN = −2°C and after (A) slow (dT/dt = 1°C/min), (B) moderate (dT/dt = 10°C/min), and (C) fast (dT/dt = 50°C/min) cooling. CH contrast images show organic material distribution with lighter colors corresponding to higher concentrations. In ice contrast images, lighter colors correspond to ice. Representative CRM spectra were collected from the numbered locations in the CRM images.
During moderate cooling, large (∼1–3 μm) ice crystals with smooth boundaries formed intracellularly (Fig. 1 B). Formation of intracellular ice did not result in darkening of the cell (as shown by the transmitted light microscopy image taken at 100× magnification). Post-thaw membrane integrity analysis demonstrated disruption of the cell membrane (only 3% of the cell population had intact membranes after freeze/thaw). Spectral characteristics of the ν-OH band of intracellular ice were very similar to extracellular ice, with the exception that there were trace amounts of organic matter present in intracellular ice (Fig. 1 B, spectra). The majority of the intracellular organic matter was compressed between the ice crystals. High-resolution scans of the intracellular regions with high organic matter content demonstrated that, even in these regions, very small ice crystals (detectable only by spectral analysis) were present.
During fast cooling, cells preserved their spherical shapes (Fig. 1 C). Spatially diffuse intracellular ice formation was observed throughout the cytoplasm. Ice/liquid water ratio measured within the cell during fast cooling was significantly higher than that measured during moderate cooling.
Note that none of the cells frozen down to −50°C (the temperature at which all CRM data were collected) exhibited darkening, which has traditionally been associated with intracellular ice formation (8). These results suggest that darkening does not directly correlate with intracellular ice formation but rather, it is an optical effect originating from rearrangement/aggregation of the intracellular organic matter by ice crystals.
Mammalian cells frozen in the presence of dimethylsulfoxide
To ensure maximum poststorage function and viability (which are cell-type-dependent) (15), mammalian cells must be frozen after equilibration in a solution containing a cryoprotectant agent such as dimethylsulfoxide (DMSO) or glycerol and following a thermal protocol where the ice nucleation temperature and the cooling rate are carefully controlled (1).
Cell membrane is highly permeable to DMSO and therefore equilibration of the cell in a 10% v/v DMSO solution is rapid (∼5 min for a dilute cell suspension). At equilibrium in 10% DMSO solution, water/DMSO ratio inside the cell was lower than that outside the cell (Fig. S2), indicating preferential partitioning of DMSO within the cell. Even though the distribution of organic material within the cell was relatively nonuniform, the distribution of DMSO within the cell was relatively homogeneous. Preferential partitioning of DMSO within the cell became more significant when the cells were frozen down to −50°C at a slow cooling rate of 1°C/min (Fig. 2 A) after extracellular ice nucleation at TN = −6°C (the equilibrium freezing temperature of 10% v/v DMSO is −4.5°C). Under these conditions, there was no detectable intracellular ice. It is noteworthy that extracellular ice contained trace amounts of DMSO. Similar to what was observed at room temperature, even though the distribution of organic material was nonuniform, distribution of DMSO within the cell was relatively homogeneous.
Figure 2.
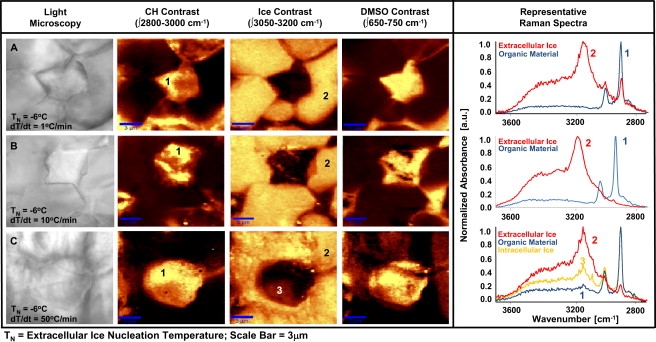
Light microscopy (first column) and CRM images (second and third columns) of fibroblasts frozen in 10% DMSO. Images at 100× magnification were collected at T = −50°C after ice nucleation at TN = −6°C and after (A) slow (dT/dt = 1°C/min), (B) moderate (dT/dt = 10°C/min), and (C) fast (dT/dt = 50°C/min) cooling. CH contrast images show organic material distribution with lighter colors corresponding to higher concentrations. In ice contrast images, lighter colors correspond to ice. Representative CRM spectra were collected from the numbered locations in the CRM images.
At moderate cooling (10°C/min), small regions of spatially diffuse intracellular ice were observed within the cell (Fig. 2 B). Interestingly, the intracellular regions high in organic material content did not contain any detectable intracellular ice (Fig. 2 B, spectra). Spectra obtained in regions of intracellular ice did not exhibit detectable levels of DMSO.
At fast cooling (50°C/min), intracellular ice was detected at amounts larger than that observed during moderate cooling (Fig. 2 C). Cells preserved their spherical shapes during freezing. In all of the cases examined, preferential partitioning of DMSO intracellularly was very significant. Even during fast cooling, intracellular vitrification was not observed.
The cells suspended in 1× PBS and 10% DMSO were also exposed to identical cooling/freezing regimes with TN = −10°C, and 10°C/min. The cells suspended in DMSO did not contain any intracellular ice whereas large ice crystals were present in the cells frozen in 1× PBS (Fig. S3).
Spatial distribution of intracellular water
The freezing conditions tested resulted in significantly different distributions of liquid water, and thus, hydration levels within the cell (Fig. 3 and Table 1). In 1× PBS, the average intracellular hydration level (calculated by the ratio of water/organic matter) did not vary very significantly between the cooling rates of 1°C/min and 10°C/min. However, spatial variation in hydration was higher in the 10°C/min case (Table 1). Note that in cells frozen fast (50°C/min), there was no detectable amount of liquid water present in any cell studied.
Figure 3.
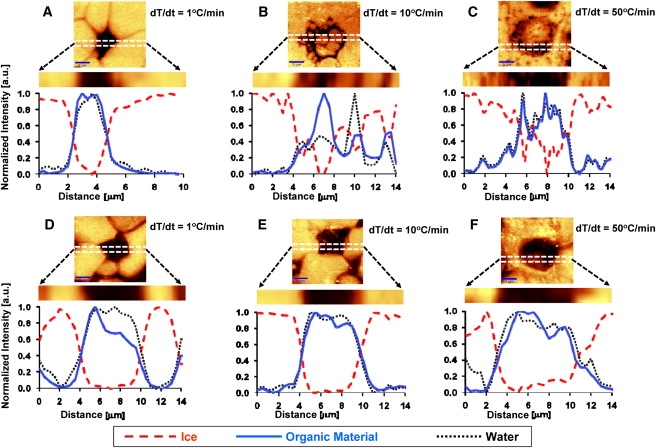
High-resolution line scans across single cells to determine the spatial variation of liquid water, ice, and organic matter in individual cells. (A) 1× PBS, dT/dt = 1°C/min; (B) 1× PBS, dT/dt = 10°C/min; (C) 1× PBS, dT/dt = 50°C/min; (D) 10% DMSO, dT/dt = 1°C/min; (E) 10% DMSO, dT/dt = 10°C/min; and (F) 10% DMSO, dT/dt = 50°C/min. The plots show the spatial variation of the constituents indicated in the legend along the dashed region shown in the CRM images.
Table 1.
Intracellular measurements
| 1× PBS, TN = −2°C | 10% DMSO, TN = −6°C | |||
|---|---|---|---|---|
| dT/dt = 1°C/min | R | dT/dt = 1°C/min | R | CDMSO |
| Cell No.1 | 0.14 ± 14% | Cell No.1 | 0.17 ± 26% | 48.98 ± 7.94 |
| Cell No.2 | 0.19 ± 52% | Cell No.2 | 0.43 ± 12% | 35.91 ± 2.32 |
| Cell No.3 | 0.27 ± 30% | Cell No.3 | 0.50 ± 19% | 33.61 ± 2.49 |
| dT/dt = 10°C/min | R | dT/dt = 10°C/min | R | CDMSO |
| Cell No.1 | 0.27 ± 193% | Cell No.1 | 0.93 ± 282% | 31.65 ± 2.17 |
| Cell No.2 | 0.14 ± 206% | Cell No.2 | 0.54 ± 224% | 31.88 ± 1.99 |
| Cell No.3 | 0.11 ± 136% | Cell No.3 | 1.19 ± 528% | 34.17 ± 0.64 |
| dT/dt = 50°C/min | R | dT/dt = 50°C/min | R | CDMSO |
| Cell No.1 | ∼0 | Cell No.1 | 1.02 ± 713% | 27.50 ± 2.30 |
| Cell No.2 | ∼0 | Cell No.2 | 1.21 ± 464% | 20.71 ± 2.42 |
| Cell No.3 | ∼0 | Cell No.3 | 1.24 ± 443% | 23.57 ± 2.70 |
R, Water/organic matter ratio (standard deviations are given as percent of the average). CDMSO, DMSO concentration (% v/v).
During slow cooling, the presence of DMSO did not affect the intracellular hydration level of the cells very significantly but with increasing cooling rate, hydration levels increased drastically (Table 1). Even at high cooling rate, in the presence of DMSO, average intracellular hydration levels were very high. However, spatial variation of hydration within the cells was significant and has increased (as high as 400–700% of the average) with the cooling rate.
Intracellular concentration of DMSO was also measured (Table 1). DMSO concentration did not significantly vary spatially but demonstrated a very strong dependence on the cooling rate. Note that to our knowledge, this is the first report of direct intracellular measurement of a CPA within a frozen mammalian cell. The intracellular DMSO concentrations reached during slow cooling were 100–150% higher than those reached during fast cooling (Table 1). These data show that, contrary to what is expected, fast cooling would not necessarily create better conditions for intracellular vitrification, which is believed to be crucial for successful preservation of most organisms (1,16–18).
Discussion
It is believed that two distinct populations of water exist inside a cell (19): The osmotically active water (i.e., free water) that crosses the cell membrane in response to chemical potential difference across the membrane; and the osmotically inactive water (i.e., bound water), which forms the hydration layers of the cellular structures and the endogenous macromolecules. Intracellular presence of free water is thought to be responsible for intracellular ice formation, whereas extreme dehydration yielding to the dissociation of bound water is hypothesized to cause irreversible damage to endogenous structures.
Freezing in 1× PBS
Reduction in the size of a cell during slow freezing or the corresponding lack of shrinkage observed at high cooling rates is consistent with previous reports of cell freezing in 1× PBS (20). It is also noteworthy that both intracellular water and the cellular contents are fairly uniformly distributed within the cell and colocalized, implying that the dehydration process is largely uniform. The lack of observable intracellular ice during slow cooling (Figs. 1 A and 3 A) combined with the low levels of intracellular hydration (Table 1) indicated that all the remaining intracellular water was bound (to the cellular structures).
Observation of intracellular ice at higher cooling rates is also consistent with the previous reports (3,21). At high cooling rates, in contrast to that observed at slow cooling, water and cellular organic material concentrations vary greatly across the cell and do not colocalize, implying that there are pockets of intracellular free liquid water (not bound to cellular structures) that transitions to intracellular ice (Fig. 3, B and C). As the cooling rate increases, variations in spatial distribution of liquid water and organic material (i.e., microheterogeneity) increase. It is interesting that the microheterogeneity appears to increase with increasing cooling rate despite the fact that ice crystal size decreases, implying that the two phenomena may actually be decoupled. In other words, intracellular ice does not cause redistribution of organic material in the cell. Diffuse intracellular ice and very high intracellular ice/liquid water ratios measured during fast cooling indicated that most of the bound water was removed (from cellular structures) and joined the ice phase, causing even more excessive dehydration than slow cooling (Table 1).
Intracellular ice has been observed since the 1970s but until now, there has been no elucidation as to the actual molecular mechanism of cell damage during rapid freezing. CRM analysis provides what we believe is the first direct evidence that intracellular ice causes extreme intracellular dehydration (even more than that observed in slow cooling) and causes significant intracellular microheterogeneity (Fig. 3).
Freezing in 10% DMSO
In cells frozen in the presence of DMSO, spatial distribution of intracellular water was fairly uniform. There were slight variations in organic material distribution (these shifts were significantly smaller than those observed in 1× PBS). As the cooling rate was increased, the distribution of intracellular water and organic material was left largely unchanged, which contrasts greatly with what was observed at the same cooling conditions in the absence of DMSO. This implies that DMSO alters the distribution of intracellular organic material independent of the freezing rate. DMSO is associated with a wide array of cellular effects including shifts in metabolism and cytoskeletal organization (22) and these shifts in the distribution of organic material may be a manifestation of those effects. Increase in the intracellular hydration levels of cells with increasing cooling rate (Table 1) combined with the observed preferential intracellular accumulation of DMSO indicated that DMSO replaced the intracellular free water while it was preferentially excluded from the endogenous macromolecules (keeping their hydration layers intact). This may help reveal one mechanism of protection offered by DMSO. Mechanism of protection offered by DMSO based on preferential exclusion has been reported previously (23), and is reasonable given that, at high concentrations (where specific associations are unavoidable), it is known to be detrimental to macromolecules (24). Note that cryo-/lyoprotection offered by preferential exclusion is not unique to DMSO but is observed in sugars as well (25,26).
Confocal Raman microspectroscopy conducted at cryogenic temperatures with single cells provided critical information on the state of intracellular water, the distribution of CPAs, and the responses of subcellular structures at the frozen state. This study provides the first direct evidence, to our knowledge, that intracellular ice causes extreme intracellular dehydration (even more so than slow cooling) and causes significant intracellular microheterogeneity. In addition, CRM also has provided insight into the potential mechanisms of protection offered by DMSO. Specifically, this study demonstrated that intracellular structures were kept hydrated at higher levels in the presence of DMSO.
Acknowledgments
Parts of this work were carried out in the College of Science and Engineering Characterization Facility, University of Minnesota, a member of the National Science Foundation-funded Materials Research Facilities Network (www.mrfn.org).
Funding for this research was provided by University of Minnesota Biopreservation Core Resource (BioCoR), an entity funded by the Academic Health Center, College of Science and Engineering, Medical School, Medical Devices Center, and the Institute for Engineering in Medicine at the University of Minnesota. Partial funding for pilot experiments was supplied by the Biotransport Center at the University of Minnesota.
Supporting Material
References
- 1.Fuller B.J., Lane A.N., Benson E.E. CRC Press; Boca Raton, FL: 2004. Life in the Frozen State. [Google Scholar]
- 2.Polge C., Smith A.U., Parkes A.S. Revival of spermatozoa after vitrification and dehydration at low temperatures. Nature. 1949;164:666. doi: 10.1038/164666a0. [DOI] [PubMed] [Google Scholar]
- 3.Mazur P. Freezing of living cells: mechanisms and implications. Am. J. Physiol. 1984;247:C125–C142. doi: 10.1152/ajpcell.1984.247.3.C125. [DOI] [PubMed] [Google Scholar]
- 4.Robards A.W., Sleytr U.B. Elsevier; Amsterdam, The Netherlands: 1985. Low temperature methods in biological electron microscopy. In Practical Methods in Electron Microscopy. [Google Scholar]
- 5.Echlin P. Plenum Press; New York: 1992. Low Temperature Microscopy and Analysis. [Google Scholar]
- 6.Steinbrecht R.A., Zierold K. Springer-Verlag; New York: 1987. Cryotechniques in Biological Electron Microscopy. [Google Scholar]
- 7.Bank H., Mazur P. Visualization of freezing damage. J. Cell Biol. 1973;57:729–742. doi: 10.1083/jcb.57.3.729. [DOI] [PMC free article] [PubMed] [Google Scholar]
- 8.Stott S.L., Karlsson J.O.M. Visualization of intracellular ice formation using high-speed video cryomicroscopy. Cryobiology. 2009;58:84–95. doi: 10.1016/j.cryobiol.2008.11.003. [DOI] [PubMed] [Google Scholar]
- 9.Luby-Phelps K., Taylor D.L., Lanni F. Probing the structure of cytoplasm. J. Cell Biol. 1986;102:2015–2022. doi: 10.1083/jcb.102.6.2015. [DOI] [PMC free article] [PubMed] [Google Scholar]
- 10.Kao H.P., Abney J.R., Verkman A.S. Determinants of the translational mobility of a small solute in cell cytoplasm. J. Cell Biol. 1993;120:175–184. doi: 10.1083/jcb.120.1.175. [DOI] [PMC free article] [PubMed] [Google Scholar]
- 11.Potma E.O., de Boeij W.P., Wiersma D.A. Real-time visualization of intracellular hydrodynamics in single living cells. Proc. Natl. Acad. Sci. USA. 2001;98:1577–1582. doi: 10.1073/pnas.031575698. [DOI] [PMC free article] [PubMed] [Google Scholar]
- 12.Krafft C., Dietzek B., Popp J. Raman and CARS microspectroscopy of cells and tissues. Analyst (Lond.) 2009;134:1046–1057. doi: 10.1039/b822354h. [DOI] [PubMed] [Google Scholar]
- 13.García-Martín M.L., Ballesteros P., Cerdán S. The metabolism of water in cells and tissues as detected by NMR methods. Prog. Nucl. Magn. Reson. Spectrosc. 2001;39:41–77. [Google Scholar]
- 14.Dong J., Hubel A., Aksan A. Freezing-induced phase separation and spatial microheterogeneity in protein solutions. J. Phys. Chem. B. 2009;113:10081–10087. doi: 10.1021/jp809710d. [DOI] [PubMed] [Google Scholar]
- 15.Meryman H.T. Cryoprotective agents. Cryobiology. 1971;8:173–183. doi: 10.1016/0011-2240(71)90024-1. [DOI] [PubMed] [Google Scholar]
- 16.Crowe J.H., Carpenter J.F., Crowe L.M. The role of vitrification in anhydrobiosis. Annu. Rev. Physiol. 1998;60:73–103. doi: 10.1146/annurev.physiol.60.1.73. [DOI] [PubMed] [Google Scholar]
- 17.Fahy G.M., Wowk B., Zendejas E. Cryopreservation of organs by vitrification: perspectives and recent advances. Cryobiology. 2004;48:157–178. doi: 10.1016/j.cryobiol.2004.02.002. [DOI] [PubMed] [Google Scholar]
- 18.Fahy G.M., MacFarlane D.R., Meryman H.T. Vitrification as an approach to cryopreservation. Cryobiology. 1984;21:407–426. doi: 10.1016/0011-2240(84)90079-8. [DOI] [PubMed] [Google Scholar]
- 19.Clegg J.S. Intracellular water and the cytomatrix: some methods of study and current views. J. Cell Biol. 1984;99:167s–171s. doi: 10.1083/jcb.99.1.167s. [DOI] [PMC free article] [PubMed] [Google Scholar]
- 20.Diller K.R., Cravalho E.G. A cryomicroscope for the study of freezing and thawing processes in biological cells. Cryobiology. 1970;7:191–199. doi: 10.1016/0011-2240(70)90021-0. [DOI] [PubMed] [Google Scholar]
- 21.Balasubramanian S.K., Bischof J.C., Hubel A. Water transport and IIF parameters for a connective tissue equivalent. Cryobiology. 2006;52:62–73. doi: 10.1016/j.cryobiol.2005.09.009. [DOI] [PubMed] [Google Scholar]
- 22.Fahy G.M. The relevance of cryoprotectant “toxicity” to cryobiology. Cryobiology. 1986;23:1–13. doi: 10.1016/0011-2240(86)90013-1. [DOI] [PubMed] [Google Scholar]
- 23.Arakawa T., Carpenter J.F., Crowe J.H. The basis for toxicity of certain cryoprotectants—a hypothesis. Cryobiology. 1990;27:401–415. [Google Scholar]
- 24.Arakawa T., Kita Y., Timasheff S.N. Protein precipitation and denaturation by dimethyl sulfoxide. Biophys. Chem. 2007;131:62–70. doi: 10.1016/j.bpc.2007.09.004. [DOI] [PubMed] [Google Scholar]
- 25.Malsam J., Aksan A. Hydrogen bonding and kinetic/thermodynamic transitions of aqueous trehalose solutions at cryogenic temperatures. J. Phys. Chem. B. 2009;113:6792–6799. doi: 10.1021/jp8099434. [DOI] [PubMed] [Google Scholar]
- 26.Arakawa T., Timasheff S.N. Stabilization of protein structure by sugars. Biochemistry. 1982;21:6536–6544. doi: 10.1021/bi00268a033. [DOI] [PubMed] [Google Scholar]
Associated Data
This section collects any data citations, data availability statements, or supplementary materials included in this article.