

Abstract
Skeletal muscle stores Ca2+ in the sarcoplasmic reticulum (SR) and releases it to initiate contraction, but the concentration of luminal Ca2+ in the SR ([Ca2+]SR) and the amount that is released by physiological or pharmacological stimulation has been difficult to measure. Here we present a novel, yet simple and direct, method that provides the first quantitative estimates of static content and dynamic changes in [Ca2+]SR in mammalian skeletal muscle, to our knowledge. The method uses fluo-5N loaded into the SR of single, mammalian skeletal muscle cells (murine flexor digitorum brevis myofibers) and confocal imaging to detect and calibrate the signals. Using this method, we have determined that [Ca2+]SR, free is 390 μM. 4-Chloro-m-cresol, an activator of the skeletal muscle ryanodine receptor, reduces [Ca2+]SR, free to ∼8 μM, when values are corrected for background fluorescence from cytoplasmic pools of dye. Prolonged electrical stimulation (10 s) at 50 Hz releases 88% of the SR Ca2+ content, whereas stimulation at 1 Hz (10 s) releases only 20%. Our results lay the foundation for molecular modeling of the dynamics of luminal SR Ca2+ and for future studies of the role of SR Ca2+ in healthy and diseased mammalian muscle.
Introduction
Contraction in skeletal muscle begins with the activation of L-type calcium channels (CaV1.1 or dihydropyridine receptors), which open Ca2+ release channels (ryanodine receptors, RyR1) in the junctional sarcoplasmic reticulum (jSR) through direct mechanical signals (1,2). Much of the Ca2+ stored in the SR lumen is concentrated in the jSR, due in large part to the presence of calsequestrin, the primary Ca2+-binding protein in the SR, which associates with RyR1 (3,4). The global rise in myoplasmic [Ca2+] that initiates contraction occurs as Ca2+ is lost from the lumen of the SR. Relaxation occurs as Ca2+ is reconcentrated in the SR lumen through the activity of the sarcoplasmic/endoplasmic reticulum Ca2+-ATPase (SERCA), which is present in the network compartment of the SR (nSR) as well as in the jSR. Studies in the heart have demonstrated interconnectivity of the SR components with each other and with the nuclear envelope (5).
Until recently, most measures of the release and reuptake of Ca2+ by the SR have been inferred by monitoring changes in myoplasmic Ca2+ ([Ca2+]i), not [Ca2+]SR. Over the last decade, several groups have worked to close this gap. Kabbara and Allen (6) were the first to load fluo-5N into lumbrical muscle from the cane toad and make simultaneous measurements of force and [Ca2+]SR, along with measurements of the change in [Ca2+]SR associated with fatigue. Launikonis et al. (7) later used mag-indo-1, specifically loaded into the SR of frog skeletal muscle, to measure [Ca2+]SR. By using this ratiometric Ca2+ indicator in the SR lumen and a second Ca2+ dye, rhod-2, in the cytosol of the fibers, Launikonis et al. (8) were able to record Ca2+ sparks and the reciprocal reduction of [Ca2+]SR. More recently, two groups used the calmodulin-based Ca2+ biosensor, D1ER, targeted with a KDEL motif, to make the first direct measurement of [Ca2+] in the ER and SR compartments of mammalian skeletal muscle (9–11). Although these results were very promising, their use of the KDEL motif may have targeted D1ER in part to ER rather than SR domains (12), which may account for the differences in their results. Thus, accurate measurements of changes in [Ca2+] that occur specifically in the SR are still needed.
Here we show that fluo-5N, a low affinity Ca2+ indicator, accurately tracks the dynamic changes in [Ca2+] in the SR of murine flexor digitorum brevis (FDB) myofibers. Fluo-5N senses changes in [Ca2+]SR in intact FDB fibers triggered by either electrical stimulation or exposure to 4-chloro-m-cresol (4-CmC), a RyR1 agonist. Changes in stimulation frequency led to graded changes in the [Ca2+]SR, as measured by fluo-5N fluorescence signals. We measured the free [Ca2+]SR content and the dynamic range of [Ca2+] sensed by fluo-5N by performing an in situ calibration of fluo-5N fluorescence within the SR lumen of saponin-permeabilized fibers by exposing the SR membrane to ionomycin in the presence of known buffered [Ca2+]. To our knowledge, measurement of fluorescence recovery after photobleaching (FRAP) of the fluo-5N signal demonstrated for the first time in skeletal muscle that small molecules within the SR move rapidly between the jSR and nSR compartments. Our results show that fluo-5N can be loaded directly and efficiently into the lumen of the SR of mammalian skeletal muscle to enable direct measurements of SR Ca2+ dynamics with high spatial and temporal sensitivity.
Materials and Methods
Cell isolation
Flexor digitorum brevis (FDB) fibers were isolated from young adult CD1 mice using established methods (13). Briefly, FDB muscles were digested in 2–3 mg/mL collagenase type 2 (Worthington Biochemical, Lakewood, NJ) in MEM media (Invitrogen, Carlsbad, CA) for 3–4 h at 37°C. Cells were plated on standard plastic culture dishes and maintained in culture (37°C with 5% CO2) in MEM media plus 0.1% gentamicin (Sigma Aldrich, St. Louis, MO) for 24–48 h.
SR dye loading
Cells were loaded in a solution of fluo-5N (Invitrogen, Carlsbad, CA) dissolved in 20% pluronic in dimethyl sulfoxide (DMSO), and diluted in culture medium (above) to a final concentration of 10 μM. Loading was at 37°C for 2 h, to allow uptake of dye into the cytosol and its deesterification in the lumen of the SR. After loading, cells were incubated for 1 h at room temperature followed by 1 h at room temperature in medium containing 10 μM 1,2-bis(o-aminophenoxy)ethane-n,n,n′,n′-tetraacetic acid (BAPTA) (BAPTA-AM; Invitrogen; dissolved in 20% pluronic in DMSO) and 25 μM N-benzyl-p-toluene sulfonamide (BTS; Sigma Aldrich; dissolved in DMSO), to prevent contraction during imaging. During 37°C loading of fluo-5N, fibers were plated on coverslips coated with Matrigel (BD Biosciences, San Jose, CA). BAPTA-AM also reduced the fluorescence arising from fluo-5N molecules remaining in the cytosol and minimized the loss of fibers caused by the maximal release of Ca2+ from the SR. Fibers were studied within 2 h after loading was terminated.
Confocal microscopy and image analysis
Confocal images were acquired on an inverted microscope (Axiovert 200M LSM-510; Carl Zeiss, Germany) equipped with an oil immersion objective (40×, 1.2 NA) and a 488-nm excitation laser, which we used in either linescan or full frame modes. Linescans were taken from the middle 50% of the cell volume, avoiding the cell periphery. Fluorescence intensity analysis utilized the softwares ImageJ (National Institutes of Health, Bethesda, MD), Excel 2007 (Microsoft, Redmond, WA), and GraphPad Prism 4 (GraphPad Software, http://www.graphpad.com/prism/prism.htm). Statistical significance was assessed by ANOVA analysis followed by Newman-Keuls pairwise comparisons, with a significance level of p < 0.05.
T-tubule staining
The sarcolemma and t-tubules were fluorescently labeled using 10 μM di-8-ANEPPS (Invitrogen) dissolved in DMSO (14). Fibers loaded with fluo-5N were exposed to di-8-ANEPPS for 15 min before imaging.
Ca2+ transients induced by 4-CmC
Fibers loaded with fluo-5N were imaged in normal Tyrode's solution (NT), containing 140 mM NaCl, 0.5 mM MgCl2, 0.3 mM NaH2PO4, 5 mM HEPES, 5.5 mM glucose, 1.8 mM CaCl2, and 5 mM KCl, pH 7.4 with NaOH. Changes in the fluo-5N signal in response to bath application of 1 mM 4-chloro-m-cresol (4-CmC) in NT were recorded with the confocal microscope in linescan mode. Fluo-5N was excited with a 488-nm laser and emitted light was filtered through a long-pass, 505-nm filter. A solutions of 1 mM 4-CmC in NT was applied until the fluorescence signal reached a plateau, after which it was washed out with fresh NT. Data were analyzed as F/F0, where F0 is the fluorescence at the steady state before the application of 4-CmC, or as ΔF/FCmC, where FCmC is the fluorescence at the plateau reached in response to 4-CmC. The rate of recovery of fluorescence, τ, was calculated by exponential fit of the rapid phase of recovery of the fluorescence signal after 4-CmC was washed out.
Ca2+ transients induced by electrical stimulation
Electrical stimulation (0.5 ms pulse duration, 40 V/cm2, 1–50 Hz for 10 s) was used to trigger incremental SR Ca2+ release. Stimulation was produced with a Myopacer (IonOptix, Milton, MA) through platinum electrodes placed on either side of the fiber of interest. After a brief period of inactivity, we rapidly perfused 4-CmC onto the fiber (see above) to measure its maximal release of Ca2+ from the SR.
In vivo calibration of Ca2+-dependent fluo-5N fluorescence within the SR lumen
After loading fluo-5N, the sarcolemmal membranes of FDB fibers were permeabilized by a 60 s exposure to 0.007% saponin in a solution containing 90 mM K-Glutamate, 1.02 mM MgCl2, 5 mM NaCl, 10 mM HEPES, 1 mM BAPTA, 0.323 mM CaCl2, 2% PVP (1 mM free Mg2+; 0.0001 mM free Ca2+), pH 7.2, adjusted with KOH. The permeabilized myofiber was exposed to 10−6 M ionomycin (Cat. No. I9657; Sigma Aldrich) in the same solution to promote equilibration of free [Ca2+] among the bathing solution, the myoplasm, and the lumen of the SR. Ionomycin was present in all subsequent solutions.
For all solutions, free [Mg2+] was set at 1 mM and free [Ca2+] was set at concentrations ranging from 10−7 to 10−2 M by buffering with 1 mM of 1,2-bis(o-aminophenoxy)ethane-n,n,n′,n′-tetraacetic acid (BAPTA), N-(2-hydroxyethyl)ethylene-diamine-n,n′,n′-triacetic acid (HEDTA), nitrilotriacetic acid (NTA), or K-Citrate (Sigma Aldrich), as calculated by MaxChelator (www.stanford.edu/∼cpatton/webmaxc/webmaxcE.htm). Once the KD of fluo-5N and [Ca2+]SR, rest were established, fluorescence recordings of 4-CmC-induced [Ca2+]SR transients were assessed with Eq. 2 (15) for use with single wavelength fluo-based Ca2+ indicators, modified for measurements of [Ca2+]SR. The equation describes the molar value of [Ca2+]SR as the relationship between the KD of fluo-5N for Ca2+, the resting [Ca2+]SR before stimulation and R, the normalized fluorescence signal F/Frest. Given that fluo-based dyes have a value of Fmin near 0, Fmax can be defined as in Eq. 1 (15),
| (1) |
| (2) |
Fluorescence recovery after photobleaching
XY images of FDB myofibers loaded with fluo-5N were obtained approximately every 1 s. After five images were captured with 488 nm excitation at 0.5% laser transmission, a region of interest (ROI), ∼15 × 15 μm, was photobleached with 100% transmission of both 458 nm and 488 nm laser lines for 10 iterations. An XY image was captured immediately thereafter, to establish the extent of the photobleach, and at intervals of 1 s thereafter, to follow recovery. ImageJ (National Institutes of Health, Bethesda, MD) was used to obtain the fluorescence profile of the photobleached ROI and to normalize the changes in fluorescence of the ROI to nonspecific photobleaching away from the ROI. Percent recovery and recovery kinetics were calculated based on the fluorescence profile. The recovery phase of the fluorescence profile was fit to a single exponential (Graphpad Prism 4) to obtain τ and half-life of recovery. Diffusion coefficients were calculated using an established mathematical model, VIRTUAL FRAP (16,17). This program facilitates the modeling of molecule diffusion within cells based on parameters determined empirically from experimental data. We uploaded a timed series of confocal images (which include both timing and pixel size data in their file header) tracking the bleach and recovery of fluo-5N fluorescence. To analyze the diffusion rate in each cell using VIRTUAL FRAP we defined three ROIs: 1), the whole cell; 2), the bleach region; and 3), the background region beyond the cell boundaries. A Gaussian fit of recovery after photobleaching was used to assess the two-dimensional diffusion rate of fluo-5N within the user-defined ROIs. We then used VIRTUAL FRAP to run a series of two-dimensional diffusion simulations of eight ROIs within each of the original bleached ROIs to obtain a best-fit for the diffusion coefficient, D. Although the program is designed to measure fluorescence in a z-stack, the rapid recovery of fluo-5N fluorescence required us to record FRAP in a single plane of focus. Because of this difference, the diffusion coefficient we calculate should be considered only as a first approximation.
Results
We used fluo-5N, loaded selectively into the lumen of the SR of murine FDB myofibers, to measure the Ca2+ concentration in the lumen of the SR ([Ca2+]SR) and the dynamic changes that occur as muscle is activated to contract.
Distribution of fluo-5N in intact mouse FDB fibers
Myofibers were equilibrated with fluo-5N AM at 37°C (see Materials and Methods). Upon deesterification of the dye, fluo-5N fluorescence had a distinct distribution within the fibers (Fig. 1). To characterize the subcellular distribution of fluo-5N fluorescence, we colabeled fibers with the lipophilic indicator, di-8-ANEPPS, to identify the sarcolemma and t-tubule membranes. Confocal imaging showed that di-8-ANEPPS (Fig. 1 A) and fluo-5N (Fig. 1 B) had very similar and overlapping intracellular patterns of fluorescence, with regularly occurring punctate bands oriented transversely across each myofiber. A fluorescence profile of a selected region (open box and lower panels) revealed the presence of doublets, which in the case of di-8-ANEPPS, represent the t-tubules at the A-I junctions. The doublets of fluo-5N distribution is consistent with concentrations of dye in the jSR (18). The lower level of fluorescence between the t-tubules, presumably surrounding the Z-disk, is likely to be due to fluo-5N in the nSR, although some may be mitochondrial in origin (see Discussion).
Figure 1.

Subcellular distribution of fluo-5N in mouse FDB fibers. To identify the location of fluo-5N fluorescence relative to the location of t-tubules, we treated loaded fibers with di-8-ANEPPS (A). Intact mouse FDB fibers loaded with fluo-5N have a distinct fluorescence pattern (B). Overlay of the images for fluo-5N and di-8-ANEPPS shows that the dyes have very similar distributions (C). Panels A′–C′ show a region marked by boxes in A–C magnified threefold. A fluorescence profile of the overlay image (D) in this region show the expected distribution of the t-tubules at the level of the A-I junction, where fluo-5N fluorescence also concentrates. Scale bars in A–C represent 10 μm.
Ca2+ and fluo-5N mobility within the SR
To test the interconnectivity of the SR of mammalian skeletal muscle, we carried out similar FRAP experiments in fibers loaded with fluo-5N. We collected full frame XY images at ∼1 Hz (Fig. 2 A), then rapidly photobleached a 15 × 15 μm region. Immediately after the photobleaching (Fig. 2 B), we resumed XY imaging until fluorescence recovery reached steady state (Fig. 2 C). Fig. 2 D shows the average time-course of the recovery of the region of interest normalized to a nonbleached region (green dashed line) and the redistribution of fluorescence in the nonbleached region back to the bleached region. In the region of interest, the intensity of fluorescence recovered to ∼96% of its original value, with a half-time of ∼4 s. We analyzed the rate of diffusion for fluo-5N D = 1.3 ± 0.26 × 10⁻⁷ cm2/s within the SR lumen using VIRTUAL FRAP, a mathematical computer model for analyzing experimental FRAP data (see Materials and Methods). Although only an approximation, this rate is consistent with free diffusion of fluo-5N within the jSR and nSR.
Figure 2.
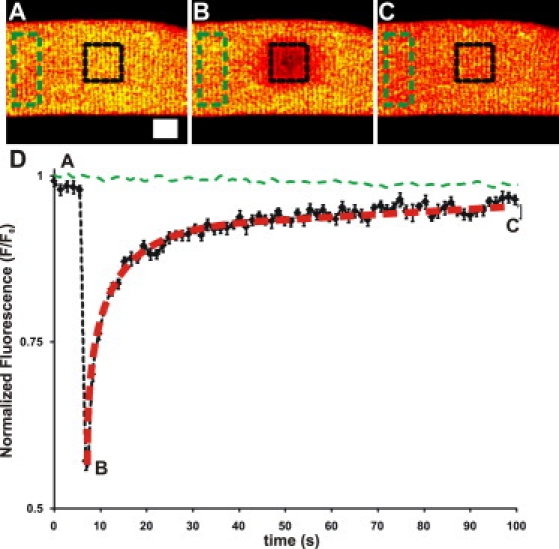
Fluorescence recovery after photobleaching (FRAP) of fluo-5N in the SR lumen Fluo-5N was loaded into FDB myofibers and subjected to FRAP. X-Y images were captured every ∼1 s to monitor the change in fluorescence before and after bleaching of a 15 × 15 μm area. The fluorescence of the bleached region was normalized to a nonbleached region and plotted over time (graph). Representative images taken (A) before the bleach, (B) immediately after the bleach, (C) and after recovery show the progression of recovery (scale bars represent 10 μm). (D) Plot of the time-course of the fluorescence change in the bleached region (black line) and in the surround (green dashed line). Fluo-5N fluorescence recovered to 96 ± 0.53% of the original fluorescence (n = 12). The recovery was fit with a single exponential curve (red dotted line) to calculate the half-life of recovery (3.85 ± 0.10 s) and τ (5.55 ± 0.15 s). The results suggest that fluo-5N can freely diffuse within the lumen.
Response of fluo-5N to 4-CmC application
If fluo-5N is sequestered in the lumen of the SR, the intensity of its fluorescence should change as luminal [Ca2+] is depleted by the activation of RyR1s. We used confocal linescan imaging to measure the response of luminal fluo-5N to 1 mM 4-chloro-m-cresol (4-CmC), a potent agonist of RyR1 (19) (Fig. 3). Treatment of myofibers loaded with fluo-5N with 4-CmC led to a rapid decrease in fluorescence, which reached a new steady-state level over a period of a few seconds. Upon removal of 4-CmC from the bathing solution, fluorescence recovered to the original level (Fig. 3 A). In fibers pretreated with 10 μM thapsigargin, an irreversible inhibitor of SERCA (20), exposure to 4-CmC caused the same rapid decrease in fluo-5N fluorescence, but the fluorescence signal did not return to its original levels after washout (Fig. 3 B). These data suggest that fluo-5N is trapped within an organelle, in which the [Ca2+] is reduced by RyR1 agonists and SERCA inhibitors: the SR. Although some fluo-5N may be present in the cytosol or sequestered in mitochondria, several factors mitigate signals from either compartment contributing significantly to our measurements:
Mitochondria make up a very small portion of the cellular volume (8–10% (21)) and could therefore respond to only a very small portion of the [Ca2+]i as it changes during the transients we induce.
BAPTA in the cytosol will compete for cytosolic Ca2+ very effectively with fluo-5N, present in either the cytosol or mitochondria. The change in fluorescence induced by 4-CmC, a measure of maximal release of [Ca2+]SR, was consistently ∼60% of Finitial.
Figure 3.
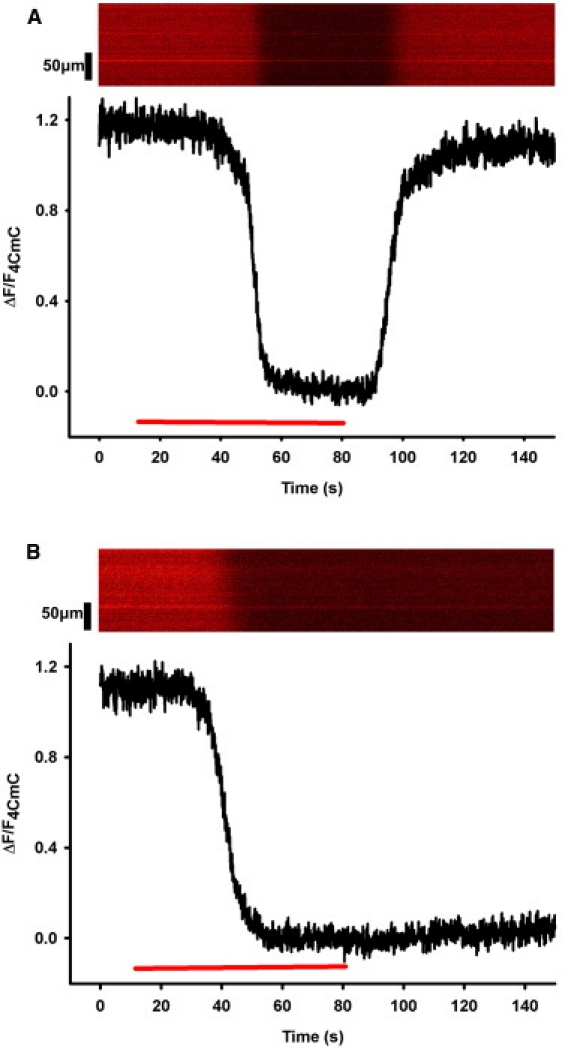
Effects of 4-CmC and thapsigargin on fluo-5N fluorescence Fluo-5N was loaded into FDB myofibers and its fluorescence was monitored by linescan confocal microscopy. Bath application of 1 mM 4-CmC (red bar), a potent RyR1 agonist, causes a rapid decrease in fluorescence (A). When 4-CmC is removed, fluorescence recovers (A). Incubation of loaded fibers for 10 min with 10 μM thapsigargin, an irreversible SERCA inhibitor, followed by application of 4-CmC (red bar) also causes a rapid decrease in fluorescence, but upon washout there is no recovery (B). NB: Fluorescence profiles of the representative linescan images are normalized so that F4CmC is equal to 0.
Response of fluo-5N to electrical stimulation
We next tested the response of fluo-5N to physiologic stimulation by subjecting FDB fibers loaded with the dye to trains of voltage pulses, applied at 1, 10, or 50 Hz by field stimulation for periods of 10 s (Fig. 4); >80% of fibers positive for fluo-5N fluorescence responded to electrical stimulation. After the cessation of stimulation and the return to baseline levels of fluorescence, we challenged the myofibers with 1 mM 4-CmC to determine the change in fluorescence associated with maximal release. The change in fluorescence caused by electrical stimulation was significantly smaller than that caused by 4-CmC. Stimulation at 1 Hz caused a relatively small change in fluorescence, whereas higher frequencies (10 and 50 Hz) caused a much larger change. Comparison of the changes in fluorescence induced by stimulation to the maximal change induced by 4-CmC revealed the fractional changes at each frequency (Table 1 and Fig. 4 E). The change in fluorescence (F/Fi) induced by 4-CmC application was unaltered by any voltage stimulation paradigm (Fig. 4 D). Although the presence of BAPTA in the cytosol may affect the amplitude of the changes in [Ca2+]SR transients by altering Ca2+-dependent inactivation of RyR1 during brief depolarizations or action potentials, in this study the quantitative impact of any such effect is minimized by the fact that BAPTA is also present during maximal [Ca2+]SR release events, stimulated with 4-CmC. Nevertheless, Fluo-5N can be used to report changes in [Ca2+]SR in the absence of BAPTA, but it yields ∼30% of the F/Fi as compared to measurements made in cells preloaded with 10 μM BAPTA (Fig. S1 in the Supporting Material). This difference is unlikely to be due solely to the effects of BAPTA on RyR1 inactivation and instead may be due to increased background coming from the fact that the ability of cytosolic fluo-5N to bind Ca2+ is not prevented by BAPTA. Thus, given these potential effects of BAPTA, our results are likely to provide an upper estimate of changes in [Ca2+]SR evoked by either electrical stimulation or 4-CmC.
Figure 4.
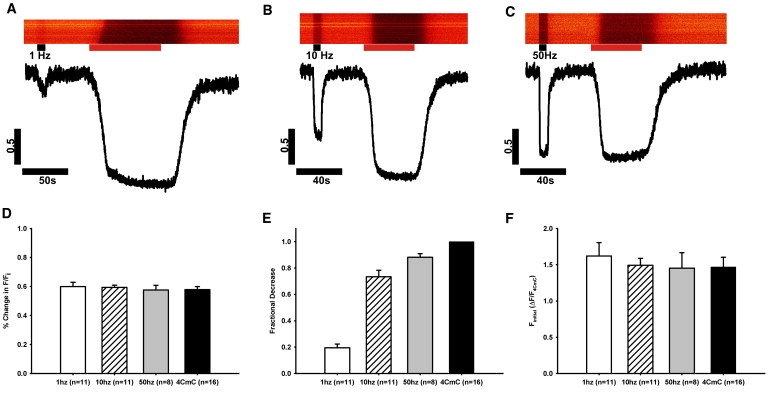
Changes in fluo-5N fluorescence induced by electrical stimulation fibers were loaded with fluo-5N and stimulated at 1 Hz (A, n = 11 fibers), 10 Hz (B, n = 11), or 50 Hz (C, n = 8) for 10 s (black bars). (D) After a recovery of the fluorescent signal, 4-CmC was applied (red bars) to measure maximal [Ca2+]SR. Fluorescence profiles were normalized to the response to 4-CmC and plotted as time (s) versus ΔF/F4CmC. The response to 4-CmC application consistently yielded a decrease in fluorescence of ∼60% from baseline, regardless of previous stimulation (0.58 ± 0.021, n = 16). (E) Fractional [Ca2+]SR release was calculated by comparing the decrease in fluo-5N fluorescence during electrical stimulation to the 4CmC response. (F)When fluorescence profiles of each stimulation rate were normalized to ΔF/F4CmC, the value Finitial, the fluorescence at the initiation of the experiment, was unchanged between groups and therefore could be used as a simple measure of resting [Ca2+]SR.
Table 1.
Fractional Release of [Ca2+]SR
| Stimulation | Fractional release | [Ca2+]SR, free (μM) |
|---|---|---|
| 1 Hz | 0.195 ± 0.029 | 261 ± 15.8 |
| 10 Hz | 0.734 ± 0.049 | 101 ± 11.1 |
| 50 Hz | 0.882 ± 0.028 | 79 ± 8.4 |
| 1 mM 4CmC | 1 | 62 ± 4.3 (raw)8 ± 1.6 (corrected) |
FDB fibers were loaded with fluo-5N and exposed to trains of electrical field stimulation at frequencies of 1, 10, or 50 Hz for 10 s. Changes in fluo-5N fluorescence were monitored under confocal optics. After stimulation, fluorescence returned to baseline and the fibers were treated with 1 mM 4-CmC to induce maximal SR Ca2+ release. Fractional release was calculated by comparing the electrically induced fluorescence change to the 4-CmC-induced change. Using the KD and resting [Ca2+]SR,free values calculated by in situ calibration of fluo-5N (see Fig. 5) and applying equations derived by Cannell et al. (15), we calibrated the new [Ca2+]SR,free after steady-state activation at each stimulation frequency. As described in Fig. 6, 4-CmC induced transients in intact fibers appears to reduce [Ca2+]SR,free to ∼60 μM. Calibration of the [Ca2+]SR, free after 4-CmC treatment by permeabilization demonstrates that 4-CmC actually reduces [Ca2+]SR,free to ∼8 μM. The background correction made to 4-CmC-induced [Ca2+]SR,free (see Fig. 6) suggests that [Ca2+]SR,free calculated for near tetanic stimulation rates, where fractional release approaches 1, is likely to be overestimated.
Quantitation of resting [Ca2+] in the lumen of the SR
To determine both the resting [Ca2+]SR and the dynamic range of [Ca2+] that could be measured, we loaded myofibers with fluo-5N and then permeabilized them with saponin before imaging began. This allowed us to record the signal due to resting [Ca2+]SR (Fig. 5). Fibers were then exposed to 1 μM ionomycin in the presence of 10−7 M free [Ca2+] to make the SR membrane permeant to divalent cations while keeping fluo-5N trapped in the SR lumen. This allowed us to measure the levels of fluorescence associated with the lowest possible values of [Ca2+]SR. Finally, fibers were exposed to solutions buffered to different concentrations of free [Ca2+], still in the presence of ionomycin, to establish the dynamic range of response of fluo-5N within the SR lumen (Fig. 5 A). The steady-state fluorescence at each Ca2+ concentration was used to create a standard curve for fluo-5N response to free [Ca2+] (Fig. 5 B). As expected, free [Ca2+] at 10−7 M generated a minimal value (Fmin), whereas concentrations at 10−2 M approached maximal values (Fmax). Using the standard curve, we were able to calculate the KD for fluo-5N to be 133 ± 0.12 μM and the resting free [Ca2+]SR in mouse FDB fibers to be 391 ± 64 μM.
Figure 5.
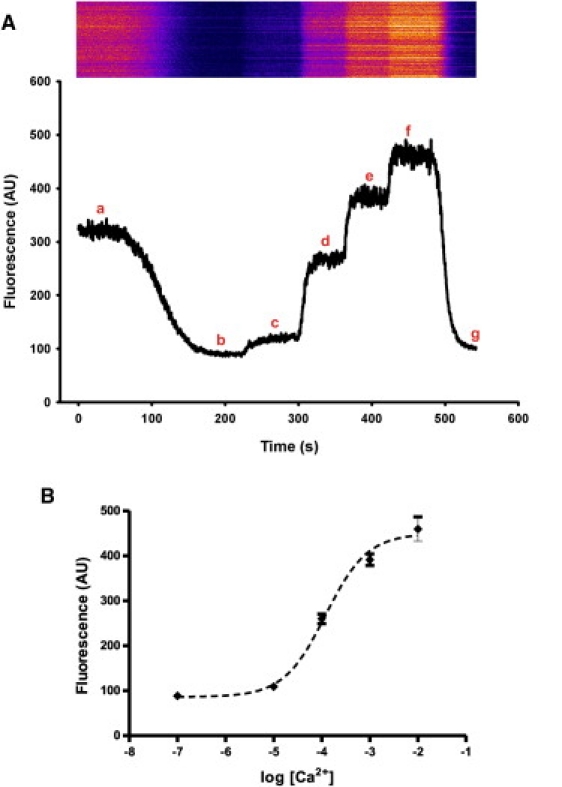
Direct measurement of resting [Ca2+]SR using fluo-5N We calibrated the fluorescence signal generated by fluo-5N at different concentrations of free Ca2+ (n = 6), as described in Materials and Methods. (A) Linescans were initiated after fluo-5N-loaded FDB fibers were permeabilized with saponin. (a) Once the sarcolemma was permeabilized, we first recorded resting [Ca2+]SR. (b) We then added 1 μM ionomycin in the presence of 100 nM free [Ca2+] to make the SR membrane permeant to divalent cations without loss of fluo-5N. Once the fluorescence signal reached a plateau, free [Ca2+] was increased to (c) 10 μM, (d) 100 μM, (e) 1 mM, and (f) 10 mM, before returning to (g) 100 nM. Increasing [Ca2+]free caused increases in fluorescence, which were reversed when concentrations were returned to 100 nM. (B) Mean fluorescence values at each free [Ca2+] were fit to a standard curve with a KD of 133 ± 0.12 μM. We used this curve to calculate the resting [Ca2+]SR,free, 391 ± 64.2 μM).
Calibrating the fluo-5N response to 4-CmC
As stated above, treatment of FDB fibers with 1 mM 4-CmC caused a decrease in fluo-5N fluorescence of ∼60%. We applied the equations derived by Cannell et al. (15) for fluo-based dyes in vivo, together with the values for KD and resting free [Ca2+]SR calculated above (Fig. 5), to calibrate the fluo-5N response to 4-CmC (Fig. 6, A and B). We calculated that 4-CmC reduces the free [Ca2+]SR from just under 400 μM to 62.3 ± 4.3 μM (n = 16), or by 84%. To assess any contribution from fluorescence that was nonspecific or not attributable to Ca2+ bound to fluo-5N in the lumen of the SR, we directly calibrated the fluorescent signal that remained in the presence of 4-CmC (Fig. 6 C). We first loaded the SR of myofibers with fluo-5N and then incubated them in thapsigargin for 10 min (Fig. 6 C, Panel I), as above. Next we depleted the SR of Ca2+ with a 3-min exposure to 4-CmC (Fig. 6 C, Panel II). After SR Ca2+ depletion, the fibers were permeabilized with saponin (Fig. 6 C, Panel III) to remove any fluo-5N that may have been present in the cytosol. Permeabilization was followed by exposure to ionomycin in the presence of 100 nM free [Ca2+] to equilibrate the SR to a known concentration (Fig. 6 C, Panel IV), which allowed us to fit the 4-CmC induced fluorescence level to the calibration curve (Fig. 5 C). We observed a decrease in overall fluorescence after treatment with saponin, suggesting that some fluo-5N was present in the cytosol and removed after permeabilization. Taking this pool of cytoplasmic dye into consideration, we calculated that 4-CmC exposure reduced the free [Ca2+]SR to 7.7 ± 1.6 μM (n = 7), or by >98%. This demonstrates that, although there is some error in measuring the depleted state of the SR store in intact fibers due to cytosolic fluorescence, the release of luminal Ca2+ by 4-CmC under carefully calibrated conditions is nearly complete, leading to very low Ca2+ concentrations, at least when SERCA is blocked.
Figure 6.
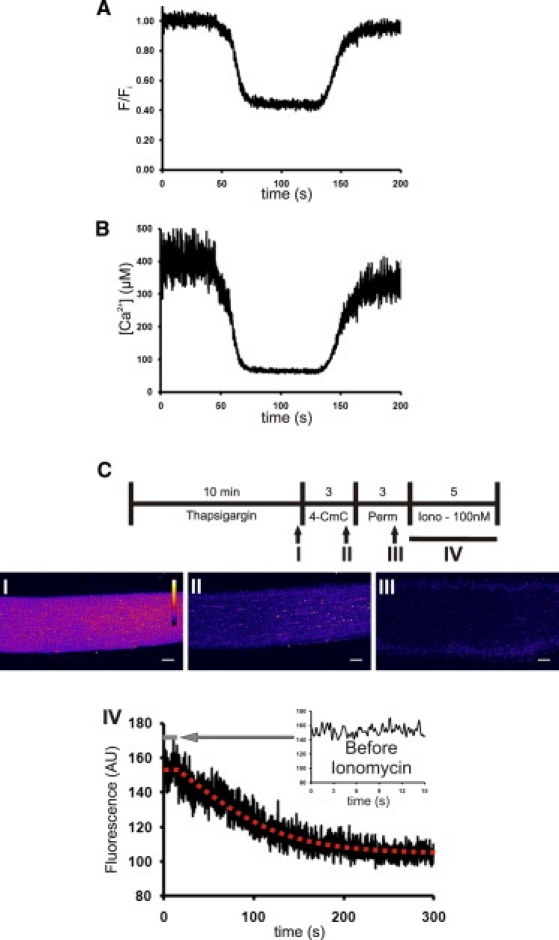
Determination of [Ca2+]SR,,free in the presence of 4-CmC. (A) Fibers loaded with fluo-5N were treated with 1 mM 4-CmC to induce a ∼60% decrease in fluorescence. (B) Calibration of the fluorescence at steady state, using values from Fig. 5, showed that [Ca2+]SR,free decreased from ∼390 μM to ∼60 μM. (C) To correct for the contribution of cytosolic or nonspecific fluorescence, we modified this protocol by blocking reuptake of Ca2+ with thapsigargin before emptying Ca2+ stores with 4-CmC, then permeabilized the fibers with saponin to release cytosolic dye. We then used ionomycin in the presence of 100 nM free [Ca2+] to equilibrate the [Ca2+]SR at a known concentration, allowing us to fit the value reached in the presence of saponin to our standard curve (Fig. 5B). This yielded a value for [Ca2+]SR,free in the emptied SR lumen of 7.7 ± 1.6 μM (n = 7). Representative images of a fiber were taken just before 4-CmC application (I), immediately after 4-CmC application (II), and immediately after saponin permeabilization (III), to show the reduction in fluorescence that occurs during the permeabilization step. We used linescan imaging to monitor the change in fluorescence that occurred as the SR equilibrated during ionomycin treatment in the presence of 100 nM [Ca2+] (IV). Ionomycin treatment began ∼15 s after the linescan image began, showing steady-state fluorescence within the SR (IV , inset).
Discussion
We have measured the store of Ca2+ in the SR of murine FDB muscle directly and quantitatively, and provide the first, to our knowledge, robust estimates of Ca2+ concentration and Ca2+ movements in response to physiological and pharmacological stimuli. We achieved this without expressing exogenous proteins, which have so far been targeted to both ER and SR compartments and which may therefore have complex responses to changes in [Ca2+]SR (e.g., (10,11)). Our method, which uses fluo-5N loaded into the SR of single cells, coupled with confocal imaging to detect and calibrate the fluorescence signals, provides measurements of resting free [Ca2+]SR that, at 390 μM, are surprisingly low. We show further that steady-state field stimulation at 1 Hz decreases that level by ∼20%, whereas near-tetanic rates of stimulation release a very large fraction (∼90%) of luminal [Ca2+], close to that released maximally by the RyR1 agonist, 4-CmC, which leaves only ∼8 μM Ca2+ free in the SR (see Table 1). Our results further suggest that the luminal stores of Ca2+ are freely diffusible over large regions of the SR in skeletal myofibers.
SR distribution of fluo-5N
Our loading protocols lead to a significant accumulation of fluo-5N within the lumen of SR, allowing robust measures of intra-SR Ca2+. Several pieces of evidence are consistent with the idea that fluo-5N accumulates in the lumen of the SR and not in other organelles (e.g., the mitochondria). First, high resolution imaging of FDB fibers loaded with fluo-5N yields a distinct and regular distribution of the dye that largely coincides with intracellular compartments labeled by di-8-ANEPPS, which mark the t-tubules (Fig. 1). The terminal cisternae or junctional SR compartment is in close proximity to t-tubules and are the primary sites of Ca2+ release in skeletal muscle. Fluo-5N fluorescence is also modified by drugs, such as 4-CmC and thapsigargin, which promote or inhibit, respectively, the ability of the SR to release and take up Ca2+. Finally, electrical stimulation at low rates also reduce fluo-5N fluorescence, and faster rates of stimulation reduce it to a greater extent, consistent with the greater release of Ca2+ from SR stores as physiological activation of muscle increases. All of these observations are consistent with the idea that most of the fluorescence of fluo-5N is due to its accumulation in the lumen of the jSR, but close inspection of the dye's distribution shows that it is also present in structures present between the jSR, presumably the nSR.
Our studies using fluorescence recovery after photobleaching (FRAP) suggest that the luminal volumes of the jSR and nSR, labeled by fluo-5N, are extensively interconnected, a finding fully consistent with classic electron microscopy (22). After photobleaching of a ∼15 × 15-μm region of a fiber, fluo-5N fluorescence rapidly and completely recovered to a level consistent with redistribution of the unbleached fluo-5N. Thus, the luminal compartments of the SR present in this region refill, presumably due to the diffusion of fluo-5N from the surrounding SR at an approximated rate of 1.3 × 10⁻⁷ cm2/s. Previous experiments by Wu and Bers (5) demonstrated similar features for cardiac muscle cells, including a diffusion rate of ∼0.8 × 10⁻⁷ cm2/s for fluo-5N. By comparison, Edwards and Launikonis (23) found that fluo-5N, trapped in the sealed t-tubule system, had a faster diffusion constant of 2.2–3 × 10⁻⁷ cm2/s. Diffusion coefficients of this magnitude are consistent with unrestrained diffusion of small molecules in an aqueous environment. To our knowledge, our studies are the first to demonstrate the interconnectivity of the SR lumen in skeletal muscle.
Treatment of myofibers with 4-CmC to activate RyR1 caused a ∼60% reduction in fluo-5N fluorescence (Fig. 2). To assess the source of the remaining ∼40% of fluo-5N fluorescence, we first calibrated fluo-5N recordings of 4-CmC-induced SR depletion (Fig. 6), which suggested that the fluorescence after 4-CmC treatment was the equivalent of the signal generated by ∼60 μM Ca2+. By permeabilizing the fibers with saponin to release any dye remaining in the cytosol (Fig. 6 C, I–III), and using ionomycin to equilibrate the [Ca2+]SR (Fig. 6 C, IV), we found that the free [Ca2+]SR after 4-CmC treatment was much lower, at ∼8 μM. Thus, 1 mM 4-CmC depleted the SR Ca2+ store by ∼98%. This lower value for [Ca2+]SR after 4-CmC treatment must be considered an approximation, as it falls at the low end of the linear range of our calibration. The difference in fluorescence before and after saponin permeabilization presumably represents the nonspecific fluorescence of fluo-5N in the cytosol and organelles other than the SR, with the possible exception of mitochondria (but see below). Although the values for maximally depleted [Ca2+]SR, estimated with and without exposure to saponin and ionomycin, differ by nearly 10-fold, our results suggest that, even without the correction, the vast majority of luminal Ca2+ is released from the SR by 4-CmC. It seems likely that the values for free [Ca2+]SR during high frequency stimulation (Table 1), with fractional [Ca2+]SR release approaching 1, are also overestimated.
As mentioned in Results, mitochondria in fast twitch skeletal myofibers, such as those of the FDB, are unlikely to contribute significantly to the changes in fluo-5N fluorescence that we observe in the presence of 4-CmC or after electrical excitation, for several reasons. Most importantly, mitochondrial [Ca2+] tracks the [Ca2+] in the cytosol (24). Because we use BAPTA to buffer cytosolic [Ca2+], mitochondrial [Ca2+] should be close to the buffered cytosolic levels, or ∼100 nM. Thus, although the volume of mitochondria in fast twitch muscle fibers is ∼8.5%, compared to a volume of ∼5.5% for the SR (21), the limited ability of mitochondria in situ to concentrate Ca2+ will tend to minimize their contribution to the nonspecific fluorescence. We cannot rule out the possibility that mitochondria take up or sequester fluo-5N differently from the SR, or that the dye in the mitochondrial lumen responds to Ca2+ differently than it does in the SR. Either of these possibilities, if true, would complicate the interpretation of our results. Our calibration (Fig. 5) demonstrates, however, that the contribution of fluorescence from the mitochondria would be minimal even at the highest estimates of cytosolic [Ca2+] reached during an action potential (∼20 μM) (25), assuming that this concentration determined mitochondrial [Ca2+] (e.g., Rudolf et al. (24)).
The range over which fluo-5N can report on [Ca2+]SR is quite large. By selectively permeabilizing the SR membrane to divalent cations with ionomycin, we can measure the response of fluo-5N in situ to changes in free [Ca2+] (Fig. 5) over a dynamic range from 10−7 to 10−2 M. The values we measured over this broad range allow us to measure [Ca2+]SR,free at ∼390 μM, a value very similar to the 310 μM reported by Rudolf et al. (10) using D1ER.
Functional measurements of changes in SR luminal Ca2+
In addition to detecting large changes in [Ca2+]SR, fluo-5N fluorescence shows a graded response to different rates of electrical stimulation (Fig. 4), with clear changes detectable at stimulation rates as low as 1 Hz. By comparing the changes caused by electrical stimulation to those induced by 4-CmC, we were able to estimate the fractional release of [Ca2+]SR at each stimulation frequency (see Table 1). Our results indicate that stimulation at 1 Hz reduces [Ca2+]SR by ∼20%, in good agreement with previous quantifications of single twitch SR Ca2+ release. Assuming a total resting [Ca2+]SR of 1.2–2 mM (total Ca2+ per L fiber volume), published accounts have shown that a single twitch or action potential releases ∼230 μM Ca2+, as measured by the resulting force produced in mechanically skinned fibers, or ∼346 μM, as measured by Furaptra, yielding a ∼15–20% fractional release (25).
We found a considerable difference in the fractional release of Ca2+ from the SR between 1 Hz (∼20%) and 10 Hz (∼73%), whereas the difference between 10 Hz and 50 Hz (∼88%) was smaller but significant. Also using fluo-5N, Kabbara and Allen (6) reported a value for the fractional release of Ca2+ from the SR of ∼70% of maximum, when toad fibers were stimulated at 100 Hz. By contrast, Rudolf et al. (10) reported only a ∼25% change in fluorescence ratio in D1ER when mammalian myofibers were stimulated at 50 Hz, but as they did not report the change associated with full release, this lower value is difficult to interpret. The relative force produced by stimulating FDB fibers at 10 Hz and 50 Hz is ∼0.45 and 0.9, respectively (26). Our value for fractional release of Ca2+ at 50 Hz is similar to the 0.9 value for relative force. Our value for fractional Ca2+ release at 10 Hz is different, however. We believe that this is due to differences in the duration of the stimulation train (0.35 s for force-frequency experiments, compared to 10 s for release of SR Ca2+). In our experiments (A. Ziman, unpublished), we have found that the steady state for [Ca2+]SR during 10Hz stimulation occurs in ∼1 s.
We generated all our data on myofibers that were preloaded with BTS and BAPTA to prevent contraction. BAPTA also suppressed any change in fluorescent signal coming from fluo-5N in the cytosol through BAPTA's higher affinity for Ca2+. Several studies have demonstrated that the inactivation of RyR1 is regulated by cytosolic Ca2+ and that increases in the Ca2+ buffering of the cytosol by either fluorescent dyes or other chelators can alter the amount of Ca2+ released during a [Ca2+]i transient (27). Although BAPTA enhances the [Ca2+]i transients (e.g., Fig. S1), it is absolutely necessary for measuring maximal [Ca2+]SR release induced by 4-CmC, which we use to scale our fractional Ca2+ release measurements in each fiber. Thus, we, like many other investigators, cannot avoid the use of BAPTA in our experiments.
Given the potency of 4-CmC as an activator of RyR1, cytosolic BAPTA probably has little effect on the amount of [Ca2+]SR released by 4-CmC, but its ability to slow the inactivation of RyR1 by buffering Ca2+ may lead to larger releases of [Ca2+]SR triggered by a train of electrical stimuli. If this occurs under the experimental conditions we have used, our values for fractional release at any given stimulation rate may be overestimated. As noted above, however, our values are strikingly similar to those seen by others using different methods. We do acknowledge that BAPTA as a cytosolic Ca2+ buffer may have other effects that we cannot control, including mitigating the effectiveness of fluo-5N in measuring rapid kinetic changes in [Ca2+]SR. We further acknowledge that BAPTA may gain access to the lumen of the SR, which could affect our quantitation. We consider this unlikely, as the range of [Ca2+]SR that we have measured is largely outside the range over which BAPTA can buffer [Ca2+], except in the largest [Ca2+]SR release events.
Conclusions
We have used fluo-5N, sequestered preferentially in the lumen of the SR, to study [Ca2+]SR in mammalian skeletal myofibers. Fluo-5N loaded to the SR lumen serves both to label the primary store of intracellular Ca2+ and to report on dynamic changes of [Ca2+]SR during physiological and pharmacological stimuli. The fractional release of [Ca2+]SR in response to electrical stimulation that we measured with fluo-5N, when normalized to maximum [Ca2+]SR release in each fiber, is consistent with estimates made by force measurements (26,28). The ability to make direct fluorescent measurements of [Ca2+]SR should facilitate studies of Ca2+ sequestration and release by the SR of healthy, injured, and diseased muscle, as well as the role of specific proteins in maintaining the structure and function of the SR. The ability to monitor changes in [Ca2+]SR directly with fluo-5N should also enable testing of critical hypotheses regarding the roles of store-operated-Ca2+-entry and excitation-contraction-coupling-entry (29) and the pathogenic changes in Ca2+ homeostasis that are associated with skeletal myopathies or muscular dystrophies.
Acknowledgments
We acknowledge the development of Virtual Cell and Virtual FRAP by the National Resource for Cell Analysis and Modeling at the University of Connecticut Health Center supported by National Institutes of Health grant No. P41 RR013186. This work was supported by grants from the National Institutes of Health (No. F32 AR057647 for A.P.Z., No. K01 AR051519 for G.G.R., No. RC2 NR011968 for C.W.W., No. P01 HL67849, Project 3, and No. HL081106 for W.J.L., and No. RO1 AR 056330 for R.J.B.) and the Muscular Dystrophy Association (Basic Research Grant No. 3771 for R.J.B.).
Supporting Material
References
- 1.Schneider M.F., Chandler W.K. Voltage dependent charge movement of skeletal muscle: a possible step in excitation-contraction coupling. Nature. 1973;242:244–246. doi: 10.1038/242244a0. [DOI] [PubMed] [Google Scholar]
- 2.Protasi F. Structural interaction between RYRs and DHPRs in calcium release units of cardiac and skeletal muscle cells. Front. Biosci. 2002;7:d650–d658. doi: 10.2741/A801. [DOI] [PubMed] [Google Scholar]
- 3.MacLennan D.H., Wong P.T. Isolation of a calcium-sequestering protein from sarcoplasmic reticulum. Proc. Natl. Acad. Sci. USA. 1971;68:1231–1235. doi: 10.1073/pnas.68.6.1231. [DOI] [PMC free article] [PubMed] [Google Scholar]
- 4.MacLennan D.H. Ca2+ signaling and muscle disease. Eur. J. Biochem. 2000;267:5291–5297. doi: 10.1046/j.1432-1327.2000.01566.x. [DOI] [PubMed] [Google Scholar]
- 5.Wu X., Bers D.M. Sarcoplasmic reticulum and nuclear envelope are one highly interconnected Ca2+ store throughout cardiac myocyte. Circ. Res. 2006;99:283–291. doi: 10.1161/01.RES.0000233386.02708.72. [DOI] [PubMed] [Google Scholar]
- 6.Kabbara A.A., Allen D.G. The use of the indicator fluo-5N to measure sarcoplasmic reticulum calcium in single muscle fibers of the cane toad. J. Physiol. 2001;534:87–97. doi: 10.1111/j.1469-7793.2001.00087.x. [DOI] [PMC free article] [PubMed] [Google Scholar]
- 7.Launikonis B.S., Zhou J., Rios E. Confocal imaging of [Ca2+] in cellular organelles by SEER, shifted excitation and emission ratioing of fluorescence. J. Physiol. 2005;567:523–543. doi: 10.1113/jphysiol.2005.087973. [DOI] [PMC free article] [PubMed] [Google Scholar]
- 8.Launikonis B.S., Zhou J., Rios E. Depletion “skraps” and dynamic buffering inside the cellular calcium store. Proc. Natl. Acad. Sci. USA. 2006;103:2982–2987. doi: 10.1073/pnas.0511252103. [DOI] [PMC free article] [PubMed] [Google Scholar]
- 9.Palmer A.E., Jin C., Tsien R.Y. Bcl-2-mediated alterations in endoplasmic reticulum Ca2+ analyzed with an improved genetically encoded fluorescent sensor. Proc. Natl. Acad. Sci. USA. 2004;101:17404–17409. doi: 10.1073/pnas.0408030101. [DOI] [PMC free article] [PubMed] [Google Scholar]
- 10.Rudolf R., Magalhaes P.J., Pozzan T. Direct in vivo monitoring of sarcoplasmic reticulum Ca2+ and cytosolic cAMP dynamics in mouse skeletal muscle. J. Cell Biol. 2006;173:187–193. doi: 10.1083/jcb.200601160. [DOI] [PMC free article] [PubMed] [Google Scholar]
- 11.Jimenez-Moreno R., Wang Z.M., Delbono O. Sarcoplasmic reticulum Ca2+ depletion in adult skeletal muscle fibers measured with the biosensor D1ER. Pflugers Arch. 2010;459:725–735. doi: 10.1007/s00424-009-0778-4. [DOI] [PMC free article] [PubMed] [Google Scholar]
- 12.Kaisto T., Metsikko K. Distribution of the endoplasmic reticulum and its relationship with the sarcoplasmic reticulum in skeletal myofibers. Exp. Cell Res. 2003;289:47–57. doi: 10.1016/s0014-4827(03)00231-3. [DOI] [PubMed] [Google Scholar]
- 13.Liu Y., Carroll S.L., Schneider M.F. Calcium transients and calcium homeostasis in adult mouse fast-twitch skeletal muscle fibers in culture. Am. J. Physiol. 1997;272:C1919–C1927. doi: 10.1152/ajpcell.1997.272.6.C1919. [DOI] [PubMed] [Google Scholar]
- 14.DiFranco M., Capote J., Vergara J.L. Optical imaging and functional characterization of the transverse tubular system of mammalian muscle fibers using the potentiometric indicator di-8-ANEPPS. J. Membr. Biol. 2005;208:141–153. doi: 10.1007/s00232-005-0825-9. [DOI] [PubMed] [Google Scholar]
- 15.Cannell M.B., Cheng H., Lederer W.J. Spatial non-uniformities in [Ca2+]i during excitation-contraction coupling in cardiac myocytes. Biophys. J. 1994;67:1942–1956. doi: 10.1016/S0006-3495(94)80677-0. [DOI] [PMC free article] [PubMed] [Google Scholar]
- 16.Schaff J., Fink C.C., Loew L.M. A general computational framework for modeling cellular structure and function. Biophys. J. 1997;73:1135–1146. doi: 10.1016/S0006-3495(97)78146-3. [DOI] [PMC free article] [PubMed] [Google Scholar]
- 17.Schaff J.C., Cowan A.E., Moraru I.I. VIRTUAL FRAP—an experiment-oriented simulation tool. Biophys. J. 2009;96:30a. [Google Scholar]
- 18.Yuan S., Arnold W., Jorgensen A.O. Biogenesis of transverse tubules: immunocytochemical localization of a transverse tubular protein (TS28) and a sarcolemmal protein (SL50) in rabbit skeletal muscle developing in situ. J. Cell Biol. 1990;110:1187–1198. doi: 10.1083/jcb.110.4.1187. [DOI] [PMC free article] [PubMed] [Google Scholar]
- 19.Zorzato F., Scutari E., Treves S. Chlorocresol: an activator of ryanodine receptor-mediated Ca2+ release. Mol. Pharmacol. 1993;44:1192–1201. [PubMed] [Google Scholar]
- 20.Lytton J., Westlin M., Hanley M.R. Thapsigargin inhibits the sarcoplasmic or endoplasmic reticulum Ca-ATPase family of calcium pumps. J. Biol. Chem. 1991;266:17067–17071. [PubMed] [Google Scholar]
- 21.Eisenberg B.R. Quantitative ultrastructure of mammalian skeletal muscle. In: Peachey L., editor. Skeletal Muscle. Vol. 10. American Physiological Society; Bethesda, MD: 1983. pp. 73–112. [Google Scholar]
- 22.Fawcett D.W. The sarcoplasmic reticulum of skeletal and cardiac muscle. Circulation. 1961;24:336–348. doi: 10.1161/01.cir.24.2.336. [DOI] [PubMed] [Google Scholar]
- 23.Edwards J.N., Launikonis B.S. The accessibility and interconnectivity of the tubular system network in toad skeletal muscle. J. Physiol. 2008;586:5077–5089. doi: 10.1113/jphysiol.2008.155127. [DOI] [PMC free article] [PubMed] [Google Scholar]
- 24.Rudolf R., Mongillo M., Pozzan T. In vivo monitoring of Ca2+ uptake into mitochondria of mouse skeletal muscle during contraction. J. Cell Biol. 2004;166:527–536. doi: 10.1083/jcb.200403102. [DOI] [PMC free article] [PubMed] [Google Scholar]
- 25.Baylor S.M., Hollingworth S. Sarcoplasmic reticulum calcium release compared in slow-twitch and fast-twitch fibers of mouse muscle. J. Physiol. 2003;551:125–138. doi: 10.1113/jphysiol.2003.041608. [DOI] [PMC free article] [PubMed] [Google Scholar]
- 26.Gonzalez E., Messi M.L., Delbono O. Insulin-like growth factor-1 prevents age-related decrease in specific force and intracellular Ca2+ in single intact muscle fibers from transgenic mice. J. Physiol. 2003;552:833–844. doi: 10.1113/jphysiol.2003.048165. [DOI] [PMC free article] [PubMed] [Google Scholar]
- 27.Pape P.C., Jong D.S., Baylor S.M. Effect of Fura-2 on action potential-stimulated calcium release in cut twitch fibers from frog muscle. J. Gen. Physiol. 1993;102:295–332. doi: 10.1085/jgp.102.2.295. [DOI] [PMC free article] [PubMed] [Google Scholar]
- 28.Posterino G.S., Lamb G.D. Effect of sarcoplasmic reticulum Ca2+ content on action potential-induced Ca2+ release in rat skeletal muscle fibers. J. Physiol. 2003;551:219–237. doi: 10.1113/jphysiol.2003.040022. [DOI] [PMC free article] [PubMed] [Google Scholar]
- 29.Dirksen R.T. Checking your SOCCs and feet: the molecular mechanisms of Ca2+ entry in skeletal muscle. J. Physiol. 2009;587:3139–3147. doi: 10.1113/jphysiol.2009.172148. [DOI] [PMC free article] [PubMed] [Google Scholar]
Associated Data
This section collects any data citations, data availability statements, or supplementary materials included in this article.