

Abstract
Parkinson’s disease (PD) is classically defined as a motor disorder resulting from decreased dopamine production in the basal ganglia circuit. In an attempt to better diagnose and treat PD before the onset of severe motor dysfunction, recent attention has focused on the early, non-motor symptoms, which include but are not limited to sleep disorders such as excessive daytime sleepiness (EDS) and REM behavioral disorder (RBD). However, few animal models have been able to replicate both the motor and non-motor symptoms of PD. Here, we present a progressive rat model of parkinsonism that displays disturbances in sleep/wake patterns. Epidemiological studies elucidated a link between the Guamanian variant of Amyotrophic Lateral Sclerosis/Parkinsonism Dementia Complex (ALS/PDC) and the consumption of flour made from the washed seeds of the plant Cycas micronesica (cycad). Our study examined the effects of prolonged cycad consumption on sleep/wake activity in male, Sprague–Dawley rats. Cycad-fed rats exhibited an increase in length and/or number of bouts of rapid eye movement (REM) sleep and Non-REM (NREM) sleep at the expense of wakefulness during the active period when compared to control rats. This hypersomnolent behavior suggests an inability to maintain arousal. In addition, cycad-fed rats had significantly fewer orexin cells in the hypothalamus. Our results reveal a novel rodent model of parkinsonism that includes an EDS-like syndrome that may be associated with a dysregulation of orexin neurons. Further characterization of this early, non-motor symptom, may provide potential therapeutic interventions in the treatment of PD.
Keywords: Orexin, Parkinson’s disease, Excessive daytime sleepiness, Cycad
Introduction
Parkinson’s disease (PD) is typically viewed as a neurodegenerative disease that manifests severe motor impairment with symptoms such as resting tremor, muscle rigidity, and bradykinesia. These symptoms often do not appear until there is a 60–80% loss of dopamine (DA) in the basal ganglia circuit (Fearnley and Lees, 1991). Since the early 1960s, replacement of DA via 3,4-Dihydroxyphenylalanine (L-DOPA) has been the main treatment for patients with PD (Carlsson et al., 1957). A chief complaint associated with this treatment has been severe sleep disturbances that include fragmented sleep and daytime sleep attacks. The high prevalence (≥80%) of sleep disturbances in PD patients is often reported to be more troubling than the symptoms associated with motor dysfunction (Friedman and Millman, 2008).
Recent studies have shown that sleep alterations may actually precede motor impairment by at least a decade and cannot be completely accounted for by anti-parkinsonism treatments for altered DA neurotransmission (Rye, 2006; Arnulf et al., 2002). In fact, a strong correlation exists between the diagnoses of sleep disruptions, such as excessive daytime sleepiness (EDS) and REM behavioral disorder (RBD), and an increased risk of developing PD within the next decade (Dhawan et al., 2006; Abbott et al., 2005). We present evidence for a novel neurotoxin-induced rat model of parkinsonism that assesses some of the cellular disruptions mediating the non-motor symptoms.
Our previous research examined the effects of prolonged consumption of flour made from seeds of the plant Cycas micronesica (cycad) in male Sprague–Dawley rats. There is a causal relationship between the Guamanian variant of Amyotrophic Lateral Sclerosis/Parkinsonism Dementia Complex (ALS/PDC) and consumption of flour made from washed cycad seeds. Importantly, washing of the seeds removes acute toxins such as β-N-methylamino-L-alanine which has been shown to induce motor neuron loss in culture (Rao et al., 2006). We found that cycad-fed rats display a progressive parkinsonian phenotype with no signs of ALS (Shen et al., 2010). Here, we report an in-depth analysis of the sleep architecture in cycad-fed and control rats. Cycad-fed rats displayed a hypersomnolent behavior, prior to some of the more severe parkinsonian characteristics observed in our cycad model. Specifically, we found that cycad-fed rats experienced a change in the number of vigilance state episodes and their duration that led to more rapid eye movement (REM) and Non-REM sleep at the expense of wakefulness in their active phase when compared to control rats. In addition, we found a significant reduction in orexin neurons of cycad-fed rats. Thus, these results provide further evidence for a relationship between altered orexin neurotransmission and the development of the initial, non-motor symptom of EDS. Moreover, our animal model offers a much-needed tool for further understanding of the etiology of the neurodegeneration underlying the non-motor symptoms observed in PD.
Materials and methods
Animals
All animals were treated in accordance with the guidelines of the University of Maryland - Institutional Animal Care and Use Committee. Sprague–Dawley male rats, 15 weeks old (Taconic Laboratories, USA), were housed individually under a reversed 12:12 h light:dark cycle (lights off at 07:00 h, on at 19:00 h). Food and water were provided ad libitum.
Experimental paradigm of Parkinsonism
Flour made from the seeds of the plant Cycas micronesica was fed in pellet form to induce a Parkinsonian-like behavior in rats (Shen et al., 2010, in press). Briefly, pellet batches were prepared every other week for control and experimental rats, using unbleached wheat flour or washed cycad flour, respectively. Flour, sterile distilled water and flavoring (vanilla extract) were mixed into a dough-like consistency and then formed into a pellet shape and dried at 56 °C. Once dried, flour and cycad pellets were stored separately in sealed plastic containers at 4 °C. Cycad rats (n=8) were fed 1.25 g of cycad pellets and control rats (n=8) were fed 1.25 g of wheat flour pellets for five days a week between 8 AM and 11 AM for a total of 22 weeks.
Implantation of radiotelemetry transmitter and EEG/EMG electrodes
After cessation of pellet feeding (22 weeks), animals underwent surgery for implantation of a radiotelemetry transmitter with electroencephalography/electromyography (EEG/EMG) electrodes. Animals were anesthetized with a ketamine:acepromazine solution (80 mg/kg:2.5 mg/kg) and placed in a stereotaxic frame to secure the head. A TL11M2-F40-EET transmitter (Data Sciences International, St. Paul, MN) was implanted subcutaneously through a 3 cm incision on the left dorsal side of the abdominal region. Another 3–4 cm incision was made along the midline of the head and neck through which all four leads were passed. The two leads for measuring the EEGs were implanted epidurally. Two burr holes (approximately 0.5 mm diameter) were made with a handheld drill and two dental screws (Plastics One, Roanoke, VA) were implanted into the skull, one on each of the parietal bones (2 mm anterior to lambda and 2 mm bilateral of the midline suture). Each of the two EEG leads were attached to a screw and secured with dental cement. The two EMG leads were placed about 5 mm apart in direct contact with the dorsal cervical neck muscle and sutured into place. The cranial incision was sutured and the dorsal side was stapled. Animals were individually housed and allowed 7 days to recover.
EEG/EMG acquisition
All recordings took place in a designated room shielded from noise or other background disturbances. EEG and EMG waveform data were acquired using the Dataquest ART 4.0 software (DSI, MN) set to a continuous sampling mode. Animals were housed individually in standard plexiglass home cages and at the start of the recording the homecages were placed on receiver plates (RPC1, DSI, MN) that sent the data via an exchange matrix (DSI, MN) to a computer installed with the Dataquest A.R.T. Gold Analog software. The data were collected at a sampling rate of 250 Hz. The analog signal was converted to a digital signal and stored for future analysis.
Sleep scoring and data analysis
As rats are nocturnal and accumulate the majority of their activity and wakefulness in the dark phase and the majority of their sleep in the light phase, these phases will be referred to as the Active and Quiescent phases, respectively. One 24-h block (12 h dark, 12 h light) of EEG/EMG waveforms from all animals (n =8 flour-fed rats; n =8 cycad-fed rats) were scored manually using Neuroscore software (DSI, MN) into 10-second epochs of Wake (low-amplitude, high-frequency EEG combined with high amplitude EMG), NREM (high-amplitude, low-frequency EEG combined with low-EMG tone), or REM (low-amplitude, high-frequency EEG combined with muscle atonia and occasional muscle twitches). All 10 sec-epochs for each stage of sleep was summed for both the 12 h Quiescent and Active phase and reported as the total number of minutes spent in each vigilant state. Additionally, the total sleep time (TST) was determined by summing the time spent in NREM and REM sleep across the Active and Quiescent phases. Data for TST was distrusted over 2-h bins as well as for each 12-h Quiescent and Active phase and reported as a percentage of total recording time. To further explore changes in sleep–wake architecture, the number of bouts for each vigilance state (number of episodes), and the mean duration of an episode in each vigilance state (mean duration) were determined for the Quiescent and Active phases. Data for the Quiescent and Active phase totals were analyzed using an unpaired, two-tailed Student’s t-test to determine if there was a significant, main effect of treatment. Alpha level was set at 0.05. Data averaged over 2-h intervals were analyzed using a two-way, repeated measures ANOVA with independent variables being the treatment and time of day. Statistical tests were conducted using GraphPad Prism 4 (San Diego, CA, USA) on a Macintosh computer.
Tissue Processing
Immediately after EEG/EMG recording and approximately 8.5 h into the Active phase the brains were harvested. The rats were deeply anesthetized with an i.p. cocktail of ketamine:acepromazine and then perfused intracardially with saline (0.9% NaCl) containing 2% sodium nitrite followed by a solution containing 4% paraformaldehyde (Polysciences, Warrington, PA) and 2.5% acrolein (Sigma Aldrich, St. Louis, MO). The brains were removed and postfixed for 24 h in the paraformaldehyde:acrolein solution followed by cryoprotection in a 30% sucrose in potassium phosphate buffered saline (KPBS) solution. After cryoprotection, brains were frozen in dry ice and subsequently stored at −80 °C until processed for immunocytochemistry.
Immunocytochemistry
Brains were serially sectioned (30 μm) in the coronal plane with a cryostat and stored in a cryoprotectant solution (ethylene glycol/glucose in phosphate buffer) at −20 °C until processed. The following protocol was used to separately stain for antibodies against orexin-A (ORX-A) and melanin concentrating hormone (MCH). Free-floating sections were rinsed in KPBS to remove cryoprotectant. Sections were then incubated for 20 min in 1% sodium borohydride (to neutralize the acrolein fixative), then after rinsing, for 15 min in 1% H2O2 (to block endogenous peroxidases). Once the tissue was rinsed again, sections were incubated in 0.4% TritonX-100, 10% normal goat serum, and diluted primary antibody at room temperature for 1 h then at 4 °C for 48 h. Next, sections were incubated for 1 h in biotinylated goat anti-rabbit IgG secondary antibody (1:1000; Vector Laboratories, Burlingame, CA), and 1 h in A/B ELITE solution (1:1000; Vectastain ABC Kit). The tissue was stained with a nickel (II) sulfate DAB chromogen solution (Polysciences) in 0.175 M sodium acetate. For additional, double-labeled immunocytochemistry, staining for c-fos immunoreactivity was completed with the nickel enhanced chromogen solution (black nuclei), followed by a non-nickel enhanced solution in TRIS buffer, pH 7.2 for the development of orexin immunoreactivity (brown cell bodies). Primary antibodies included rabbit anti-orexin-A primary IgG antibody (1:5000; Phoenix Pharmaceuticals, Belmont, CA); rabbit anti-melanin concentrating hormone primary IgG antibody (1:10,000; Phoenix Pharmaceuticals); and rabbit anti-c-fos primary IgG antibody (1:15,000; Santa Cruz, CA).
Quantification of orexin-A, c-fos, and melanin concentrating hormone
A single examiner blinded to treatment conditions performed systematic cell counts using a Nikon Eclipse E600 microscope and Neurolucida software (MicroBrightField Inc., Williston, VT) that allows quantification of cell numbers in three-dimensional space. A total of three anatomically matched sections of the hypothalamus were used for analysis. Sections analyzed were from a one-in-three series (adjacent sections were separated by 90 μm) roughly between the Bregma coordinates −2.8 mm and −3.3 mm, based on the Paxinos & Watson rat brain atlas (1998). For cell counts involving ORX-A-immunoreactivity (ORX-A-ir), the lateral hypothalamus was defined by a 2000 μm×900 μm box with vertical alignment at the outer edge of the third ventricle and horizontal alignment at the most ventral portion of the fornix (refer to Fig. 4A) for both hemispheres of the brain. For the MCH-ir cell counting, the defined box was extended dorsally by 200 μm, giving a total area of 2000 μm×1100 μm. Three brain sections were used in the analysis, thus six sectors per bilateral nucleus were counted and an average per section for each antibody was derived. Similarly, for double-labeled staining of ORX-A/c-fos-ir neurons, the cells contained in the mapped boundary were counted as either ORX-A-ir neurons or double-labeled. A percentage of doubled labeled from the total ORX-A-ir was derived. Unpaired, two-tailed Student’s t-tests were performed on the mean number of cells per section for ORX-A-ir, MCH-ir and the percent of doubled labeled cells. Alpha level was set at 0.05. Statistical tests were conducted using GraphPad Prism 4 (San Diego, CA, USA) on a Macintosh computer.
Fig. 4.
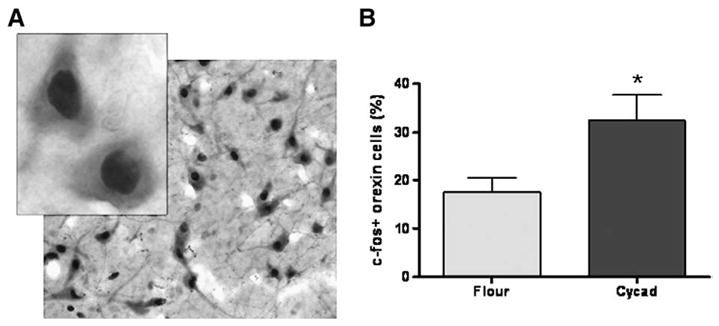
Loss of Orexin-A neurons causes a change in activation of remaining cells. (A) An example of co-labeled c-fos and ORX-A positive cells at low (4×) and high (100×) magnification. (B) Using c-fos as a nuclear marker of cell activation, analysis of ORX-A neurons revealed a significant increase in the percentage of activated ORX-A-ir cells in the lateral hypothalamus of cycad-fed rats when compared to flour-fed rats (*p=0.0273; t(14) =2.46). Values are the means±SEM of 8 animals in each group.
Results
Consumption of cycad flour induces alterations in sleep/wake activity
To test whether sleep–wake patterns were affected by cycad feeding, EEG and EMG waveforms acquired from freely moving animals were used to quantify the time spent in Wake, NREM and REM. Analysis of a 24-h period consisting of 12 h of light (Quiescent phase) and 12 h of dark (Active phase) revealed significant alterations in the sleep/wake activity of cycad-fed rats when compared to flour-fed rats. During the Active phase, cycad-fed rats showed a significant decrease in the time spent in wakefulness (−8.5%; p=0.0056; t(14) =3.272; Fig. 1A), an increase in NREM sleep (24.9%; p=0.0152; t(14) =2.763; Fig. 1B) and an increase in REM sleep (38.9%; p=0.0047; t(14) =3.353; Fig. 1C). There was no difference between the vigilant states of flour-fed rats and cycad-fed rats during the Quiescent phase (Fig. 1A and C).
Fig. 1.

Consumption of cycad induces a hypersomnolent behavior. During the 12-h active phase, cycad exposure decreased the total minutes spent in wake (A, *p =0.0056; t(14) =3.272), increased the amount of time spent in NREM sleep (B, *p =0.0152; t(14) =2.763) and REM sleep (C, *p =0.0047; t(14) =3.353) compared to flour-fed rats. No significant changes were observed between flour-fed and cycad-fed rats in Wakefulness (p =0.93), NREM sleep (p =0.65), or REM sleep (p =0.29) during the 12-h quiescent phase. Values are the means±SEM of 8 animals in each group.
To further characterize the potential hypersomnolent behavior induced by cycad consumption, the total sleep time (TST) was analyzed. The cycad-fed rats displayed a significant increase in TST during the Active phase (p=0.0053; t(14) =3.299; Fig. 2A). While there was no significant change in TST during the Quiescent phase, there was an increase over the 24-h block which did not quite reach statistical significance (p=0.061; t(14) =2.030; Fig. 2A). When the continuous 24-h recordings were distributed over 2-h bins there was a significant main effect of cycad exposure on TST over the Active phase (F(1,14) =11.1, p =0.005), but not over the Quiescent phase (p=0.99). In addition, a Bonferroni comparison revealed that cycad-fed rats accumulated significantly more total sleep at ZT8 and ZT12 compared to the controls (Fig. 2B; p<0.05).
Fig. 2.
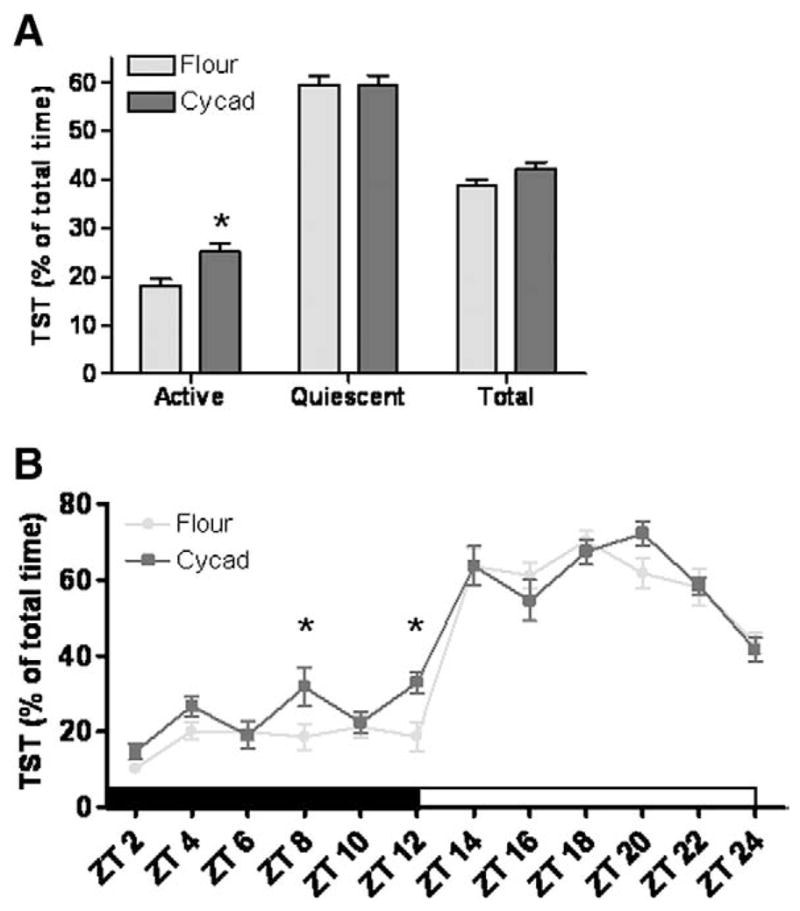
Total Sleep Time is increased in cycad-fed rats. (A) Cycad-fed rats showed a significant increase in the percentage of TST over the active phase (*; p =0.0053; t(14) =3.299). TST over the 24-h period also increased but did not reach statistical significance (p =0.061; t(14) =2.030). (B) Distribution of the percentage of TST into 2-h bins revealed a main effect of cycad on TST over the Active phase (F(1,14) =11.1, p =0.005), but not in the Quiescent phase (p =0.99). Post-hoc analysis revealed that cycad-treated rats accumulated significantly more total sleep at ZT8 and ZT12 compared to the controls (p < 0.05). Values are the means±SEM of 8 animals in each group.
Finally, analysis of sleep–wake architecture (number of episodes and mean episode duration) suggested a hypersomnolent phenotype in cycad-fed rats without sleep fragmentation in the Quiescent phase (Table 1). In the Active phase, cycad-fed rats experienced 35% more wake episodes that were 50% shorter in mean duration than controls (t(14) =2.15, p < 0.05 and t(14) =2.14, p < 0.05, respectively). Coincident with the decrease in Active phase wakefulness was a significant increase in the number of REM episodes (35%, t(14) =2.88, p < 0.05) and the mean episode duration of NREM sleep (28%, t(14) =2.20, p < 0.05).
Table 1.
Number and duration of episodes for each vigilance state during the Active and Quiescent phase in cycad and flour-fed rats.
| Number of episodes |
Duration of episodes (seconds) |
||||
|---|---|---|---|---|---|
| Flour | Cycad | Flour | Cycad | ||
| Wake | Quiescent | 107±9 | 118±13 | 108.6±11.1 | 107.9±18.3 |
| Wake | Active | 71±11 | 108±13* | 621.6±133.0 | 312.9±55.5* |
| NREM | Quiescent | 198±11 | 219±15 | 104.0±8.4 | 89.6±5.6 |
| NREM | Active | 129±12 | 130±12 | 53.0±3.7 | 69.7±6.6* |
| REM | Quiescent | 70±6 | 78±5 | 91.9±6.0 | 85.9±3.6 |
| REM | Active | 22±3 | 34±3* | 61.6±3.6 | 64.7±3.1 |
Values are the means±SEM of 8 animals in each group
p< 0.05.
Consumption of cycad flour induces alterations in orexin-A neurons
Previous reports implicate orexin-A in the maintenance of wakefulness and more recent findings describe orexin loss in PD patients (Fronczek et al., 2007; Thannickal et al., 2007). To determine whether a similar cellular pathology was present in cycad-fed rats, relative changes in the ORX-A and MCH cells of the lateral hypothalamus were quantified in brain tissue sections. The mean number ORX-A-ir neurons per section was significantly less in the cycad-fed rats when compared to flour-fed rats (Fig. 3A and B; p=0.0332; t(14) =2.362). Furthermore, there was no significant difference in the mean number of MCH-ir cells between treatment groups (Fig. 3C and D, p=0.25).
Fig. 3.

Consumption of cycad induces a loss of Orexin-A neurons. (A) Representative images of ORX-A-ir cells in flour-fed and cycad-fed rats (left=4× magnification; right=20× magnification). (B) Analysis of ORX-A cell counts revealed a significant decrease in the mean number of orexin-A positive cells in anatomically matched tissue section of cycad-fed rats compared to flour-fed rats (*; p =0.0332; t(14) =2.362). (C) Representative images of MCH-ir cells in flour-fed and cycad-fed rats (left=4× magnification; right=20× magnification). (D) Analysis revealed no significant differences in cell counts of cycad-fed rats when compared with controls (p =0.25). Values are the means±SEM of 8 animals in each group.
Since a significant loss of ORX-A neurons could alter the way the surviving cells function, the activation pattern of the remaining neurons was examined with double-label immunohistochemical analysis with antibodies against c-fos (a marker for neuronal activation) and ORX-A. The percentage of doubled labeled c-fos-ir/ORX-A-ir neurons to ORX-A-ir only neurons was significantly increased by approximately 86% in cycad-fed rats compared to the flour-fed controls (p=0.0273; t(14) =2.46; Fig. 4).
Discussion
Development of a rodent model for early, non-motor symptoms of parkinsonism
While there are numerous studies that analyze the motor deficits observed in rat models of parkinsonism, there is a scarcity of research looking into early progression of the disease in these same models. In one of the few progressive studies, rotenone, a pesticide linked to parkinsonism, was chronically administered to rats resulting in a hypersomnolent behavior (Yi et al., 2007). Another longitudinal study found injection of the parkinsonian toxin MPTP in rhesus monkeys induces sleep disturbances including EDS (Barraud et al., 2009). We now report that consumption of an environmental parkinsonian neurotoxin, cycad, induces an EDS-like disorder in rats. This cycad-induced phenotype does not resemble RBD as evidenced by a lack of significant change in muscle tone during REM sleep (data not shown). Instead, these animals display an increase in NREM and REM sleep during their active phase, whereas the sleep patterns of the quiescent phase remain the same as control levels.
Moreover, analysis of the sleep–wake architecture revealed that cycad-fed rats exhibited fragmented wakefulness (increased episode number accompanied by a decreased episode duration) during their Active phase when compared to the flour-fed controls that exhibited longer consolidated bouts of wake, further supporting an EDS-like syndrome. The sleep–wake architecture during the Quiescent phase was indistinguishable between the cycad- and flour-fed groups suggesting that the change in wakefulness during the Active phase was not a consequence of sleep fragmentation during the expected sleep phase.
The presence of these non-motor changes represents an early stage in the progression of parkinsonism resulting from approximately twenty weeks of cycad exposure. Furthermore, these animals did not show advanced symptoms (i.e., motor disturbances) of the disease. It is only at later time points (thirty-six weeks after cycad exposure) that cycad-fed rats display a significant loss of DA neurons in the SN and the presence of α-synuclein aggregation, a classical histological hallmark of PD (Shen et al., 2010). In other words, cycad consumption in rats induces a hypersomnia that precedes the development of parkinsonian symptoms. Since sleep disturbances, particularly EDS, are common in numerous chronic neurodegenerative diseases, such as Huntington’s disease, dementia with Lewy bodies, progressive supranuclear palsy, and corticobasal dementia, the cycad model of early onset symptoms may be useful in elucidating the underlying neuropathology of these diseases (El-Ad and Korczyn, 1998; Happe, 2003; Yasui et al., 2006).
Role of sleep disturbances and the hypothalamus in Parkinson’s disease
The high prevalence (≥ 80%) of sleep disturbances in patients with PD are often reported to be more troubling than the symptoms associated with motor dysfunction (Friedman and Millman, 2008). More specifically, the majority of PD patients suffer from daytime sleep attacks that can occur independent of treatment with dopaminergic drugs (Rye, 2006; Arnulf et al., 2002). Changes in sleeping habits, particularly hypersomnolence, were also an early symptom in the Chamorros of Guam that were affected by cycad-induced parkinsonism (Sacks, 1996). In further support of sleep alterations as an initial symptom of PD, researchers have found that early changes in the hypothalamus may precede more substantial changes in the basal ganglia motor circuit (Langston and Forno, 1978; Kremer and Bots, 1993). Two independent post-mortem studies, report a significant loss of ORX and MCH cells in the hypothalamus that correlated with the clinical stage of the PD patients (Thannickal et al., 2007; Fronczek et al., 2007). Since its discovery in 1998, multiple studies have determined a clear role of ORX as a regulator of sleep and wakefulness states (de Lecea et al., 1998; Saper et al., 2001; Baumann and Bassetti, 2005; Sakurai, 2005). In addition, it has been shown that knockdown of ORX in rats increases their time spent asleep during the dark (active) period (Chen et al., 2006; Gerashchenko et al., 2003). While there is an inverse correlation between a loss of orexin neurons and an increase in sleep, the role of orexin neurons in the development of PD remains controversial and relatively unstudied (Gerashchenko et al., 2003). One explanation for the scarcity of studies addressing the etiology of non-motor symptoms is the lack of an animal model that replicates the progressive nature of both the motor and non-motor symptoms of the disease.
We have utilized the progressive nature of the cycad-induced parkinsonian model to analyze both the non-motor symptoms and importantly, start to address some of the cellular pathology behind their development. It is known that ORX neurons, while isolated to the lateral hypothalamus, send projections to numerous sleep/wake nuclei throughout the brain (Saper et al., 2001; Sakurai, 2005). Thus, the 15% reduction in ORX neurons seen in cycad-fed rats suggests that this ORX innervation of wake-promoting nuclei may be decreased. This relationship may be particularly relevant since cycad-fed rats also display an increased activation of the remaining cells roughly eight and a half hours into their active phase, which could suggest a potential compensatory mechanism against the early stages of ORX cell loss. Future studies will address the role of this altered ORX activation. Clinically, the involvement of dopaminergic circuitry and the newly discovered loss of ORX neurons in the initial development of PD, suggests that it may be the communication between these two cell types that is first altered, causing behavioral abnormalities such as sleep disturbances and impulse control disorders (Thannickal et al., 2007; Stamey and Jankovic, 2008).
Interestingly, we did not find a significant difference in MCH cell counts. This could be due to the specificity of cycad toxicity or to the relative short length of cycad exposure. Future studies will attempt to elucidate the mechanism of cycad toxicity and continue to analyze the role of orexin and/or dopamine in the development and progression of EDS. Elucidation of the complete circuitry behind the cycad-induced sleep disruption can provide additional, valuable information into the role of sleep disturbances in the initial stages of neurodegeneration for our progressive model of parkinsonism.
Acknowledgments
This work was funded by: National Institutes of Health-Toxicology Training grant (KM); Veteran’s Affairs (PY); and National Institutes of Health, NHLBI (JM). We would also like to thank Dr. Chris Shaw from Neurodyn, Inc. for the cycad seeds.
Footnotes
All work was performed at the University of MD, Baltimore.
References
- Abbott RD, Ross GW, White LR, et al. Excessive daytime sleepiness and subsequent development of Parkinson disease. Neurology. 2005;65:1442–1446. doi: 10.1212/01.wnl.0000183056.89590.0d. [DOI] [PubMed] [Google Scholar]
- Arnulf I, Konofal E, Merino-Andreu M, et al. Parkinson’s disease and sleepiness: an integral part of PD. Neurology. 2002;58:1019–1024. doi: 10.1212/wnl.58.7.1019. [DOI] [PubMed] [Google Scholar]
- Barraud Q, Lambrecq V, Forni C, et al. Sleep disorders in Parkinson’s disease: the contribution of the MPTP non-human primate model. Exp Neurol. 2009;219 (2):574–582. doi: 10.1016/j.expneurol.2009.07.019. [DOI] [PubMed] [Google Scholar]
- Baumann CR, Bassetti CL. Hypocretins (orexins) and sleep–wake disorders. Lancet Neurol. 2005;4:673–682. doi: 10.1016/S1474-4422(05)70196-4. Review. [DOI] [PubMed] [Google Scholar]
- Carlsson A, Lindqvist M, Magnusson T. 3, 4-Dihydroxyphenylalanine and 5-hydroxytryptophan as reserpine antagonists. Nature. 1957;180:1200. doi: 10.1038/1801200a0. [DOI] [PubMed] [Google Scholar]
- Chen L, Thakkar MM, Winston S, et al. REM sleep changes in rats induced by siRNA-mediated orexin knockdown. Eur J Neurosci. 2006;24:2039–2048. doi: 10.1111/j.1460-9568.2006.05058.x. [DOI] [PMC free article] [PubMed] [Google Scholar]
- de Lecea L, Kilduff TS, Peyron C, et al. The hypocretins: hypothalamus-specific peptides with neuroexcitatory activity. Proc Natl Acad Sci USA. 1998;95:322–327. doi: 10.1073/pnas.95.1.322. [DOI] [PMC free article] [PubMed] [Google Scholar]
- Dhawan V, Healy DG, Pal S, Chaudhuri KR. Sleep-related problems of Parkinson’s disease. Age Ageing. 2006;35:220–228. doi: 10.1093/ageing/afj087. Review. [DOI] [PubMed] [Google Scholar]
- El-Ad B, Korczyn AD. Disorders of excessive daytime sleepiness—an update. J Neurol Sci. 1998;53:192–202. doi: 10.1016/s0022-510x(97)00291-8. Review. [DOI] [PubMed] [Google Scholar]
- Fearnley JM, Lees AJ. Ageing and Parkinson’s disease: substantia nigra regional selectivity. Brain. 1991;114:2283–2301. doi: 10.1093/brain/114.5.2283. [DOI] [PubMed] [Google Scholar]
- Friedman JH, Millman RP. Sleep disturbances and Parkinson’s disease. CNS Spectr. 2008;13(Supp 4):12–17. doi: 10.1017/s1092852900017272. Review. [DOI] [PubMed] [Google Scholar]
- Fronczek R, Overeem S, Lee SY, et al. Hypocretin (orexin) loss and sleep disturbances in Parkinson’s disease. Brain. 2007;130 (Pt6):1577–1585. doi: 10.1093/brain/awm090. [DOI] [PubMed] [Google Scholar]
- Gerashchenko D, Blanco-Centurion C, Greco MA, Shiromani PJ. Effects of lateral hypothalamic lesion with the neurotoxin hypocretin-2-saporin on sleep in Long–Evans rats. Neuroscience. 2003;116:223–235. doi: 10.1016/s0306-4522(02)00575-4. [DOI] [PubMed] [Google Scholar]
- Happe S. Excessive daytime sleepiness and sleep disturbances in patients with neurological diseases: epidemiology and management. Drugs. 2003;63:2725–2737. doi: 10.2165/00003495-200363240-00003. Review. [DOI] [PubMed] [Google Scholar]
- Kremer HP, Bots GT. Lewy bodies in the lateral hypothalamus: do they imply neuronal loss? Mov Disord. 1993;8:315–320. doi: 10.1002/mds.870080310. [DOI] [PubMed] [Google Scholar]
- Langston JW, Forno LS. The hypothalamus in Parkinson disease. Ann Neurol. 1978;3:129–133. doi: 10.1002/ana.410030207. [DOI] [PubMed] [Google Scholar]
- Rao SD, Banack SA, Cox PA, Weiss JH. BMAA selectively injures motor neurons via AMPA/kainate receptor activation. Exp Neurol. 2006;201 (1):244–252. doi: 10.1016/j.expneurol.2006.04.017. [DOI] [PubMed] [Google Scholar]
- Rye DB. Excessive daytime sleepiness and unintended sleep in Parkinson’s disease. Curr Neurol Neurosci Rep. 2006;6:169–176. doi: 10.1007/s11910-996-0041-8. Review. [DOI] [PubMed] [Google Scholar]
- Sacks O. The island of the colour-blind and Cycad-island. Picador; London: 1996. p. 120. [Google Scholar]
- Sakurai T. Roles of orexin/hypocretin in regulation of sleep/wakefulness and energy homeostasis. Sleep Med Rev. 2005;9:231–241. doi: 10.1016/j.smrv.2004.07.007. Review. [DOI] [PubMed] [Google Scholar]
- Saper CB, Chou TC, Scammell TE. The sleep switch: hypothalamic control of sleep and wakefulness. Trends Neurosci. 2001;24:726–731. doi: 10.1016/s0166-2236(00)02002-6. Review. [DOI] [PubMed] [Google Scholar]
- Shen WB, McDowell KA, Siebert AA, Clark SM, Dugger NV, Valentino KM, Jinnah HA, Sztalryd C, Fishman PS, Shaw CA, Jafri MS, Yarowsky PJ. Environmental neurotoxin-induced progressive model of parkinsonism in rats. Ann Neurol. 2010;68 (1):70–80. doi: 10.1002/ana.22018. [DOI] [PMC free article] [PubMed] [Google Scholar]
- Stamey W, Jankovic J. Impulse control disorders and pathological gambling in patients with Parkinson disease. Neurologist. 2008;14:89–99. doi: 10.1097/NRL.0b013e31816606a7. Review. [DOI] [PubMed] [Google Scholar]
- Thannickal TC, Lai YY, Siegel JM. Hypocretin (orexin) cell loss in Parkinson’s disease. Brain. 2007;130:1586–1595. doi: 10.1093/brain/awm097. [DOI] [PMC free article] [PubMed] [Google Scholar]
- Yasui K, Inoue Y, Kanbayashi T, et al. CSF orexin levels of Parkinson’s disease, dementia with Lewy bodies, progressive supranuclear palsy and corticobasal degeneration. J Neurol Sci. 2006;250:120–123. doi: 10.1016/j.jns.2006.08.004. [DOI] [PubMed] [Google Scholar]
- Yi PL, Tsai CH, Lu MK, Liu HJ, Chen YC, Chang FC. Interleukin-1beta mediates sleep alteration in rats with rotenone-induced parkinsonism. Sleep. 2007;30:413–425. doi: 10.1093/sleep/30.4.413. [DOI] [PubMed] [Google Scholar]