Abstract
Selective attention involves the relative enhancement of relevant versus irrelevant stimuli. However, whether this relative enhancement involves primarily enhancement of attended stimuli, or suppression of irrelevant stimuli, remains controversial. Moreover, if both enhancement and suppression are involved, whether they result from a single mechanism or separate mechanisms during attentional control or selection is not known. In two experiments using a spatial cuing paradigm with task-relevant targets and irrelevant distractors, target and distracter processing was examined as a function of distractor expectancy. Additionally, in the second study the interaction of perceptual load and distractor expectancy was explored. In both experiments, distractors were either validly cued (70%) or invalidly cued (30%) in order to examine the effects of distractor expectancy on attentional control as well as target and distractor processing. The effects of distractor expectancy were assessed using event-related potentials recorded during the cue-to-target period (preparatory attention) and in response to the task-relevant target stimuli (selective stimulus processing). Analyses of distractor-present displays (anticipated versus unanticipated), showed modulations in brain activity during both the preparatory period and during target processing. The pattern of brain responses suggest both facilitation of attended targets and suppression of unattended distractors. These findings provide evidence for a two-process model of visual spatial selective attention, where one mechanism (facilitation) influences relevant stimuli and another (suppression) acts to filter distracting stimuli.
Keywords: Selective Attention, Event Related Potential, Inhibition, Vision
1. Introduction
Selective attention allows an observer to focus on important aspects of the environment while simultaneously ignoring irrelevant events. Previous research suggests that selection can occur through stimulus driven (bottom-up) or endogenously driven (top-down) mechanisms (e.g., Hopfinger and Maxwell, 2005; Mangun, 1991, 1995; Muller and Rabbitt, 1989; Posner, 2004). Current models of top-down visual selective attention typically propose two related mechanisms that may be used to achieve selective processing: enhancement of the relevant signal, and suppression of the irrelevant signal. However, while research has shown that spatial attention relatively enhances processing of stimuli at attended locations compared to unattended locations (e.g., Di Russo, Martinez and Hillyard 2003; Handy and Khoe 2005; Hillyard, Vogel, and Luck 1998; Mangun and Hillyard, 1991, 1995; Mangun and Fannon, 2007), whether this results from facilitation of the attended stimuli or suppression of the unattended, or both, is not well understood (e.g., Seiss, Driver, and Eimer, 2009).
Top down selection via a relative enhancement of the attended compared to unattended signals can be seen early in visual processing using event related potentials (ERPs) (Van Voorhis and Hillyard, 1977; for review see Mangun, 1995). For example, using a spatial attention cueing paradigm Mangun and Hillyard (1991) demonstrated greater amplitudes for sensory-evoked ERPs over occipital scalp for attended stimuli in the latency range from 80 to 200 ms following stimulus presentation. The shortest latency effects of spatial attention were observed in the P1 component of the ERPs at 80–100 msec after the onset of the stimulus. When the location of the target was correctly precued, the P1 contra-lateral to the attended location was relatively enhanced. Effects of selective attention have also been seen at longer latencies for attention to other physical stimulus features, such as color (e.g., Harter and Aine, 1984; Lange, Wijers, Mulder, Mulder, 1998; Muller and Hillyard, 2000) and has been shown to impact later processing of higher order features (e.g., Lai and Mangels, 2007; Spencer, Dien, and Donchin, 2001). It has been hypothesized that signal enhancement works via a gain control mechanism, increasing sensitivity of neurons to properties of the attended stimulus (Mangun and Hillyard, 1987; Handy and Khoe, 2005; Hillyard, Vogel, Luck, 1998; Navalpakkam and Itti, 2007). Recent work based on studies in nonhuman primates has provided further evidence for how attentional gain control might operate at the neuronal level (Lee and Maunsell, 2009). Such a model complements biased competition models of selection (Duncan, 1996) which postulate that signal enhancement reflects the biasing of competition when an attended stimulus falls within a neuron’s receptive field (for review see Beck and Kastner, 2009). Thus, the level of processing at which biasing occurs differs as a function of task parameters (e.g., Clark and Hillyard, 1996, Hopf et al., 2006).
Top-down control of attentional facilitation prior to stimulus onset (i.e., the source of attentional facilitation) has often focused on three primary components, the early directing attention negativity (EDAN), the anterior directing attention negativity (ADAN), and the late directing attention positivity (LDAP) (e.g., Harter, AnnloVento, 1991; Hopf and Mangun, 2000; Jongen, Smulders, van der Deiden, 2007; Talsma, Slagter, Nieuwenhuis, Hage, Kok, 2005; Van der Stigchel, Heslenfeld, Theeuwes, 2006). The activity shown in these post-cue components have been shown to relate to relative changes in processing at stimulus onset (e.g., Dale, Simpson, Foxe, Luks, Worden, 2008). The earliest of these components, the EDAN, is often seen in the contra-lateral hemisphere to the cued direction approximately 200 to 400 ms following the onset of the cue. This negativity occurs in posterior parietal regions and is thought to reflect interpretation of the cue and redirection of attention to the indicated spatial location (e.g., Harter et al., 1991, Hopf and Mangun, 2000). This component is followed by a more anterior component, the ADAN, that may be related to activation of frontal areas that are involved in the control of visuospatial attention (e.g., Nobre, Sebestyen, Misiussi, 2000; Seiss, Gherri, Eardley, and Eimer, 2007). Finally, a late directing attentional positivity (LDAP), has been found over the contralateral hemisphere to the cued location. This component appears to be a positive slow wave superimposed on a negative slow wave and has been thought to reflect supramodal attentional control processes (e.g., Eimer, van Velzen, and Driver, 2002; Jongen et al., 2007; Seiss, Gherri, Eardley, and Eimer, 2007) or a shifting of attention and encoding of the to-be-attended position (e.g., Green & McDonald, 2006). However, the LDAP has not been found in a number of attentional cueing studies (e.g., Nobre et al., 2000, Talsma et al., 2005, Yamaguchi, Tsuchya, Kobayashi, 1994) and the function it reflects is still equivocal. Additional evidence for facilitation (both at the source of facilitation and at the site of processing) has been provided by both fMRI and MEG research (e.g., Giesbrecht, Woldorff, Song, Mangun, 2003; Hopfinger, Buonocore, Mangun, 2000; Hopfinger, Woldorff, Fletcher, Mangun, 2001).
In addition to studies of facilitation, a number of studies have begun to examine the possible contribution of suppression to selective attention. Evidence of suppression has been found in behavioral studies (e.g., Awh, Matusrka, Serences, 2003; Braithwaite, Humphreys, Hulleman, 2005; Caputo and Guerra, 1998; Hay, Milders, Niedeggen, 2006), studies of split brain patients (Tipper et al., 1997), fMRI and MEG studies (e.g., Serences, Yantis, Culberson, Awh, 2004, Geng, Eger, Ruff, Kristjansson, Rotshtein, Driver, 2006; Hopf, Boehler, Luck, Tsotsos, Heinze, Schoenfeld, 2006; Ruff and Driver, 2006; Serences, Yantis, Culberson, Awh, 2004; Slotnick, Schwarzbach, Yantis, 2003), as well as in studies of oscillatory activity (e.g., Ergenoglu, Demiralp, Bayraktaroglu, Ergen Beydagi, Uresin, 2004; Kelly, Lalor, Reilly, Foxe, 2006; Sreenivasan and Jha, 2007; Thut, Nietzel, Brandt, Pascual-Leone, 2006; Worden, Foxe, Wang, Simpson, 2000; Yamagishi, Goda, Callan, Anderson, Kawato, 2005). However, it has only been recently that activity related to suppression has been examined using ERPs (e.g., Seiss, Driver, and Eimer, 2009, Van der Stigchel, Heslenfeld, and Theeuwes, 2006). For example, Seiss et al. (2009) presented participants with a spatial cueing task in the presence or absence of flanking distractors. In addition to the presence of the EDAN, ADAN, and LDAP contralateral to the cued location, the ADAN in particular was enhanced in blocks where flanking distractors were present. However, it was not possible to look at the effects of distractor anticipation on target or distractor processing at stimulus onset because distractor processing could not be isolated from target processing in this paradigm. Thus it is not clear if changes in the ADAN as a function of the anticipation of distractors influenced target processing through additional increases in target facilitation, or through both target facilitation and distractor suppression.
One factor that may aid in the understanding of the contributions of facilitation and suppression is selective attention is the perceptual load of the task at hand (e.g., Lavie, 1995; Lavie and Cox, 1997; Lavie, Hirst, Fockert, Viding, 2004). It has been theorized that with increased perceptual load the availability of resources for the processing of distractors decreases (Lavie, 1995). This has been evidenced by ERP studies that have shown decreased processing of distractor stimuli (as seen in the P1 or N1) when the target increases in perceptual load (Couperus, 2009, Handy and Mangun, 2000, Handy, Soltani, and Mangun, 2001). Moreover, a recent study suggests that there may also be an increase in target processing when perceptual load is increased (Barnhardt, Ritter, and Gomes, 2008). However, while it is clear that knowledge of perceptual load prior to stimulus onset affects stimulus processing (e.g., Couperus, 2009; Barnhardt et al, 2008; Theeuwes, Kramer, Belopolsky, 2004), activity as a function of anticipated perceptual load prior to stimulus onset has not been examined.
The current study was designed to examine both preparatory mechanisms, as well as activity related to stimulus processing, to investigate the potential contributions of enhancement and inhibitory processes to attentional selection. Thus, our aims were first to replicate the findings of previous studies of enhanced processing as a function of selective attention, and then to examine how the anticipation (and presence) of a distractor, as well as the perceptual load of the target, influenced target processing.
In the first experiment, ERPs were examined following a cue that indicated the presence or absence of distractors in order to examine facilitation and suppression mechanisms during preparatory attention. Additionally, ERP responses at stimulus onset were examined in relation to anticipated distractor presence. In the second experiment, target discriminability was manipulated in order to determine whether perceptual load influences facilitation and/or suppression processes during preparatory attention and stimulus selection.
1.1 Experiment 1
In Experiment 1, on each trial, observers were presented with a cue followed by either a unilateral (target only) or bilateral (target plus distractor) display. The design allowed for the comparison of behavior and ERPs to targets at attended locations when distractors were anticipated versus when they were not, for the cases where distractors did and did not actually appear in the display. By measuring ERPs separately to the cues and the target displays, it was possible to investigate both attentional control processes (time-locked to cues), target, and distractor processing (time-locked to the target displays).
2. Results
2.1 Behavioral Analyses
Reaction time and accuracy data for distractor cue valid and distractor cue invalid trials were examined to determine if distractor anticipation influenced behavior. One participant’s behavioral data was excluded from analyses due to a misunderstanding of the required response in the task. A 2 (distractor presence) by 2 (distractor cue validity) repeated-measures ANOVA was used in analyses: Note that the cues were 100% instructive of the visual hemifield to attend, and therefore distractor cue validity refers only to the information in the cue regarding the presence/absence of distractors.
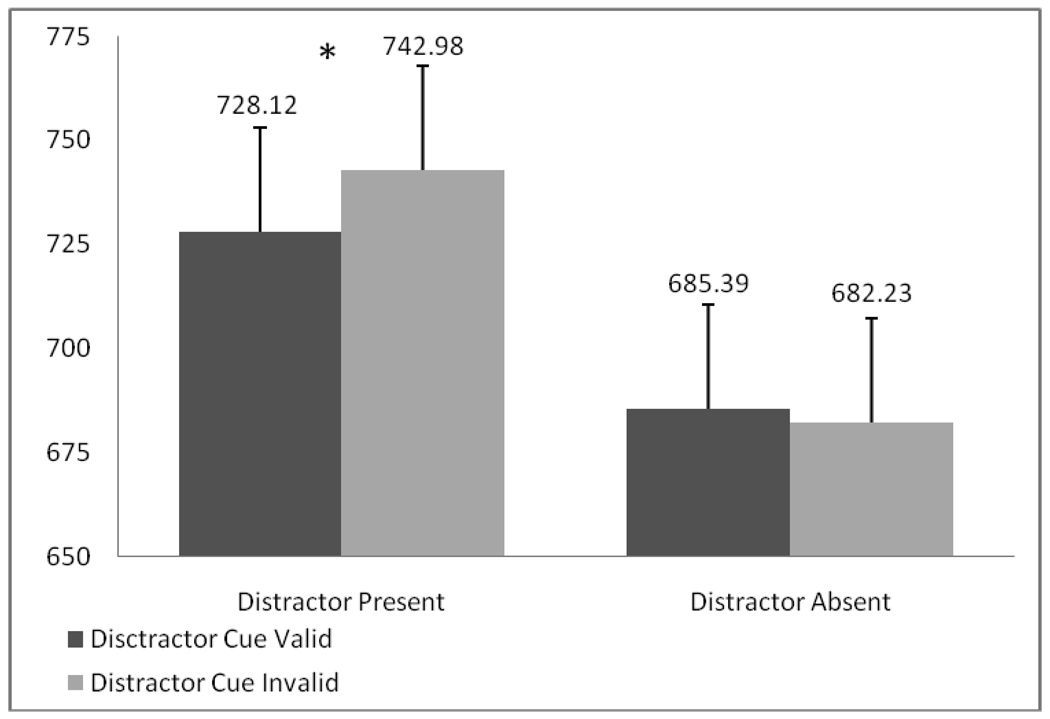
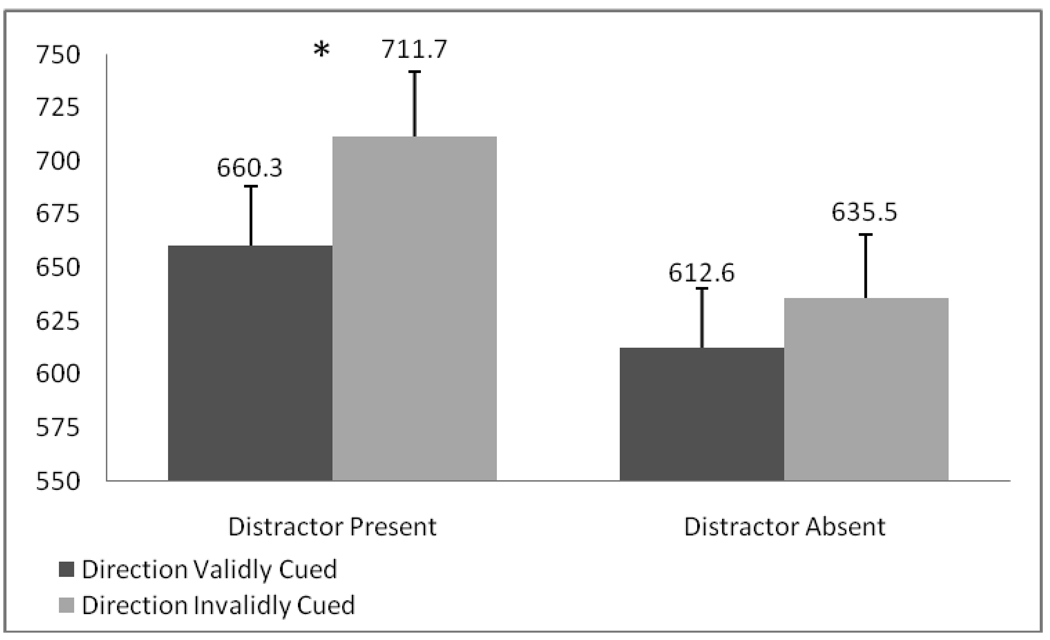
Reaction time data showed a significant main effect of distractor presence (F(1,18)=39.20, p<. 001, ηp2=.685) and a distractor presence by distractor cue validity interaction (F(1,18)=6.25, p=. 022, ηp2=.258; see Figure 2). The main effect demonstrates slower reaction times when a distractor was present. Moreover, the interaction reflects significantly slower reaction times when distractor presence was invalidly cued and a distractor appeared (t(18)=−2.71, p=.014) as compared to when the distractor was validly cued. In contrast, no significant differences were found as a function of cue validity for distractor absent trials (ps>.05).
Figure 2.
Experiment 1. Reaction times to target stimulus.
The results for accuracy were in the same direction, but did not reach statistical significance. There was, however, a (nonsignificant) trend in the interaction between distractor presence and distractor cue validity (F(1,18)=3.72, p=.07, ηp2=.171). Although not significant, this interaction is consistent with the reaction time data, and the findings by Awh et al. (2003) which found higher accuracy when the presence of distractors (i.e., high noise trials) was anticipated (i.e., within a high noise block). Taken together, the reaction time and accuracy data suggest that subjects probably utilized the information in the cue regarding the likelihood that an upcoming array would contain a distractor.
2.2 Early Preparatory Activity Following the Cue – (270–320 ms post-cue)
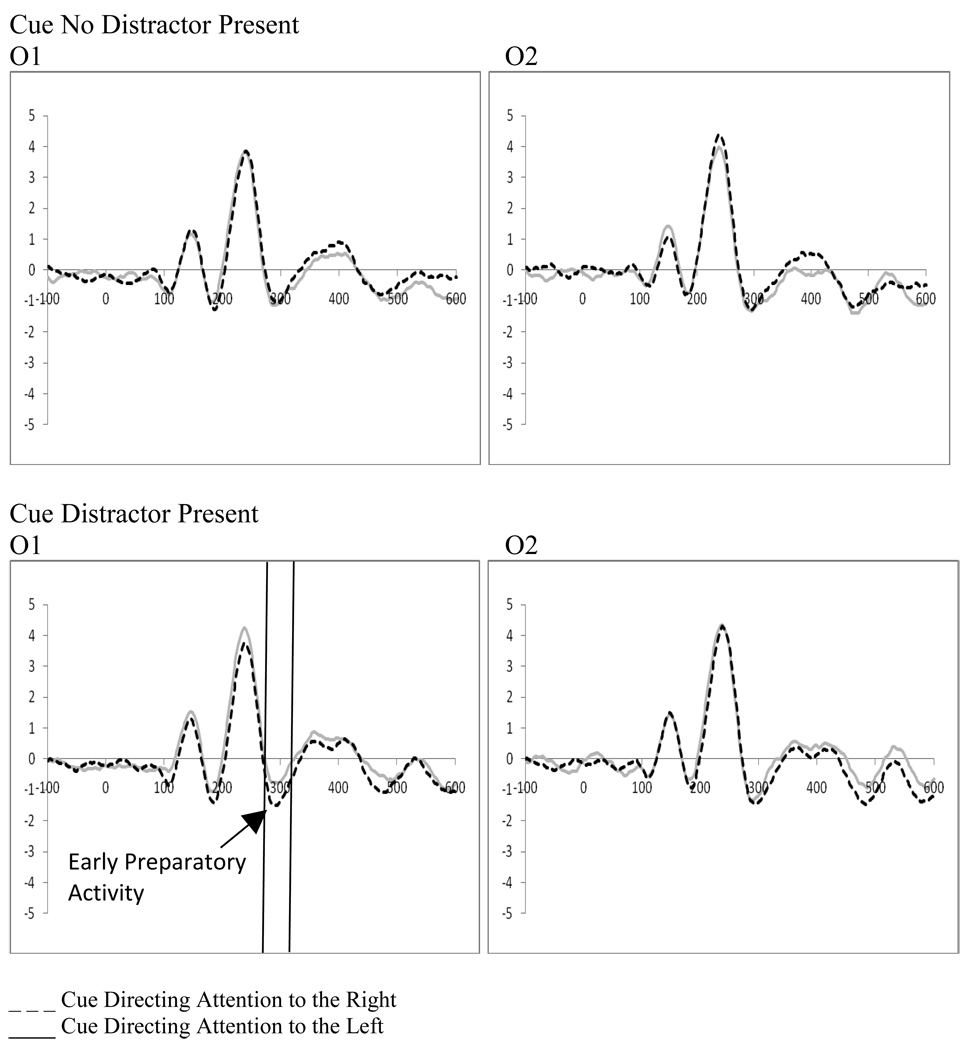
A 2 (cue type: distractor present vs. distractor absent) by 2 (cue direction: attend left vs. attend right) by 2 (electrode: O1 vs. O2) repeated-measures ANOVA examining preparatory activity related to the cue at occipital leads (O1, O2) showed a significant interaction between the cue type (i.e., indicating the presence or absence of a distractor), and the direction of the cue (F(1,18)=5.30, p=.033, ηp2=.227). The significant interaction reflects a stronger negative peak when a cue to the right also indicated a distractor would be present (O1, t(18)=−2.14, p=.046, Figure 3). However, there were no significant main effects or interactions of cue direction with the electrode factor (p’s>.1) suggesting that early attention effects following the cue were not present (i.e., there was no early preparatory processing contralateral to the cued location as a function of attention).
Figure 3.
Experiment 1. ERPs to cues directing attention as a function of cue type at O1/O2 showing a significantly stronger negative peak when a cue to the right also indicated a distractor would be present.
2.3 Late Preparatory Activity Following the Cue – (360–460 ms post-cue)
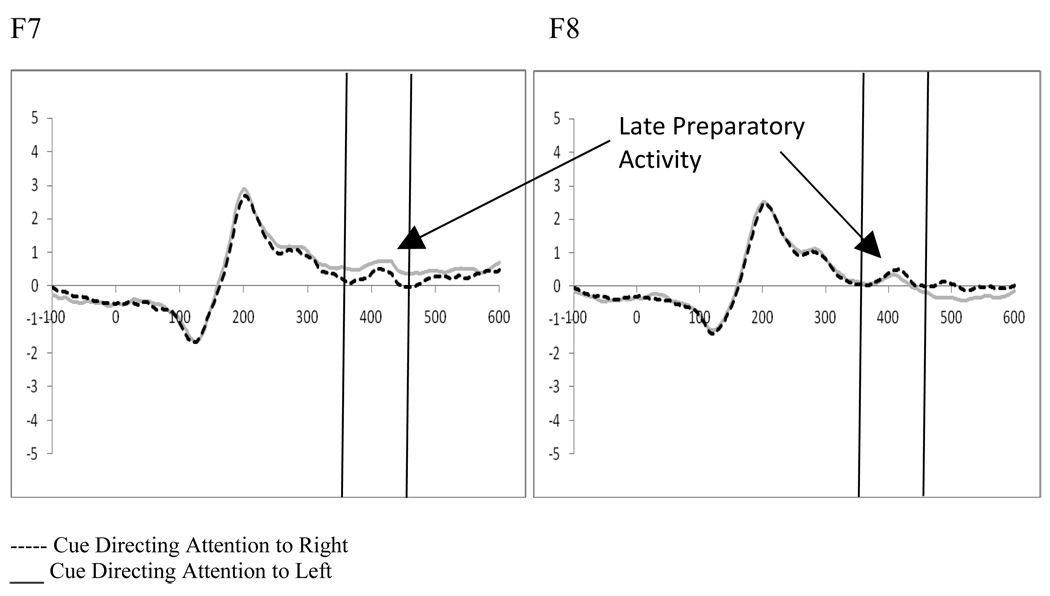
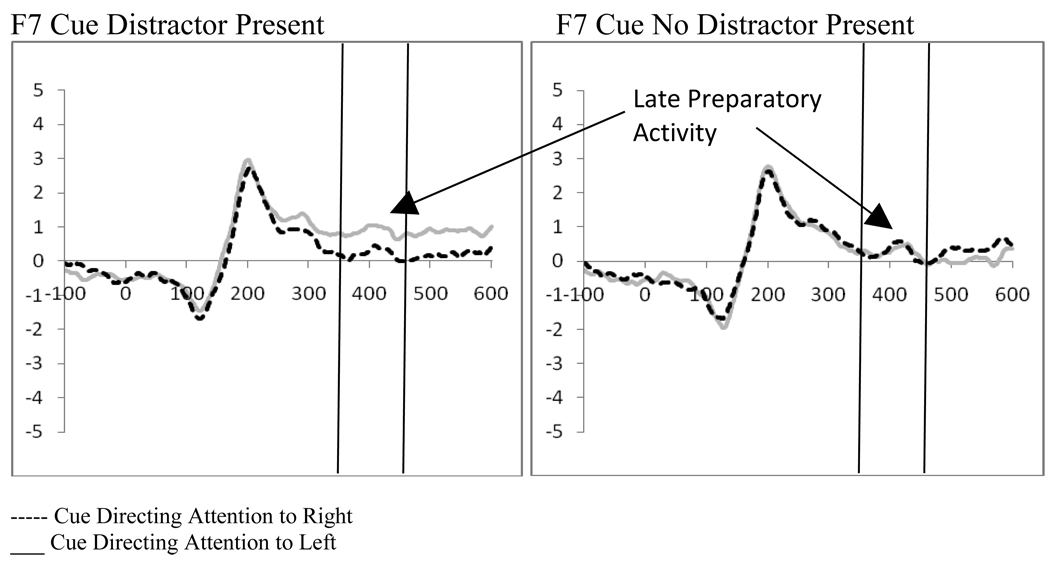
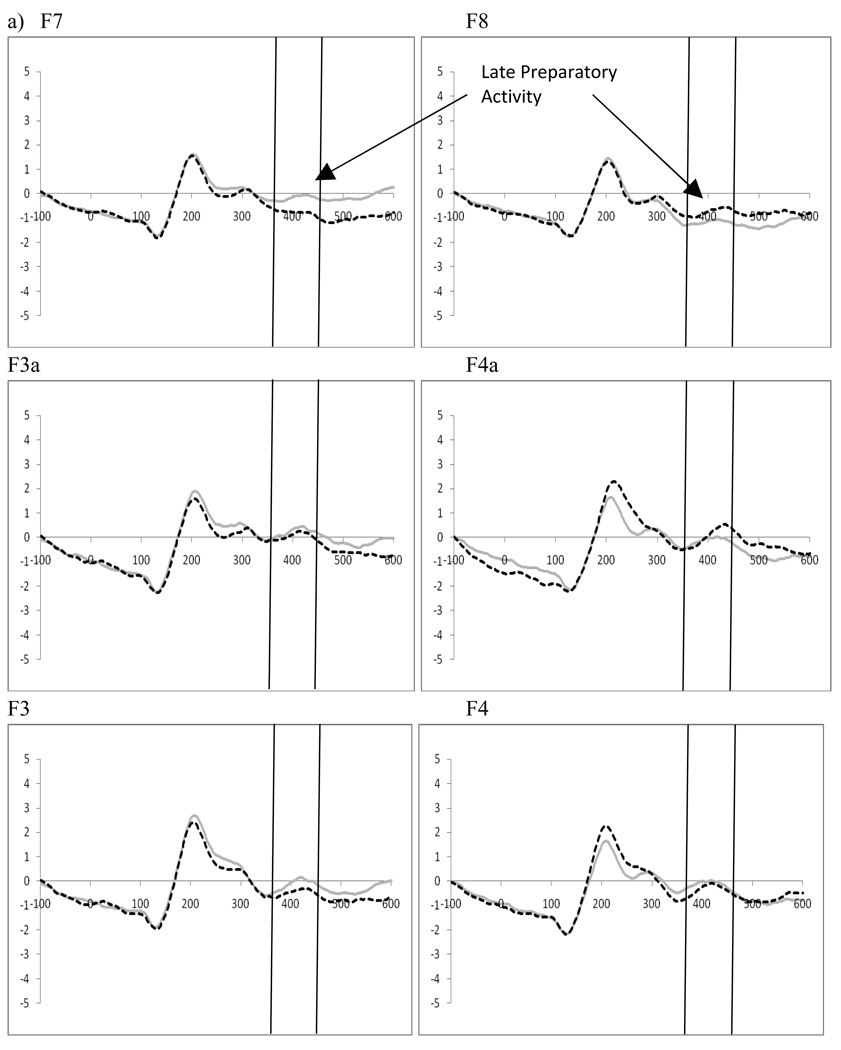
Two (cue type: distractor present vs. distractor absent) by 2 (cue direction: attend left vs. attend right) by 2 (electrode: F7 vs. F8 or F3 vs. F4) repeated-measures ANOVAs were performed separately for the electrode pairs F7/F8 and F3/F4, in order to examine late preparatory activity related to the cue. This analysis showed a significant interaction between the cue type (i.e., indicating the presence or absence of a distractor) and the electrode for both electrode pairs (F7/F8, F(1,19)=8.23, p=.01, ηp2=.302; F3/F4, F(1,19)=7.56, p=.013, ηp2=.285). Moreover, at F7/F8 a significant interaction between the direction of the cue and the electrode (F(1,19)=7.59, p=.013, ηp2=.286, see Figure 4) was seen, as well as a three-way interaction between the cue type, the direction of the cue, and the electrode (F(1,19)=4.67, p=.044, ηp2=.197). Post-hoc analyses for the F7/F8 pair examined cues as a function of the indication of distractor presence. While there were no significant main effects or interactions between the direction of the cue and the electrode when the cue indicated there would not be a distractor, there was a significant main effect of electrode (F(1,19)=5.48, p=.03, ηp2=.224) and a significant interaction between the direction of the cue and the electrode (F(1,19)=16.26, p=.001, ηp2=.461) when the cue indicated a distractor would be present. These effects reflect a greater amplitude at F7 when there was a cue directing attention to the left that also indicated a distractor would be present (t(19)=3.31, p=.004, Figure 5). This increased positivity results in a negative peak (similar to what has been termed the ADAN) when ERPs produced by cues directed to the right are subtracted from those produced by cues directed to the left at F7. However, as this waveform is a subtraction, this pattern can be interpreted as either a positive shift ipsilateral to the direction of attention or a negative shift contralateral to the unattended hemifield.
Figure 4.
Experiment 1. ERPs to cues directing attention (collapsed across cue type: indication of distractor presence) show Late Preparatory Activity at F7/F8 reflecting significant attention effects.
Figure 5.
Experiment 1. ERPs to cues at F7 when the cue indicated a distractor would or would not be present.
2.4 Stimulus Processing at P1
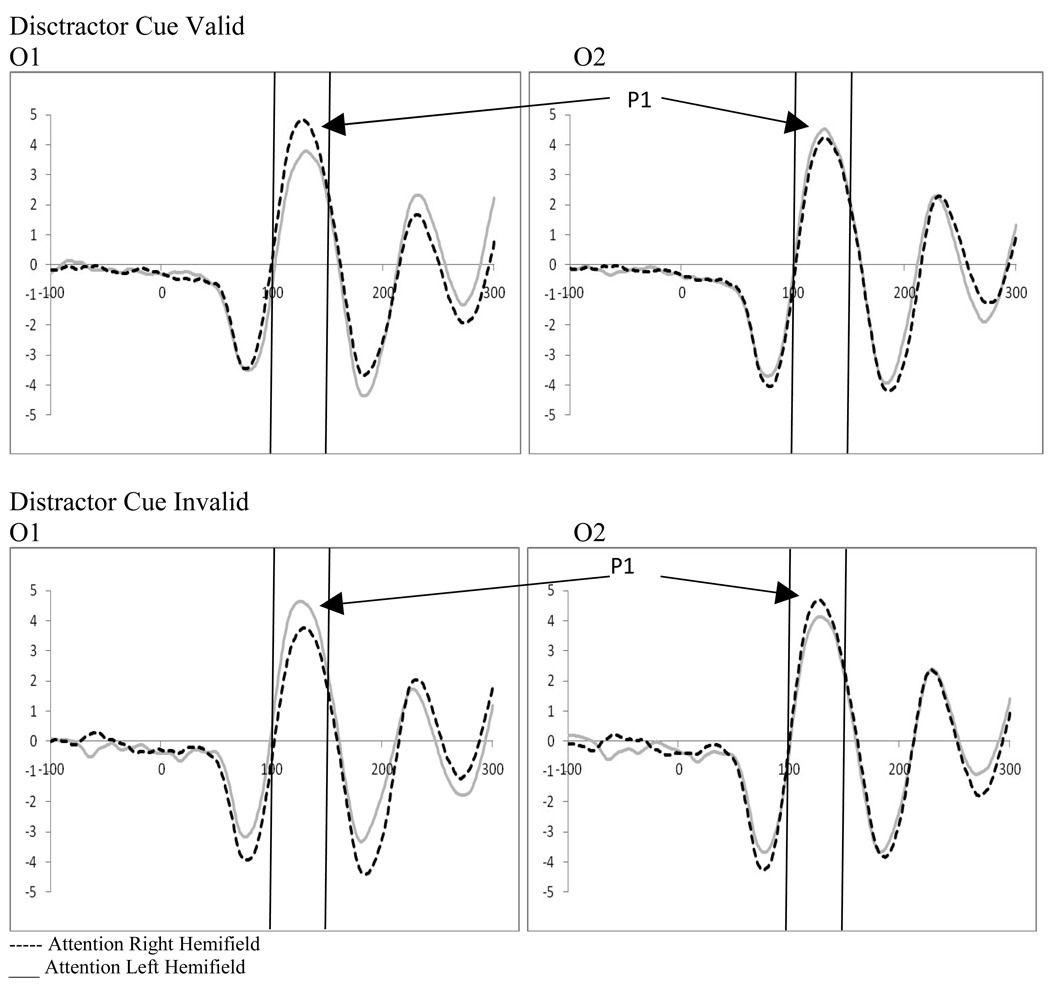
Examination of attention and distractor anticipation effects on the P1 were carried out for displays containing distractors using a 2 (cue type: distractor cue valid vs. distractor cue invalid) by 2 (direction of attention: attend left vs. right) by 2 (electrode: O1 vs. O2) repeated-measures ANOVA. While there were no significant main effects, there was a significant 3-way interaction between cue type, direction of attention, and electrode (F(1,18)=16.34, p=.001, ηp2= .476). To better understand this interaction, follow-up analyses were performed to explore attention effects as well as the effect of distractor anticipation on stimulus processing.
2.5 Effects of Distractor Anticipation on Stimulus Processing at the P1
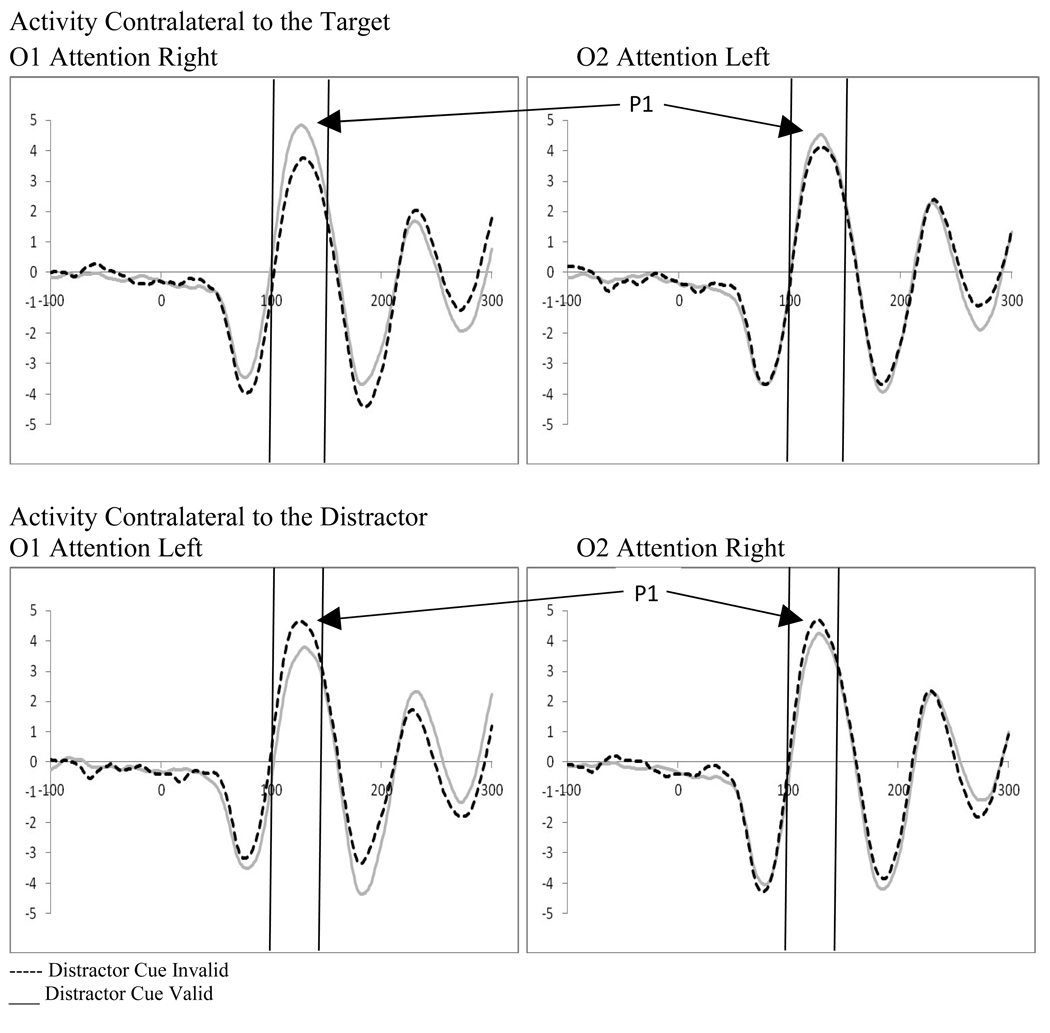
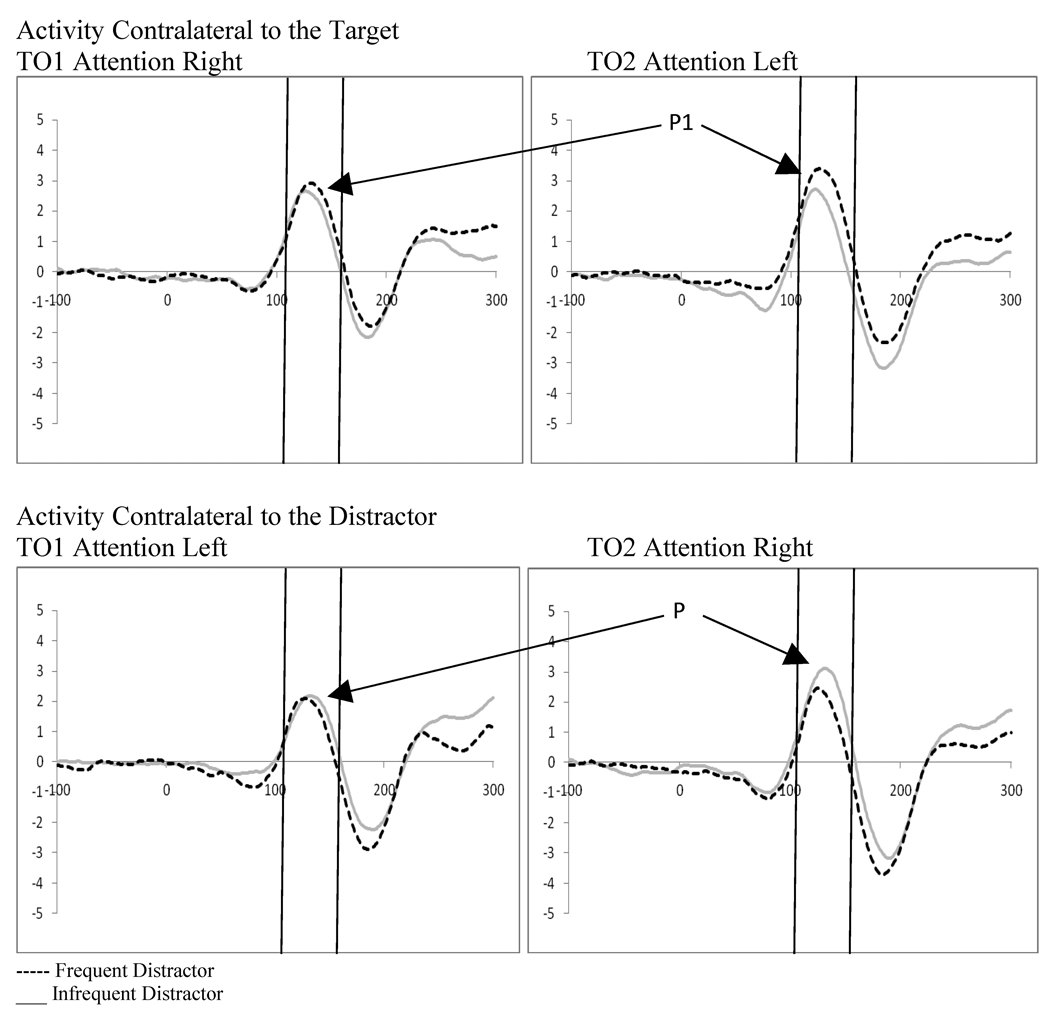
Examination of attention affects were carried out for displays containing distractors for both distractor cue valid and distractor cue invalid trials using 2 (direction of attention: attend left vs. attend right) by 2 (electrode: O1 vs. O2) repeated-measures ANOVAs. Distractor absent conditions were not examined as the location of the target was always correctly cued, and thus, no ERPs to unattended targets were available. Analysis of the distractor cue valid trials showed a significant interaction between the direction of attention and the electrode examined (F(1,18)=12.31, p=.003, ηp2= .406). This interaction results from the P1 being greater in amplitude over the hemisphere contralateral to the direction of attention (see Figure 6). Similarly, analysis of the distractor cue invalid trials showed a significant interaction between the direction of attention and electrode site (F(1,18)=12.24, p=.003, ηp2= .405). However, the direction of attention affects are reversed in the distractor cue invalid trials, with greater activity contralateral to the unattended distractor (see Figure 6). In the context of the affects of distractor anticipation on contralateral versus ipsilateral processing, these data can be understood as showing that when distractors are anticipated, processing contralateral to the direction of attention increases and processing ipsilateral to the direction of attention decreases. The reverse is true when distractors are not anticipated; processing contralateral to the direction of attention decreases and processing ipsilateral to the direction of attention increases (see Figure 7).
Figure 6.
Experiment 1. Effects of distractor anticipation on attention effects at the P1 in occipital leads (O1/O2) (all attention effects significant at P1).
Figure 7.
Experiment 1. Effect of distractor anticipation on stimulus processing at occipital leads (O1/O2) as a function of the direction of attention (all effects significant at P1).
3. Discussion
In Experiment 1 the behavioral and ERP data consistently show both target facilitation and suppression of irrelevant stimuli. As anticipated based on previous studies (e.g., Awh et al., 2003), reaction time data showed a slowing of responses to displays that contained distractors, moreover, responses were slowed further if the presence of the distractor was not anticipated (see Figure 2). Electrophysiological correlates of these effects were examined both following the cue and following the presentation of the stimulus display. Differences in early preparatory activity related to the type and direction of cue were not found in the time frame and location typically associated with the EDAN. However, given the non lateralized nature of the cue stimulus this was not unexpected (e.g., Jongen et al., 2007). In contrast, late preparatory activity did show attention related activity similar to ADAN effects. Late preparatory activity showed a negative difference in the hemisphere contralateral to the direction of attention when a distractor was anticipated. Because this is a subtraction waveform, this pattern can be interpreted as either a positive shift ipsilateral to the direction of attention or a negative shift contralateral to the unattended hemifield. Either interpretation suggests that frontal areas involved in the control of visuospatial attention are activated in this task as has been seen in previous studies (e.g., Nobre, Sebestyen, Misiussi, 2000; Seiss, Gherri, Eardley, and Eimer, 2007). Intriguingly, this effect was only observed in the present study when a distractor was anticipated, supporting previous findings that the ADAN may be modulated by distractor anticipation (Seiss et al., 2009). More specifically, data presented here suggest late preparatory activity is modulated contralateral to the hemifield where the distractor is anticipated. Jongen et al. (2007) suggest that the absence or reduction in cue components such as the ADAN may be a result of a low level of need for selection. As the distractor absent condition does not require the same degree of selection, this may be why late preparatory activity did not show attention effects in the distractor absent condition.
To explore the effects of spatial attention and distractor anticipation on stimulus processing, we examined the ERPs evoked by the stimulus displays. Facilitation contralateral to the direction of attention (i.e., the location of target stimuli presentation) was seen at the P1 component when a distractor was present. Moreover, distractor anticipation influenced processing contralateral to the direction of attention at the P1 with greater activity contralateral to the direction of attention when a distractor was anticipated relative to when it was not anticipated. Additionally, contralateral to the unattended hemifield, processing of the unattended stimulus (i.e., the distractor) was greater when a distractor was not anticipated in relation to when it was anticipated. Changes in processing ipsilateral to the cued location late in cue processing as a function of distractor anticipation, combined with decreased P1 processing contralateral to the unattended hemifield when a distractor was anticipated, suggest that in addition to target enhancement, distractor suppression may contribute to successful selective attention.
However, previous studies have shown that additional factors such as perceptual load of the target stimulus influence distractor processing (e.g., Couperus, 2009; Handy et al., 2001). Thus, it is possible that in addition to distractor anticipation, the nature of the target stimulus may influence both facilitation as well as possible suppression of distractors. Evidence of modulations in cue-related and stimulus-related activity might provide additional evidence of facilitative and suppressive mechanisms. To investigate this possibility, Experiment 2 explores the role of perceptual load in this task.
4. Experiment 2
Perceptual load theories of selective attention (e.g., Lavie, 1995) suggest that when the perceptual load of the relevant task is high, fewer resources are left for the processing of distractors. In contrast, when perceptual load is low, distractors are more fully encoded at early levels of perceptual processing requiring selection at later levels of processing. The task in Experiment 1 could be considered a high perceptual load task because it required performance of a difficult perceptual discrimination, and performance was not at ceiling (mean accuracy of 75.5 percent; SD 18.1, range 33–99). Findings of greater distractor processing when a distractor was not anticipated in Experiment 1 would then suggest that inhibition is present at high perceptual load. This would be consistent with recent work by Torralbo and Beck (2008) who posit a mechanism for the effects of perceptual load on selective attention that relies on local competition between neural representations of the attended stimuli. For example, when stimuli are presented in a high density array (i.e., high perceptual load) there is greater competition and biasing at local levels of processing which increases the saliency of the attended item and reduces distractor interference. In constrast, when a low density array is utilized, competitive interactions are not present and cannot aid in selection, thereby leading to greater interference by distractors. This would therefore also be the case when a distractor is presented in the contralateral hemifield to the target item as these local competitive interactions are not present. While, this mechanism of selection does not account for studies of perceptual load where load is manipulated using within target modifications (i.e., a task that does not require some form of visual search such as changes in discriminability of the stimulus, e.g., Handy et al. 2001), it might account for findings of distractor inhibition in this task as greater top-down biasing may be necessary to reduce interference from a distractor in the non-attended hemifield. Moreover, it supports studies that find reduced processing of an unattended distractor when the target is at high perceptual load as compared to low perceptual load due to greater need for top-down biasing of attention at high perceptual load (e.g., Fu, Zinni, Squire, Kumar, Caggiano, Parasuraman, 2007). However, previous studies examining the effects of perceptual load on processing using ERPs have presented the target and probe stimuli sequentially rather than concurrently (e.g., Couperus, 2009; Handy et al., 2001; Fu et al., 2007). Thus it is not clear what, if any, impact perceptual load of the target would have on distractor processing when the distractor appears concurrently with the target. It has been proposed that reductions seen in the processing of probe stimuli with increasing perceptual load is a function of a narrowing of spatial attention. We might hypothesize based on these studies that if there are affects of perceptual load, these affects would show reduced processing of distractor stimuli in the presence of high perceptual load targets. Moreover, this effect may be achieved via increased distractor suppression when a high perceptual load target is present. Thus, in Experiment 2 the influence of perceptual load on target enhancement and distractor suppression was examined. These effects were examined at the N1 in addition to the P1 as previous research suggests that perceptual load in lateralized tasks may influence the N1 rather than the P1 (Barnhardt, Ritter, Gomes, 2008; Fu, Huang, Luo, Wang, Fedota, Greenwood, Parasuraman, 2009; Handy and Mangun, 2000).
In addition to examining the effects of perceptual load, Experiment 2 also aims to clarify the effects seen in Experiment 1 by ensuring that post-cue effects such as those seen in late processing of the cue do not reflect stimulus properties. To this end, Experiment 2 included a task that examined the effects of the cue alone. However, as no significant effects were seen between the different types of cues (p’s>.05) this task is not presented.
5. Results
5.1 Behavioral Analyses
In order to evaluate whether distractor anticipation or perceptual load of the target influenced behavior, we evaluated the reaction time and accuracy data using a 2 (distractor frequency; frequent vs. infrequent) by 2 (perceptual load of target; low vs. high) by 2 (distractor presence; present vs. absent) repeated-measures ANOVAs; these were conducted separately for frequent and infrequent distractor epochs. Analysis of accuracy data showed a main effect of perceptual load (F(1,19)=26.92, p<.001, ηp2=.586) with greater accuracy for low perceptual load targets as compared to high perceptual load targets. Additionally there was a significant interaction between distractor frequency and distractor presence (F(1,19) )=7.23, p=.015, ηp2=.276). Follow-up t-tests suggest this effect resulted from reduced accuracy when a distractor was present in the infrequent distractor epochs (t(19)=−2.79, p=.013).
Analysis of reaction time data also showed a main effect of perceptual load (F(1,19)=72.14, p<.001, ηp2=.792) with slower reaction times to high perceptual load targets, and a main effect of distractor presence (F(1,19)=52.40, p<.001, ηp2=.734) with slower reaction times when distractors were present (see Figure 8). Additionally, there was a significant interaction between distractor frequency and distractor presence (F(1,19)=18.30 p<.001, ηp2=.491) reflecting slower reaction times when a distractor was present in the infrequent distractor epoch as compared to the frequent distractor epoch (t(19)=−2.55, p=.02).
Figure 8.
Experiment 2. Reaction times to target stimuli.
5.2 Early Preparatory Activity Following the Cue – (270–320 ms post-cue)
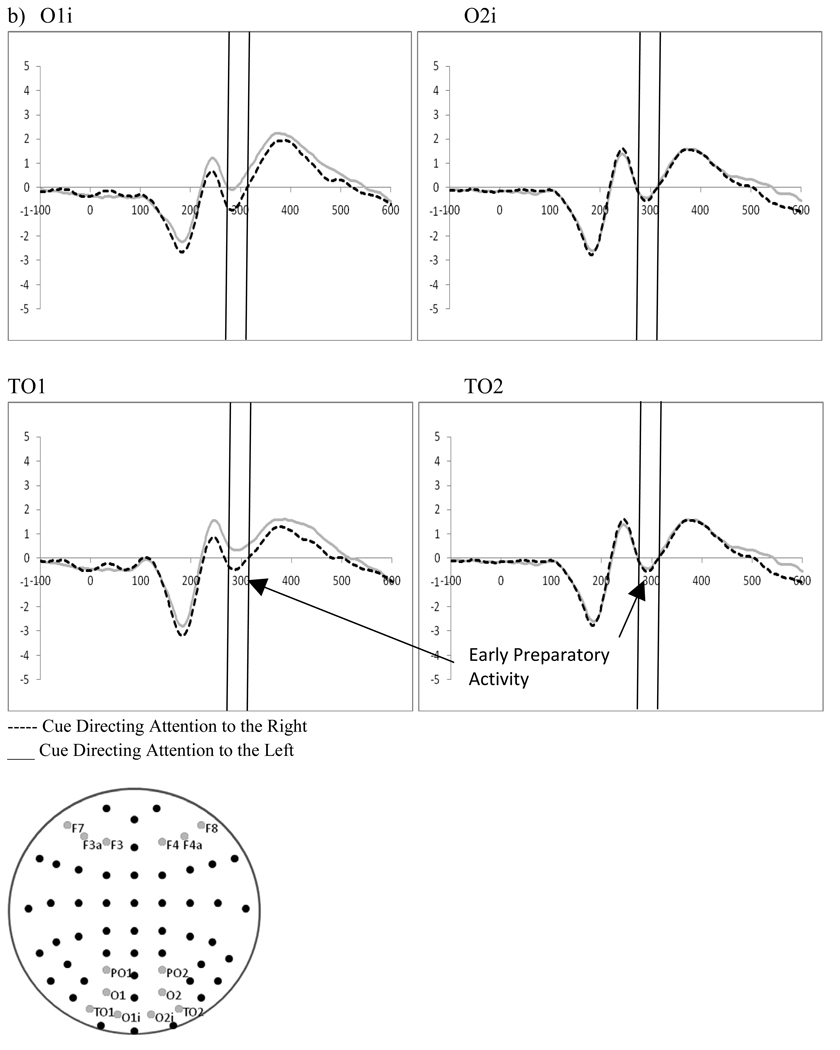
Two 2 (distractor frequency: frequent vs. infrequent) by 2 (perceptual load: high vs. low) by 2 (cue direction: right vs. left) by 2(electrode: left hemisphere vs. right hemisphere) repeated measures ANOVAs on occipital electrodes (O1i/O2i, TO1/TO2) examined processing of the cue between 270 and 320ms after cue presentation (see Figure 9). Both electrode pairs showed a significant main effect of hemisphere (O1i/O2i, F(1,19)=5.32, p=.033, ηp2=.219; TO1/TO2, F(1,19)=6.46, p=.02, ηp2=.254) with stronger negativities in the left hemisphere. Additionally, both showed a significant interaction between the direction of the cue and the electrode (O1i/O2i, F(1,19)=13.88, p=.001, ηp2=.442; TO1/TO2, F(1,19)=14.52, p=.001, ηp2=.433) reflecting greater negativities in O1i and TO1 for cues directing attention to the right hemifield as compared to those directed to the left.
Figure 9.
Experiment 2. ERPs to cues directing attention (collapsed across cue type: indication of distractor presence) demonstrating a) significant affects of attention in late preparatory activity at frontal leads F7/F8, F3a/F4a, F3/F4, b) significant attention effects in early preparatory activity at occipital leads O1i/O2i, TO1/TO2.
5.3 Late Preparatory Activity Following the Cue – (360–460 ms post-cue)
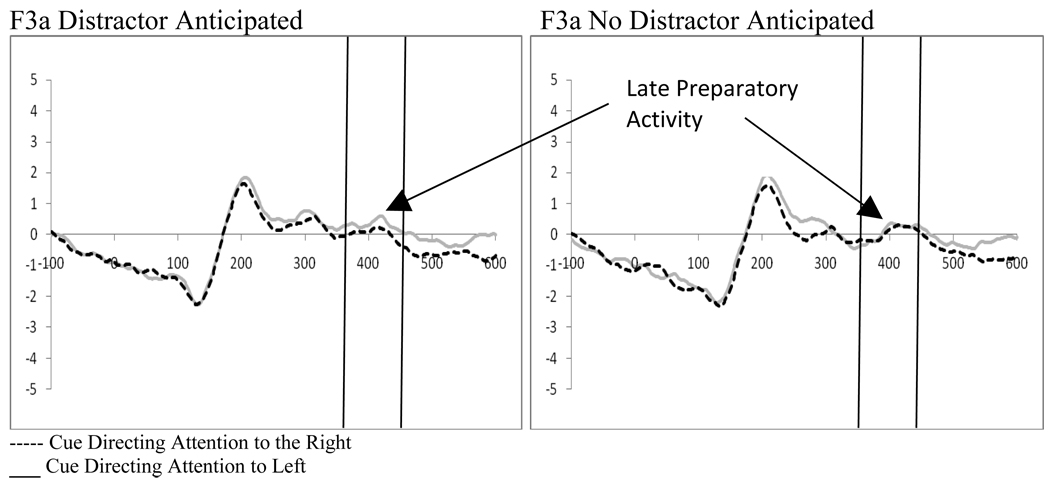
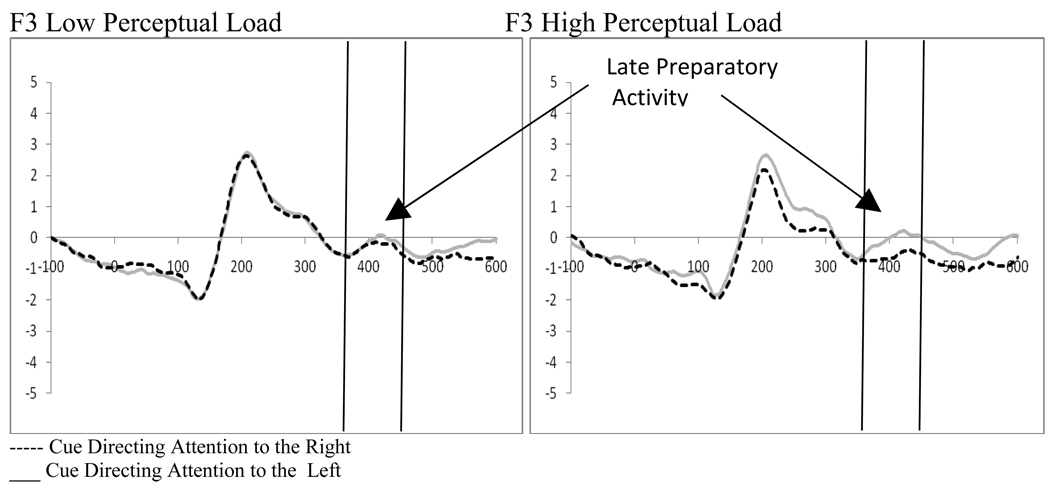
Three 2 (distractor frequency: frequent vs. infrequent) by 2 (perceptual load: high vs. low) by 2 (cue direction: right vs. left) by 2 (electrode: left hemisphere vs. right hemisphere) repeated measures ANOVAs on fronto-central electrode pairs (F7/F8, F3a/F4a, F3/F4) examined processing of the cue between 360 and 460ms after presentation (see Figure 9). While there was only one significant main effect (the F7/F8 pair showed a main effect of electrode (F(1,18)=5.89, p=.026, ηp2=.246) with a stronger positive deflection in F7 as compared to F8), there were a number of significant interactions. Of particular interest in examining late preparatory activity was the finding of a significant or trend interaction in all three electrode pairs between direction of the cue and the electrode (F7/F8, F(1,18)=30.49, p<.001, ηp2=.629; F3a/F4a, F(1,18)=4.36, p=. 051, ηp2=.195; F3/F4, F(1,18)=8.43, p=.009, ηp2=.319). This attention affect was strongest in the F7/F8 pair creating a negative component when processing from left directed cues is subtracted from right directing cues in the hemisphere contralateral to target presentation. As in Experiment 1, this could also be interpreted as greater processing ipsilateral to the direction of the cue. Additionally, the F3a/F4a and F3/F4 electrode pairs had significant interactions related to these attention effects. The F3a/F4a electrode pair showed an interaction between the frequency of the distractor, the direction of the cue, and the electrode (F(1,18)=4.89, p=.04, ηp2=.213) that was driven by a stronger attention effect at F3a when distractors appeared frequently (i.e., the frequent distractor epoch; t(18)=2.14, p=.046; see Figure 10). In contrast, the F3/F4 pair showed an interaction between perceptual load and electrode (F(1,18)=8.31, p=.01, ηp2=.316) as well as between perceptual load, cue direction, and electrode (F(1,18)=5.01, p=.038, ηp2=.218). The interactions at F3/F4 reflect a greater attention effect at F3 at high perceptual load (t(18)=3.06, p=.007, Figure 11). Thus, while distractor presence affects the strength of the attention effects at F3a, perceptual load influences this effect at F3. While not anticipated, there was a significant interaction between perceptual load and direction of the cue in all three electrode pairs (F7/F8, F(1,18)=4.78, p=.042, ηp2=.210; F3a/F4a, F(1,18)=4.78, p=.042, ηp2=.210; F3/F4, F(1,18)=5.40, p=.032, ηp2=.231). The pattern of differences that led to this interaction is exemplified in the F3/F4 electrode pair where there was significantly greater processing of cues directed to the left hemifield as compared to right hemifield at high perceptual load (t(18)=2.39, p=.028) while the same was not true for low perceptual load directing attention to the right hemifield (t’s>.05).
Figure 10.
Experiment 2. Effects of distractor anticipation on late preparatory activity at F3a demonstrating significant attention effects when a distractor was anticipated.
Figure 11.
Experiment 2. Effects of perceptual load on late preparatory activity at F3 demonstrating significant attention effects at high perceptual load.
5.4 Stimulus Processing at P1
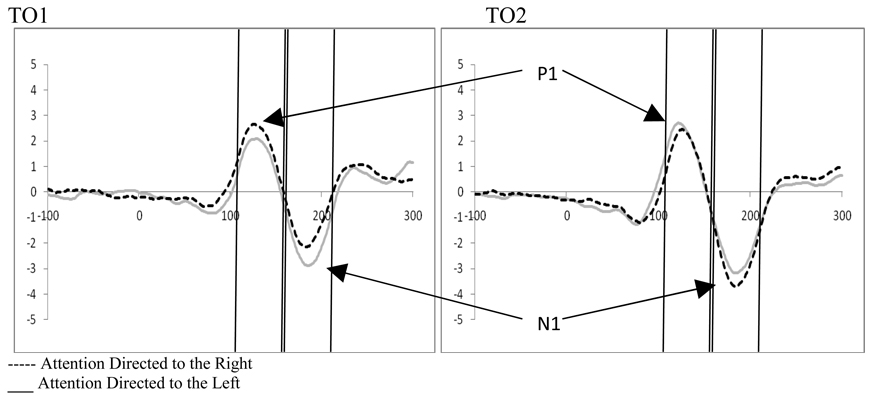
Examination of attention, perceptual load, and distractor anticipation on the P1 were carried out for displays containing distractors using a 2 (distractor frequency: frequent vs. infrequent) by 2 (perceptual load: high vs. low) by 2 (direction of attention: attend left vs. right) by 2(electrode: left vs. right hemisphere) repeated-measures ANOVA for four electrode pairs (TO1/TO2, O1/O2, O1i/O2i, and PO1/PO2). There was a main effect of distractor frequency in the two most occipital electrode pairs (TO1/TO2, F(1,19)=5.24, p=.034, ηp2=.216; O1i/O2i, F(1,19)=5.36, p=.032, ηp2=. 220) reflecting greater amplitudes during the frequent distractor epochs. A main effect of direction of attention in the O1/O2 electrode pair (F(1,19)=6.48, p=.02, ηp2=.254) was the only other main effect. Interactions were found for all electrode pairs between the direction of attention and electrode reflecting attention effects at the P1 (PO1/PO2, F(1,19)=15,57, p=.001, ηp2=.45; O1/O2, F(1,19)=18.14, ηp2=.488; O1i/O2i, F(1,19)=22.23, p<.001, ηp2=.539; TO1/TO2, F(1,19)=18.96, p<.001, ηp2=.499). The only other interaction was between distractor frequency and electrode for the O1i/O2i pair (F(1,19)=4.38, p=.05, ηp2=.187). To better understand this interaction, and explore a priori hypotheses concerning the effects of perceptual load which may have been masked by effects of distractor frequency, follow-up analyses were conducted.
5.5 Effect of Distractor Anticipation on Stimulus Processing at P1
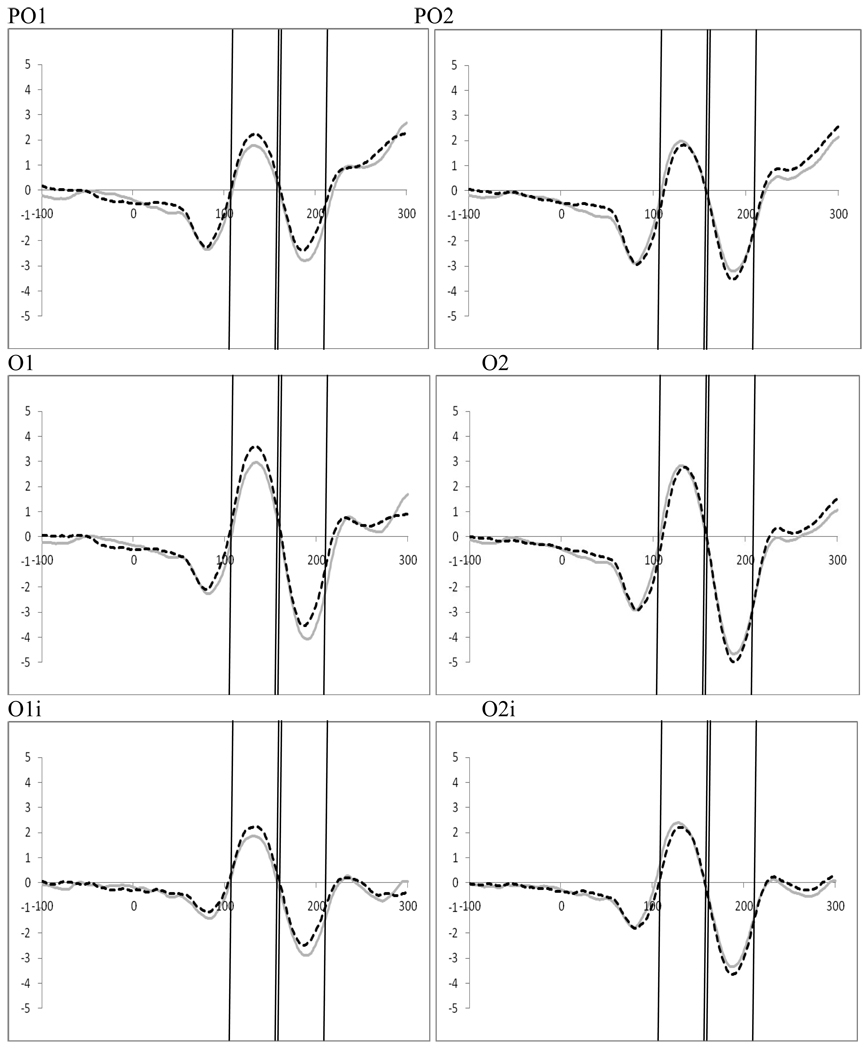
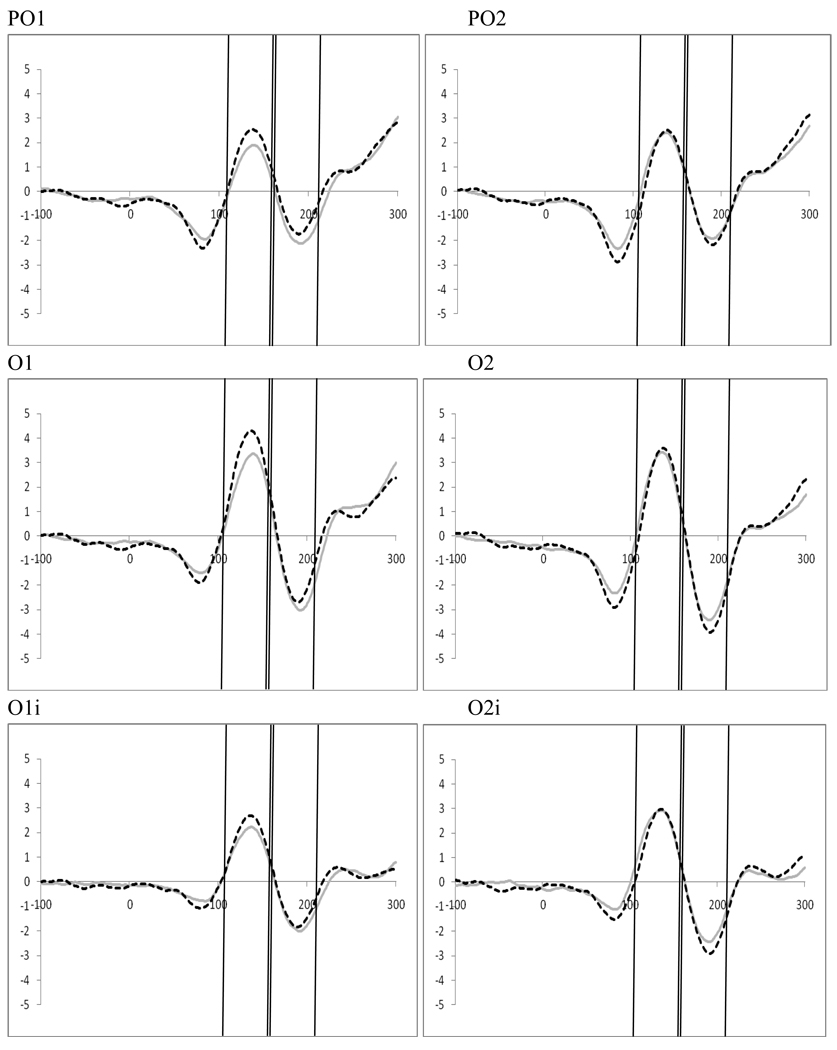
Examination of attention affects were carried out within both the frequent and infrequent distractor epochs for trials containing distractors using 2 (perceptual load; low vs. high) by 2 (direction of attention; left vs. right) by 2 (electrode; left hemisphere vs. right hemisphere) ANOVAs for four electrode pairs, TO1/TO2, O1/O2, O1i/O2i, and PO1/PO2. In the frequent distractor condition we found a significant interaction between hemifield of presentation and electrode for all electrode pairs (TO1/TO2, F(1,19)=8.96, p=.007, ηp2=.320; O1/O2, F(1,19)=10.68, p=.004, ηp2=.360; O1i/O2i, F(1,19)=18.44, p<.001, ηp2=.492; PO1/PO2, F(1,19)=8.92, p=.008, ηp2=.320; see Figure 12). These interactions arise because P1 amplitude is greater over the hemisphere contralateral to the direction of attention, as observed in Experiment 1. This is more pronounced for the T01/T02 scalp sites. There were no affects of perceptual load on processing contralateral to the target in this task.
Figure 12.
Experiment 2. Frequent Distractor Epoch: Effects of distractor frequency on attention showing significant attention effects at P1 and N1 at occipital leads TO1/TO2, O1/O2, O1i/O2i, PO1/PO2 (collapsed across perceptual load).
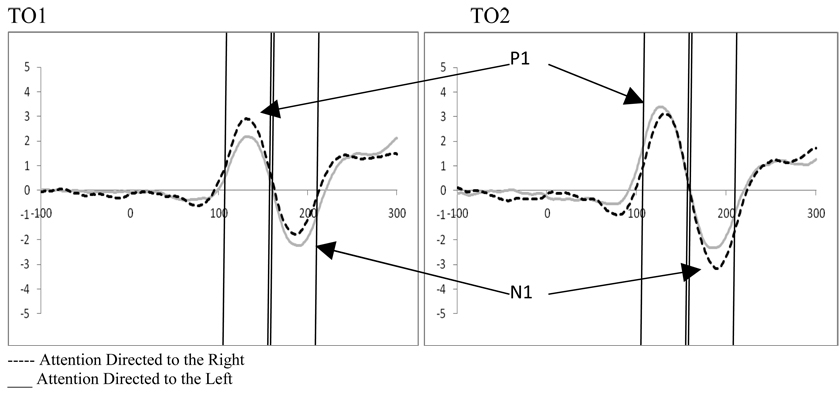
The infrequent distractor epoch also showed a significant interaction between the direction of attention and the electrode site (TO1/TO2, F(1,19)=23.91, p<.001, ηp2=.557; O1/O2, F(1,19)=20.67, p<.001, ηp2=.521; O1i/O2i, F(1,19)=10.94, p=.004, ηp2=.365; PO1/PO2, F(1,19)=17.93, p<.001, ηp2=.486) reflecting greater processing contralateral to the presentation of the target stimulus. Additionally, while effects of distractor frequency were smaller in Experiment 2, the direction of influence of distractor anticipation on attention was the same between frequent and infrequent epochs in Experiment 2 as in Experiment 1 (i.e., when distractors are anticipated, processing contralateral to the direction of attention increases and processing ipsilateral to the direction of attention decreases while the reverse is true when distractors are not anticipated; processing contralateral to the direction of attention decreases and processing ipsilateral to the direction of attention increases, see Figure 14). Again, there were no affects of perceptual load on processing contralateral to target presentation.
Figure 14.
Experiment 2. Effects of distractor anticipation on stimulus processing at P1 for occipital leads (TO1/TO2 representative electrodes with significant effects at P1).
5.6 Stimulus Processing at N1
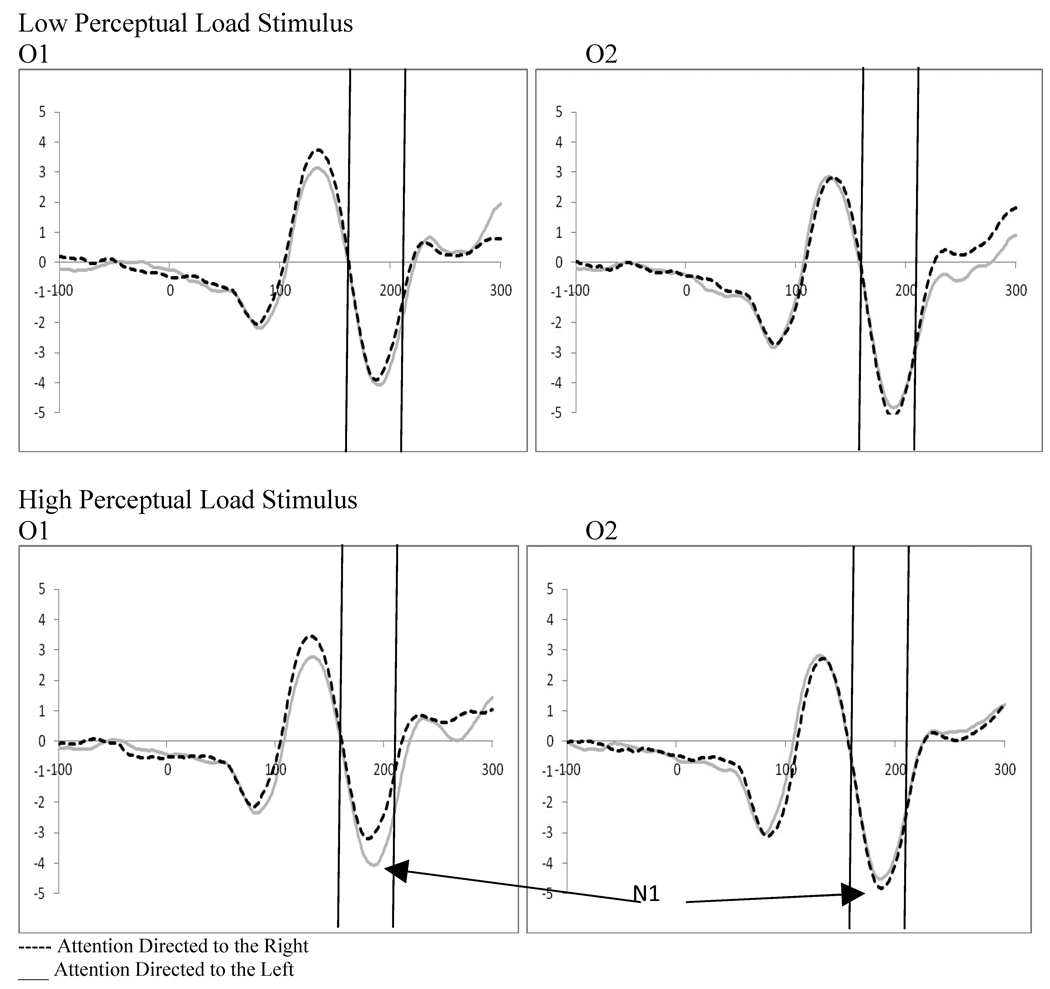
Examination of attention, perceptual load, and distractor anticipation on the N1 were carried out for displays containing distractors using a 2 (distractor frequency: frequent vs. infrequent) by 2 (perceptual load: high vs. low) by 2 (direction of attention: left vs. right) by 2(electrode: left vs. right hemisphere) repeated-measures ANOVA for four electrode pairs (TO1/TO2, O1/O2, O1i/O2i, and PO1/PO2). There was a main effect of electrode for the O1/O2 pair (F(1,19)=6.05, p=.024, ηp2=.224) reflecting greater activity in the left hemisphere. However, the most widespread finding was of an interaction between the direction of attention and electrode reflecting attention effects at the N1 that are a result of attentional changes at the P1 (PO1/PO2, F(1,19)=14.41, p=.001, ηp2=.431; O1/O2, F(1,19)=16.66, p=.002, ηp2=.413; O1i/O2i, F(1,19)=14.83, p=.001, ηp2=.438; TO1/TO2, F(1,19)=15.37, p=.001, ηp2=.447). The only other interactions were in the O1/O2 pair between perceptual load, direction of attention, and electrode (F(1,19)=5.39, p=.031, ηp2=.221) and between distractor frequency, perceptual load, direction of attention and electrode (F(1,19)=5.77, p=.027, ηp2=.233). To better understand these interactions, and explore a priori hypotheses concerning the effects of perceptual load (which may have been masked by effects of distractor frequency), follow-up analyses were conducted.
5.7 Effect of Distractor Anticipation on Stimulus Processing at N1
Examination of attention affects were carried out within both the frequent and infrequent distractor epochs for trials containing distractors using 2 (perceptual load: high vs. low) by 2 (direction of attention: right vs. left) by 2 (electrode: left vs. right hemisphere) ANOVAs for four electrode pairs, TO1/TO2, O1/O2, O1i/O2i, and PO1/PO2 (see Figures 12 and 13).
Figure 13.
Experiment 2. Infrequent Epoch: Effects of Distractor Frequency on Stimulus Processing showing significant attention effects at Occipital Leads TO1/TO2, O1/O2, O1i/O2i, PO1/PO2 (collapsed across perceptual load).
Repeated measures ANOVAs in the frequent distractor condition showed a significant interaction between hemifield of presentation and electrode for all electrode pairs (TO1/TO2, F(1,19)=10.17, p=.005, ηp2=.349; O1/O2, F(1,19)=9.83, p=.005, ηp2=.341; O1i/O2i, F(1,19)=11.54, p=.003, ηp2=.378; PO1/PO2, F(1,19)=8.40, p=.009, ηp2=.307). These interactions reflect an effect of attention at N1 with greater processing contralateral to the direction of attention. Additionally, there was a main effect of electrode in both the O1/O2 and P01/P02 electrode pairs (O1/O2, F(1,19)=6.18, p=.022, ηp2=.245; PO1/PO2, F(1,19)=5.47, p=.03, ηp2=. 223). However, more interestingly, there was a significant interaction between perceptual load and electrode for the TO1/TO2 electrode pair (F(1,19)=6.03, p=.024, ηp2=.241), an interaction between perceptual load, direction of attention, and electrode in the O1/O2 electrode pair (F(1,19)=7.09, p=.015, ηp2=.272), and trend for the same interaction at the PO1/PO2 electrode pair (F(1,19)=3.59, p=.073, ηp2=.159). These interactions reflect a greater attention effect at high perceptual load for the O1/O2 electrode pair, and possibly the PO1/PO2 electrode pair (see Figure 15).
Figure 15.
Experiment 2. Effect of perceptual load on stimulus processing at N1 for occipital leads (O1/O2) showing significant attention effects at high perceptual load.
Repeated measures ANOVAs in the infrequent distractor condition also showed a significant interaction between hemifield of presentation and electrode for all electrode pairs (TO1/TO2, F(1,19)=15.72, p=.001, ηp2=.453; O1/O2, F(1,19)=12.70, p=.002, ηp2=.401; O1i/O2i, F(1,19)=11.02, p=.004, ηp2=.367; PO1/PO2, F(1,19)=15.30, p=.001, ηp2=.446). However, unlike the effects during the frequent distractor epoch, no significant interactions were found with perceptual load in the infrequent distractor epoch.
6. Discussion
As anticipated based on Experiment 1, Experiment 2 showed attention affects in the cue-stimulus interval as well as target facilitation and distractor suppression at stimulus onset. Evidence of preparatory activity prior to stimulus onset was seen in an attention effect at both early (270–320ms) and late (360–460ms) time periods following cue presentation. Moreover, this effect was modified by the frequency of the distractor at F3a and by perceptual load of the target at F3 during the later time period.
Processing enhancement contralateral to the direction of attention (i.e., the location of target presentation) was seen at both the P1 and the N1 regardless of distractor anticipation. Additionally, distractor anticipation modulated processing contralateral to both target and distractor presentation. When distractors were frequently present, processing contralateral to the presentation of target items showed stronger processing at P1, conversely, distractors showed reduced processing when they occurred within a frequent distractor epoch.
Similar to previous studies of perceptual load which have found changes in both target (e.g., Barnhardt et al., 2008; Handy and Mangun, 2000) and distractor processing (e.g., Handy et al., 2001), effects of perceptual load were seen in this task at stimulus onset. This effect was a modulation of attention effects between high compared to low perceptual load at the N1 (for electrodes 01/02). One possibility for why these findings were not seen at additional electrode sites is that affects of perceptual load on stimulus processing exist in other electrodes, but that affects of distractor anticipation were stronger, thus overshadowing perceptual load affects. Secondly, it is possible that the low perceptual load task was not sufficiently different in perceptual load to the high perceptual load task to produce a strong modulation of the N1 despite significant differences in accuracy between low perceptual load and high perceptual load targets.
6.1 General Discussion
It has been hypothesized that top down modulation of selective attention occurs via both selective enhancement of target stimuli and (potentially) inhibition of distractor stimuli (for review see Mangun, 1995; Seiss et al., 2009; Van der Stigchel et al., 2006). However, while an abundance of data supports enhancement of attended stimuli both prior to, and at the onset of target stimuli, evidence for distractor inhibition in relation to target processing has rarely been explored (e.g., Seiss et al., 2009; Van der Stigchel et al., 2006). The purpose of this study was to examine both preparatory activity as well as during stimulus processing to better understand the potential contributions of enhancement and inhibitory processes to attentional selection. Thus our aims were to replicate previous studies’ findings of enhanced processing as a function of selective attention, and to examine how the anticipation (and presence) of a distractor, as well as the level of perceptual load of the target, influenced that processing.
6.1.1 Preparatory Activity
Previous research has examined multiple components related to preparatory attention. Notably the EDAN and ADAN have been thought to reflect the interpretation of the cue and allocation of attention to the cued location. Interestingly, while the cue in Experiment 1 (indicating the presence of a distractor and the target location) did not produce attention affects in early preparatory activity (in a component analogous to the EDAN), the cue in Experiment 2 (indicating the perceptual load of the target and its location) did show modulations in attention. The findings in Experiment 2 cannot be accounted for by stimulus properties of the cue as a control task did not find such effects. However, they also cannot be accounted for by information about perceptual load within the cue as this did not influence attentional effects in early preparatory activity. Thus, the only remaining difference between Experiment 1 and Experiment 2 was the use of a block design in Experiment 2 which may have strengthened attention effects by eliminating the need to change the scope of attention from trial to trial. This suggests that the presence of attentional effects in early preparatory activity can be influenced by the meaning of the cue when the cue contains more than directional information.
In contrast to early preparatory activity, late preparatory activity (in a component analogous to the ADAN) showed similar effects in both experiments. Late preparatory activity showed effects of attention regardless of the secondary meaning of the cue. This supports previous studies which suggest the ADAN is related to activation of frontal areas that control visuospatial attention (e.g., Nobre, Sebestyen, Misiussi, 2000; Seiss, Gherri, Eardley, and Eimer, 2007). Moreover, in both experiments attentional effects were modulated by additional factors. In both experiments the attentional effect was modulated by the future presence of a distractor (as indicated by the cue in Experiment 1 and the epoch type in Experiment 2) supporting recent findings by Seiss et al. (2009) of a greater difference in negatively contralateral to the cued direction when a distractor was anticipated (alternatively viewed as greater activity contralateral to the direction of the distractor and ipsilateral to the cued direction). This effect was present at F7 and F8 in Experiment 1 and F3a in Experiment 2. Importantly F3a in Experiment 2 is very close in location to F7 (sitting on the scalp slightly closer to midline than F7) and thus may reflect a similar origin of processing. Moreover, Experiment 2 also showed the attentional effect in late cue activity may be modulated by perceptual load, as seen in an interaction at F3. These findings suggest that other aspects of the control of visuospatial attention (aside from the location of attention) are processed in frontal areas.
6.1.2 Stimulus Processing
As in previous studies of spatial selective attention (see Mangun 1995 for review), effects of selective attention contralateral to the presentation of target stimuli were found in both Experiment 1 and 2. Specifically, both experiments showed a higher amplitude P1 response over the occipital scalp contralateral to the direction of attention (left vs. right hemifield). Moreover, in both experiments when a distractor was anticipated either by the presence of an informative cue, or by the nature of the epoch (i.e., frequent distractors were present), processing contralateral to the presentation of the attended target was stronger than when a distractor was not anticipated. Additionally, while previous research has examined distractor processing, it rarely looks at inhibition or suppression of distractors (e.g., Van der Stigchel et al., 2006). Moreover, when examined, distractor suppression is often thought of as a secondary effect of attending selectively to relevant targets. In these accounts of distractor processing, enhanced target processing more efficiently competes for representation by counteracting suppressive influences of nearby stimuli (Desimone & Duncan, 1995). However, results from this study suggest that distractors can also be suppressed when competition is not produced within the receptive field of the target item. In this study, effects of distractor suppression were seen at the P1 which has been shown previously to reflect processing in extrastriate cortex (e.g., Heinze et al., 1994; Clark and Hillyard, 1996). Moreover, the suppressive interactions that occur within the exastriate cortex are strongest from nearby stimuli (i.e., within 2–4 degrees; Bles, Schwarzbach, DeWeerd, Goebel, Jansma, 2006; Kastner, De Weerd, Pinsk, Elizondo, Desimone, Ungerlieder, 2001). In contrast, distractor stimuli in this task were presented in different hemifields and were approximately 7.6 degrees from the target stimuli at their closest point (center of target to center of distractor was approximately 9.5 degrees). Thus, it is unlikely that local competitive suppression contributed significantly in this task. However, in both experiments distractor suppression was seen at the P1 when distractors could be anticipated. Importantly this effect was seen both in a trial by trial design (Experiment 1) and a block design (Experiment 2) with effects that were in the opposite direction to those seen contralateral to target presentation. Thus effects are not related to overall changes in the sensitivity of processing, but are determined by the ability to anticipate the presence of a distractor and suggest a top-down biasing of activity related to distractor processing.
Finally, as in previous research, processing contralateral to the presentation of a distractor was influenced by the perceptual load of the target. However, effects were only seen in late activity following the cue in one electrode (F3) and at the N1 in one electrode pair (O1/O2). Possible explanations for the lack of a stronger effect include the overshadowing of perceptual load differences by other effects such as distractor anticipation or insufficient differences between high and low perceptual load targets.
Findings from this study suggest alterations in both cue and stimulus processing as a function of selective attention. Moreover, these effects differ as a function of the presence or absence of a distractor stimulus and may be modulated by perceptual load. While target processing is enhanced by selective attention the effect is reduced when a distractor is present but not anticipated. This mirrors behavioral effects which show facilitation of target processing when distractors are anticipated in comparison to when they are not. Moreover, effects of selective attention can be seen both prior to stimulus onset in late activity following the cue in a time window similar to the ADAN (and under some conditions in the time window of the EDAN) as well as during stimulus processing at the P1. This effect is modulated by the anticipation of a distractor primarily at the P1 although effects during the cue-stimulus interval may be seen in late cue activity. Moreover, perceptual load may also modulate attention effects both prior to stimulus onset during late cue activity as well as during stimulus processing at the N1.
Importantly this study demonstrates that distractor processing is influenced by the ability to anticipate distractor appearance as well as anticipation of perceptual load. Modulations of attention effects late in post-cue activity in combination with reductions in the P1 when the distractor could be anticipated or at the N1 when perceptual load was high, suggest an active process of distractor suppression guided by top-down mechanisms.
7. Experimental Procedures Experiment 1
7.1 Participants
Twenty adult participants, (M= 22.0 years, SD=2.79) participated in the study. Participants were recruited from Hampshire College and paid $10 for each hour of participation for a maximum of $20. Ten males and ten females participated (18 Caucasian, 1 Asian, 1 African American). Based on self report, participants were excluded from participation if they were left handed, had non-correctable visual impairments, diagnosed with learning disorders, currently on psychotropic medications, or born prematurely (i.e., less than 36 weeks).
7.2 Procedures
After completing the consent process, all participants completed questionnaires to obtain demographic information and brief psychological and medical histories. Participants were then prepared for electrophysiological recording by application of the electrodes, whereupon they participated in the selective attention task.
7.3 Stimuli and Task
The paradigm was based on a design used by Hopf, Boelmans, Schoenfeld, Heinze, and Luck (2002). On each task trial, a cue (consisting of a set of two arrows, each arrow a different color, 0.5 × 1.0 degrees of visual angle) was presented for 150 ms followed by a random interstimulus interval of 1000 to 1300 ms, and then the stimulus display for 100 ms. The participant was encouraged to respond by pushing a response button rapidly and accurately – the next trial did not begin until after the subjects responded. The intertrial interval (response to next cue) varied from 200 to 500 ms.
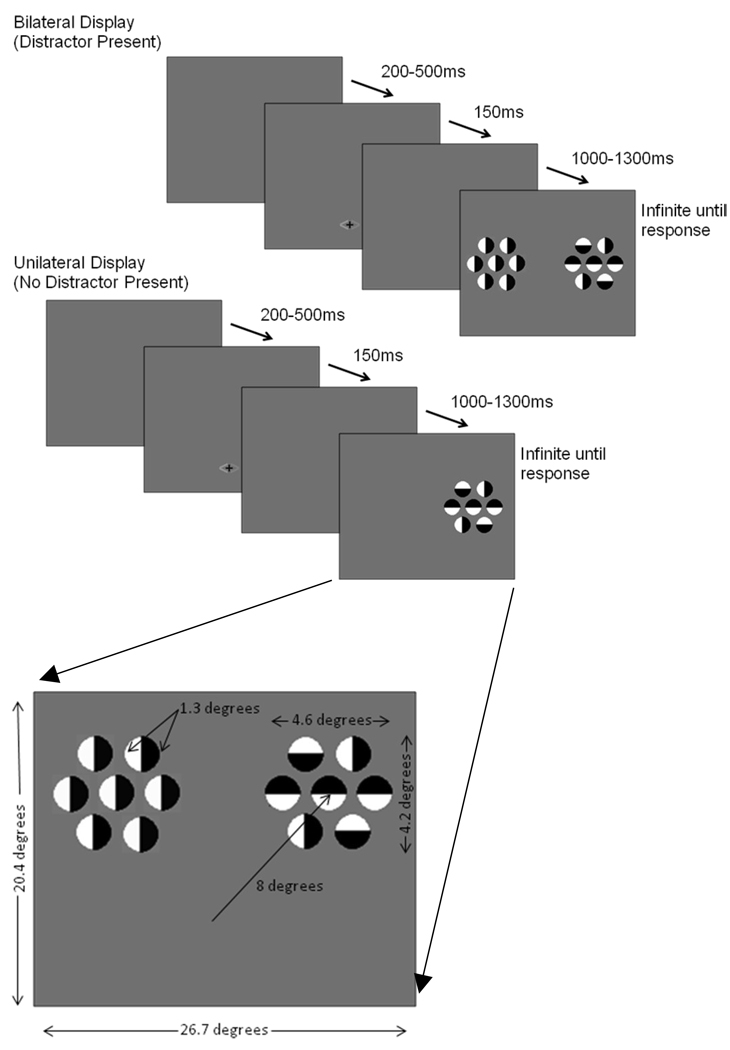
There were two types of target stimulus displays; a unilateral (target only) and a bilateral (target plus distractor) display. The bilateral display consisted of two arrays of seven circular objects each (1.3 degrees for each circle). Each circle was half white and half black and was presented on a gray background that was isoluminant with the space-averaged luminance of the circles (see Figure 1). The circle sets were 8 degrees from fixation measured to the center of the set, and each set subtended 4.6 × 4.2 degrees visual angle. The participant was asked to maintain fixation on a central fixation marker, covertly attend to one side of the display, and indicate using a button press if the center circle of the array was black in the upper half (right mouse button) or in the lower half of the circle (left mouse button). The circles on the unattended side were presented only in a vertical orientation, thus containing no information regarding the correct response. The unilateral display only contained circles on the attended (cued) side of the display. The cue prior to the onset of each display provided two pieces of information. It accurately indicated the hemifield in which the target would appear (probability 1.0), and predicted whether a distractor was likely to appear in the display (probability 0.70). That is, the location of the target, and therefore of covert attention, was correctly signaled by the cue, while the presence of the distractor was probablistically predicted by the cued. The cue arrow was orange on one side and blue or green on the other; the color blue or green indicating both the side of the target and if a distractor would be present.
Figure 1.
Experiment 1. Selective attention task stimulus displays.
Each session consisted of 1000 trials that were presented in blocks of 100 trials each. The experimental session took approximately 1.5 hours including initial set up and debriefing.
7.4 Electrophysiological Methods
Scalp electroencephalograms (EEGs) were recorded using tin electrodes embedded in an elastic cap (Electro-cap International). The 32 electrodes were located at standard sites of the International 5–20 system of electrode placement (e.g., Jurcak et al., 2007) as follows: FZ, FPZ, CZ, CPZ, PZ, OZ, FP1, FP2, F7, F8, F3, F4, FT7, FT8, T7, T8, C3, C4, TP7, TP8, CP3, CP4, P7, P8, P3, P4, O1, O2, HEOG, VEOG. EEG was recorded to a common reference, and then each electrode was algebraically re-referenced off-line to the mean of the left and right mastoid electrodes; impedances were kept below 5k ohms for all participants. The mastoid reference is preferred when using a smaller number of channels because an average reference (mean of recorded electrodes) is not as accurate under such conditions (Handy, 2005). The EEGs were amplified using a Synamps 1 Amplifier at a bandpass of 0.1 to 100 Hz, and digitized at a sampling rate of 500 samples per second. To ensure eye fixation, electrooculograms (EOG) were recorded for both vertical (from an electrode inferior to the left eye) and horizontal (from an electrode on the right outer canthus) eye movements.
7.5 ERP Data Analysis and Reduction
EEGs were sorted into epochs off-line (200 ms pre-stimulus to 600 ms post-stimulus), and artifact-free trials were averaged to yield ERPs for the different cue and stimulus types in the various conditions. The ERPs were baseline corrected using the mean of the 200 ms pre-stimulus period. Artifact rejection involved the automated exclusion of trials if they contained significant ocular artifacts (defined as amplitudes +/− 50 µvolts at vertical or horizontal eye electrodes), muscle, or movement artifacts. Trials were also excluded by hand if they contained excessive alpha activity in more than 3 channels (i.e., 10% of total channels). Channels that were consistently noisy across the experiment were marked as such and not used in analyses. To ensure all trials with artifacts were eliminated, each trial was also visually reviewed. Participants were eliminated from analysis if there were more than 3 noisy channels (Picton et al., 2000), a channel of interest was noisy, or if the participant had less than 50 (distractor cue valid) or 30 (distractor cue invalid) artifact free trials within each condition. These criteria resulted in one subject being eliminated from analyses of cue related activity that involved occipital leads. ERP components of interest were quantified using mean amplitude measures over intervals that captured the component of interest. The same measurement window was used for a given component across all subjects.
Cue-evoked waveforms were computed for each participant for each of the four cue conditions: Distractor Present on Left, Distractor Present on Right, No Distractor Present on Left, No Distractor Present on Right. Statistical analysis of early preparatory activity was based on mean amplitude measured over a 50-msec time window, centered approximately on the peak amplitude of the component seen in the grand-averaged waveforms of the left and right occipital leads O1, O2 from 270–320 ms post-cue (similar to studies of the EDAN). Statistical analysis of late preparatory activity was based on mean amplitude measured over a 100-msec time window, centered approximately on the peak amplitude of the component seen in the grand-averaged waveforms of the left and right frontal leads F7, F8, F3, F4 from 360–460 ms post-cue (similar to studies of the ADAN). Repeated measures ANOVA’s were used to examine both the early and late preparatory activity.
Stimulus-evoked waveforms were computed for each participant for each condition: Distractor Cue Valid to the Left and Right as well as Distractor Cue Invalid to the Left and Right. Quantification of the P1 ERP component was based on mean amplitude measured over a 50-msec time window centered approximately on the peak amplitude of the P1 seen in the grand-averaged waveforms of the left and right occipital leads O1, O2 (100–150 ms post-stimulus). Amplitude data were analyzed at electrodes contralateral to both targets and distractors when a distractor was present using repeated measures ANOVA’s to be consistent with the broader ERP literature. Reaction time and accuracy data were also analyzed using repeated measures ANOVA’s.
8. Experimental Procedures Experiment 2
8.1 Participants
Twenty adult participants, (M= 25.1 SD=5.4) participated in this study. Participants were recruited from the University of California at Davis. Participants were paid $10 for each hour of participation for a maximum of $40. Ten males and 10 females participated (12 Caucasian, 4 Asian, 2 Asian/White, 1 Pacific Islander, and 1 Native American/Alaskan). Based on self report, participants were excluded prior to participation if they were left handed, had non-correctable visual impairments, were diagnosed with or suspected of having learning disorders, were currently on psychotropic medications, or were born prematurely (i.e., less than 36 weeks).
8.2 Procedures
After completing the consent process all participants completed questionnaires addressing demographic information as well as a brief psychological and medical history. Participants were then prepared for electrophysiological recording by application of the electrodes, whereupon they participated in two tasks, first an oddball task (to examine processing to the cue1) and second a modified version of the selective attention task from Experiment 1 where perceptual load was manipulated.
8.3 Stimuli and Task
The selective attention paradigm as well as the timing of cue and stimulus presentation was the same as in Experiment 1 except for the following changes. As in Experiment 1 there were two types of target displays, a unilateral and a bilateral display and the participant was asked to attend to one side of the display and indicate if the center circle was black in the upper half or in the lower half. However, in this task there were two types of target stimuli, high perceptual load stimuli and low perceptual load stimuli. The level of perceptual load of the trial was determined by the surrounding circles for the circles on the attended side. Low perceptual load stimuli consisted of surrounding circles of the same orientation as the center circle and high perceptual load stimuli consisted of surrounding circles of incongruent orientations (as were used in Experiment 1, see Figure 1). As in Experiment 1 the circles on the unattended side were presented only in a vertical orientation, thus with no usable information concerning the correct response. However, in contrast to Experiment 1, the cue did not indicate the presence or absence of a distractor. Instead, participants were presented with two epochs of trials, one in which distractors were frequently present (probability 0.70, i.e., the frequent condition) and one in which distractors appeared infrequently (probability, 0.30, i.e., the infrequent condition). However, the cue prior to the onset of the stimulus still provided two pieces of information. First, it indicated the side of the display to be attended. Second, it provided the level of perceptual load of the target stimulus. The cue accurately predicted the side to be attended (probability 1.0), and predicted the likely perceptual load of the target stimulus (probability 0.70). That is, the location of the target, and therefore of covert attention, was correctly signaled by the cue, while the perceptual load of the target was probablistically predicted by the cued. The cue arrow was orange on one side and blue or green on the other; the color blue or green indicating both the side of the target and the perceptual load of the target stimulus. This was done to provide catch trials that allow the separation of expectations based on the cue and stimulus driven changes in perceptual processing. No information was provided regarding the likelihood of a bilateral versus unilateral display. However, the presence of trials within each epoch that violated expectations (i.e., the presence of a distractor in the epoch in which distractors were infrequent or the reverse) allowed for examination of distractor anticipation similar to the use of invalid distractor cues in Experiment 1.
Each session contained two epochs of 1000 trials that were presented in blocks of 100 trials each. One epoch contained frequent distractors and the other contained infrequent distractors. The two epochs were counterbalanced for participants. Each epoch took approximately 40 minutes for a total session of approximately 2.5 hours including initial set up and debriefing.
8.4 Electrophysiological Methods
Scalp electroencephalograms (EEGs) were recorded from 62 tin electrodes sewn into an elastic cap (Electro-cap International): FPZ, FZ, FCZ, CZ, CPZ, PZ, POZ, OZ, INZ, FP1, FP2, F7, F8, F3a, F4a, F3, F4, F7p, F8p, F3i, F4i, C3a, C4a, C3, C4, FC1, FC2, PA1, PA2, C5, C6, C1a, C2a, T3, T4, C1p, C2p, C5p, C6p, P3a, P4a, P1, P2, P3i, P4i, PO1, PO2, O1, O2, T3i, T4i, TO1, TO2, T1i, T2i, O1i, O2i, I1, I2, HEOGL, HEOGR, LVEOG. Electrodes were re-referenced as in Experiment 1 and impedances were kept below 5k ohms. The EEG’s were amplified using a Synamps 2 Amplifier with the same bandpass filter and sampling rate as in Experiment 1. Additionally, electrooculogram’s (EOG) were recorded as in Experiment 1.
8.5 Data Analysis and Reduction
EEGs were sorted into epochs off-line (200 ms pre-cue to 1000 ms post-cue and 200 ms pre-stimulus to 1000 ms post-stimulus), and artifact-free trials were averaged to yield ERPs for the different cue and stimulus types in the various conditions. The ERPs were baseline corrected using the mean of the 200 ms pre-stimulus period. Artifact rejection involved the automated exclusion of trials if they contained significant ocular artifacts (defined as amplitudes +/− 50 µvolts at vertical or horizontal eye electrodes), or muscle or movement artifacts. Trials were also excluded by hand if they contained excessive alpha activity in more than 10% of channels. Channels that were consistently bad across the experiment were marked as such and not used in analyses. To ensure all trials with artifacts were eliminated, each trial was also visually reviewed. Participants were eliminated from analyses if 10% or more channels were bad (Picton et al., 2000) or had less than 40 artifact free trials in any of the analyzed conditions. ERP components of interest were quantified using mean amplitude measures over intervals that captured the component. The same measurement window was used for a given component across all subjects.
Cue-evoked waveforms were computed for each participant for the modified selective attention task for each of the four cue conditions directing attention to each side of the display: Frequent Epoch High Load, Frequent Epoch Low Load, Infrequent Epoch High Load, and Infrequent Epoch Low Load. Statistical analysis of early preparatory activity was based on mean amplitude measured over a 50-msec time window, centered approximately on the peak amplitude of the early component seen in the grand-averaged waveforms of the left and right occipital leads O1i, O2i (270–320 ms post-cue, similar to the EDAN). Statistical analysis of late preparatory activity was based on the mean amplitude measured over a 100-msec time window, centered approximately on the peak amplitude of the component seen in the grand-averaged waveforms of the left and right frontal leads F3a and F4a (360–460 ms post-cue, similar to the ADAN). One participant’s data was not included in analyses of late cue activity as several frontal electrodes (F4a, F4, F8) contained significant noise. Repeated measures ANOVAs were used to examine the early and late preparatory activity.
In addition to cue grand averages, grand-average waveforms to stimulus displays for each participant for each of the four conditions were created: Frequent Epoch High Load, Frequent Epoch Low Load, Infrequent Epoch High Load, and Infrequent Epoch Low Load. Statistical analysis of P1 data was based on the mean amplitude measured over a 50-msec time window, centered approximately on the peak amplitude of the P1 seen in the grand-averaged waveforms of the left and right occipital leads TO1,TO2, O1, O2, O1i, O2i, PO1, and PO2 (110–160 ms post-stimulus). Statistical analysis of N1 data was based on mean amplitude measured over a 50-msec time window, centered approximately on the peak amplitude of the N1 seen in the grand-averaged waveforms of the left and right occipital leads TO1, TO2, O1, O2, O1i, O2i, PO1, and PO2 (165–215 ms post-stimulus). Data were analyzed using repeated measures ANOVA’s to be consistent with the broader ERP literature. Additionally reaction time and accuracy data were also analyzed using repeated measures ANOVAs.
Acknowledgements
This work was supported by grant MH057714 to G.R.M. and a Hampshire College Keck Grant to J.W.C. Thanks to Sharon Corina for valuable assistance, and to Chris Blais for helpful comments.
Footnotes
Publisher's Disclaimer: This is a PDF file of an unedited manuscript that has been accepted for publication. As a service to our customers we are providing this early version of the manuscript. The manuscript will undergo copyediting, typesetting, and review of the resulting proof before it is published in its final citable form. Please note that during the production process errors may be discovered which could affect the content, and all legal disclaimers that apply to the journal pertain.
The oddball task consisted of stimuli that were the same as the cues used in the selective attention task. The oddball was created by introducing a red arrow within 20% of the stimuli to which participants were asked to respond. Analysis of P1 and N1 responses to the non-target stimuli (ie cue stimuli) showed no significant differences in processing (p’s>.05).
Contributor Information
J. W. Couperus, School of Cognitive Science, Hampshire College, Amherst, MA
G.R. Mangun, Center for Mind and Brain and Departments of Psychology and Neurology, University of California at Davis, Davis, CA
References
- Awh E, Matsukura M, Serences JT. Top-Down Control Over Biased Competition During Covert Spatial Orienting. Journal of Experimental Psychology: Human Perception and Performance. 2003;29(1):52–63. doi: 10.1037//0096-1523.29.1.52. DOI: 10.1037/0096-1523.29.1.52. [DOI] [PubMed] [Google Scholar]
- Barnhardt J, Ritter W, Gomes H. Perceptual load affects spatial and nonspatial visual selection processes: An event-related potential study. Neuropsychologia. 2008;46:2071–2078. doi: 10.1016/j.neuropsychologia.2008.02.007. DOI: 10.1016/j.neuropsychologia.2008.02.007. [DOI] [PubMed] [Google Scholar]
- Beck D, M, Kastner S. Top-down and bottom-up mechanisms in biasing competition in the human brain. Vision Research. 2009;49:1154–1165. doi: 10.1016/j.visres.2008.07.012. DOI: 10.1016/j.visres.2008.07.012. [DOI] [PMC free article] [PubMed] [Google Scholar]
- Bles M, Schwarzbach J, De Weerd P, Goebel R, Jansma BM. Receptive field size-dependent attention effects in simultaneously presented stimulus displays. NeuroImage. 2006;30(2):506–511. doi: 10.1016/j.neuroimage.2005.09.042. DOI: 10.1016/j.neuroimage.2005.09.042. [DOI] [PubMed] [Google Scholar]
- Braithwaite JJ, Humphreys GW, Hulleman J. Color-based grouping and inhibition in visual search: Evidence from a probe detection analysis of preview search. Perception and Psychophysics. 2005;67(1):81–101. doi: 10.3758/bf03195014. [DOI] [PubMed] [Google Scholar]
- Caputo G, Guerra S. Attentional selection by distractor suppression. Vision Research. 1998;38(5):669–689. doi: 10.1016/s0042-6989(97)00189-2. DOI: 10.1016/S0042-6989(97)00189-2. [DOI] [PubMed] [Google Scholar]
- Clark VP, Hillyard SA. Spatial selective attention affects early estrastriate but not striate components of visual evoked potential. Journal of Cognitive Neuroscience. 1996;8(5):387–402. doi: 10.1162/jocn.1996.8.5.387. [DOI] [PubMed] [Google Scholar]
- Couperus JW. Implicit learning modulates selective attention at sensory levels of perceptual processing. Attention, Perception, and Psychophysics. 2009;71(2):342–351. doi: 10.3758/APP.71.2.342. DOI: 10.3758/APP.71.2.342. [DOI] [PubMed] [Google Scholar]
- Dale CL, Simpson GV, Foxe JJ, Luks TL, Worden MS. ERP correlates of anticipatory attention: spatial and non-spatial specificity and relation to subsequent selective attention. Experimental Brain Research. 2008;188:45–62. doi: 10.1007/s00221-008-1338-4. DOI: 10.1007/s00221-008-1338-4. [DOI] [PubMed] [Google Scholar]
- Delorme A, Makeig S. EEGLAB: an open source toolbox for analysis of single-trial EEG dynamics including independent component analysis. Journal of Neuroscience Methods. 2004:9–21. doi: 10.1016/j.jneumeth.2003.10.009. DOI: 10.1016/j.jneumeth.2003.10.009. [DOI] [PubMed] [Google Scholar]
- Desimone R, Duncan J. Neural mechanisms of selective visual attention. Annual Review of Neuroscience. 1995;18:193–222. doi: 10.1146/annurev.ne.18.030195.001205. DOI: 10.1146/annurev.ne.18.030195.001205. [DOI] [PubMed] [Google Scholar]
- Di Russo F, Martinez A, Hillyard SA. Source analysis of event-related cortical activity during visuo-spatial attention. Cerebral Cortex. 2003;13:486–499. doi: 10.1093/cercor/13.5.486. DOI: 10.1093/cercor/13.5.486. [DOI] [PubMed] [Google Scholar]
- Duncan J. Cooperating brain systems in selective perception and action. In: Inui T, McClelland JL, editors. Attention and performance XVI. Cambridge: The MIT Press; 1996. pp. 549–578. [Google Scholar]
- Eimer M, van Velzen J, Driver J. Cross-modal interactions between audition, touch, and vision in endogenous spatial attention: ERP evidence on preparatory states and sensory modulations. Journal of Cognitive Neuroscience. 2002;14(2):254–271. doi: 10.1162/089892902317236885. DOI: 10.1162/089892902317236885. [DOI] [PubMed] [Google Scholar]
- Ergenoglu T, Demiralp T, Bayraktaroglu Z, Ergen M, Beydagi H, Uresin Y. Alpha rhythm of the EEG modulates visual detection performance in humans. Cognitive Brain Research. 2004;20:376–383. doi: 10.1016/j.cogbrainres.2004.03.009. DOI: 10.1016/j.cogbrainres.2004.03.009. [DOI] [PubMed] [Google Scholar]
- Fu S, Zinni M, Squire PN, Kumar R, Caggiano DM, Parasuraman R. When and where perceptual load interacts with voluntary visuospatial attention: An event-related potential and dipole modeling study. NeuroImage. 2008;39:1345–1355. doi: 10.1016/j.neuroimage.2007.09.068. [DOI] [PubMed] [Google Scholar]
- Geng JJ, Eger E, Ruff CC, Kristjansson A, Rotshtein P, Driver J. On-line attentional selection from competing stimuli in opposite visual fields: Effects on human visual cortex and control processes. Journal of Neurophysiology. 2006;96:2601–2612. doi: 10.1152/jn.01245.2005. DOI: 10.1152/jn. 01245.2005. [DOI] [PubMed] [Google Scholar]
- Giesbrecht B, Woldorff MG, Song AW, Mangun GR. Neural mechanisms of top-down control during spatial and feature attention. NeuroImage. 2003;19:496–512. doi: 10.1016/s1053-8119(03)00162-9. DOI: 10.1016/S1053-8119(03)00162-9. [DOI] [PubMed] [Google Scholar]
- Green JJ, McDonald JJ. An event-related potential study of supramodal attentional control and crossmodal attention effects. Psychophysiology. 2006;43(2):161–171. doi: 10.1111/j.1469-8986.2006.00394.x. DOI: 10.1111/j. 1469-8986.2006.00394.x. [DOI] [PubMed] [Google Scholar]
- Handy TC. Event-Related Potentials: A Methods Handbook. Cambridge MA: MIT Press; 2005. [Google Scholar]
- Handy TC, Khoe W. Attention and sensory gain control: A peripheral visual process? Journal of Cognitive Neuroscience. 2005;17(12):1936–1949. doi: 10.1162/089892905775008715. DOI: 10.1162/089892905775008715. [DOI] [PubMed] [Google Scholar]
- Handy TC, Mangun GR. Attention and spatial selection: Electrophysiological evidence for modulation by perceptual load. Perception and Psychophysics. 2000;62(1):175–186. doi: 10.3758/bf03212070. [DOI] [PubMed] [Google Scholar]
- Handy TC, Soltani M, Mangun GR. Perceptual load and visuocortical processing: Event-related potentials reveal sensory-level selection. Psychological Science. 2001;12(3):213–218. doi: 10.1111/1467-9280.00338. DOI: 10.1111/1467-9280.00338. [DOI] [PubMed] [Google Scholar]
- Harter RM, Anllo-Vento L. Visual-spatial attention: preparation and selection in children and adults. Electroencephalography and Clinical Neurophysiology Supplement. 1991;42:183–194. [PubMed] [Google Scholar]
- Hay JL, Milders MM, Niedeggen M. The effect of perceptual load on attentional-induced motion blindness: The efficiency of selective inhibition. Journal of Experimental Psychology: Human Perception and Performance. 2006;32(4):885–907. doi: 10.1037/0096-1523.32.4.885. DOI: 10.1037/0096-1523.32.4.885. [DOI] [PubMed] [Google Scholar]
- Hillyard SA, Anllo-Vento L. Event-related brain potentials in the study of visual selective attention. Proceedings of the National Academy of Sciences of the United States of America. 1998;95:781–787. doi: 10.1073/pnas.95.3.781. DOI: 10.1073/pnas.95.3.781. [DOI] [PMC free article] [PubMed] [Google Scholar]
- Hillyard SA, Mangun GR. Sensory gating as a physiological mechanism for visual selective attention. In: Johnson R Jr, Rohrbaugh JW, Parasuraman R, editors. Current Trends in Event-Related Potential Research. Amsterdam: Elsevier; 1987. pp. 61–67. [PubMed] [Google Scholar]
- Hillyard SA, Vogel EK, Luck SJ. Sensory gain control (amplification) as a mechanism of selective attention: electrophysiological and neuroimaging evidence. Philosophical Transactions of the Royal Socieity of London B. 1998;353:1257–1270. doi: 10.1098/rstb.1998.0281. [DOI] [PMC free article] [PubMed] [Google Scholar]
- Hopf J-M, Boehler CN, Luck SJ, Tsotsos JK, Heinze H-J, Schoenfeld MA. Direct neurophysiological evidence for spatial suppression surrounding the focus of attention in vision. Proceedings of the National Academy of Sciences. 2006;103(4):1053–1058. doi: 10.1073/pnas.0507746103. DOI: 10.1073/pnas. 0507746103. [DOI] [PMC free article] [PubMed] [Google Scholar]
- Hopf J-M, Boelmans K, Schoenfeld AM, Heinze H-J, Luck SJ. How does attention attenuate target-distractor interference in vision? Evidence from magnetoencephalographic recordings. Cognitive Brain Research. 2002;15:17–29. doi: 10.1016/s0926-6410(02)00213-6. DOI: 10.1016/S0926-6410(02)00213-6. [DOI] [PubMed] [Google Scholar]
- Hopf J-M, Luck SJ, Boelmans K, Schoenfeld MA, Boehler CN, Rieger J, Heinze H-J. The neural site of attention matches the spatial scale of perception. The Journal of Neuroscience. 2006;26(13):3532–3540. doi: 10.1523/JNEUROSCI.4510-05.2006. DOI: 10.1523/JNEUROSCI.4510-05.2006. [DOI] [PMC free article] [PubMed] [Google Scholar]
- Hopf J-M, Mangun GR. Shifting visual attention in space: An electrophysiological analysis using high spatial resolution mapping. Clinical Neurophysiology. 2000;111(7):1241–1257. doi: 10.1016/s1388-2457(00)00313-8. DOI: 10.1016/S1388-2457(00)00313-8. [DOI] [PubMed] [Google Scholar]
- Hopfinger JB, Buonocore MH, Mangun GR. The neural mechanisms of top-down attentional control. Nature Neuroscience. 2000;3(3):284–291. doi: 10.1038/72999. DOI: 10.1038/72999. [DOI] [PubMed] [Google Scholar]
- Hopfinger JB, Maxwell JS. Appearing and disappearing stimuli trigger a reflexive modulation of visual cortical activity. Cognitive Brain Research. 2005;25(1):48–56. doi: 10.1016/j.cogbrainres.2005.04.010. DOI: 10.1016/j.cogbrainres.2005.04.010. [DOI] [PubMed] [Google Scholar]
- Hopfinger JB, Woldorff MG, Fletcher EM, Mangun GR. Dissociating top-down attentional control from selective perception and action. Neuropsychologia. 2001;39:1277–1291. doi: 10.1016/s0028-3932(01)00117-8. DOI: 10.1016/S0028-3932(01)00117-8. [DOI] [PubMed] [Google Scholar]
- Jongen EMM, Smulders FTY, Van der Heiden JSH. Lateralized ERP components related to spatial orienting: Discriminating the direction of attention from processing sensory aspects of the cue. Psychophysiology. 2007;44:968–986. doi: 10.1111/j.1469-8986.2007.00557.x. DOI: 10.1111/j.1469-8986.2007.00557.x. [DOI] [PubMed] [Google Scholar]
- Jurcak V, Tsuzuki D, Dan I. 10/20, 10/10, and 10/5 systems revisited: Their validity as relative head-surface-based positioning systems. NeuroImage. 2007;34:1600–1611. doi: 10.1016/j.neuroimage.2006.09.024. DOI: 10.1016/j.neuroimage.2006.09.024. [DOI] [PubMed] [Google Scholar]
- Kastner S, De Weerd P, Pinsk MA, Elizondo MI, Desimone R, Ungerleider LG. Modulation of sensory suppression: Implications for receptive field sizes in the human visual cortex. Journal of Neurophysiology. 2001;86(3):1398–1411. doi: 10.1152/jn.2001.86.3.1398. [DOI] [PubMed] [Google Scholar]
- Kastner S, Pinsk MA, De Weerd P, Desimone R, Ungerleider LG. Increased activity in human visual cortex during directed attention in the absence of visual stimulation. Neuron. 1999;22(4):751–761. doi: 10.1016/s0896-6273(00)80734-5. DOI: 10.1016/S0896-6273(00)80734-5. [DOI] [PubMed] [Google Scholar]
- Kelly SP, Lalor EC, Reilly RB, Foxe JJ. Increases in alpha oscillatory power reflect an active retinotopic mechanism for distractor suppression during sustained visual attention. Journal of Neurophysiology. 2006;95:3844–3851. doi: 10.1152/jn.01234.2005. DOI: 10.1152/jn.01234.2005. [DOI] [PubMed] [Google Scholar]
- Lai G, Mangels JA. Cueing effects on semantic and perceptual categorization: ERPs reveal differential effects of validity as a function of processing stage. Neuropsychologia. 2007;45(9):2038–2050. doi: 10.1016/j.neuropsychologia.2007.02.013. DOI: 10.1016/j.neuropsychologia.2007.02.013. [DOI] [PMC free article] [PubMed] [Google Scholar]
- Lange JJ, Wijers AA, Mulder LJM, Muler G. Color selection and location selection in ERPs: Differences, similarities and ‘neural specificity.’. Biological Psychology. 1998;48(2):153–182. doi: 10.1016/s0301-0511(98)00011-8. DOI: 10.1016/S0301-0511(98)00011-8. [DOI] [PubMed] [Google Scholar]
- Lavie N. Perceptual load as a necessary condition for selective attention. Journal of Experimental Psychology: Human Perception and Performance. 1995;21(3):451–468. doi: 10.1037//0096-1523.21.3.451. DOI: 10.1037/0096-1523.21.3.451. [DOI] [PubMed] [Google Scholar]
- Lavie N, Cox S. On the efficiency of visual selective attention: efficient visual search leads to inefficient distractor rejection. Psychological Science. 1997;8(5):395–398. DOI: 10.1111/j. 1467-9280.1997.tb00432.x. [Google Scholar]
- Lavie N, Hirst A, de Fockert JW, Viding E. Load theory of selective attention and cognitive control. Journal of Experimental Psychology: General. 2004;133(3):339–354. doi: 10.1037/0096-3445.133.3.339. DOI: 10.1037/0096-3445.133.3.339. [DOI] [PubMed] [Google Scholar]
- Lee J, Maunsell JHR. A Normalization Model of Attentional Modulation of Single Unit Responses. PLoS ONE. 2009;4(2):e4651. doi: 10.1371/journal.pone.0004651. doi:10.1371/journal.pone.0004651. [DOI] [PMC free article] [PubMed] [Google Scholar]
- Luck SJ, Vecera SP. Attention. In: Pashler H, Yantis S, editors. Handbook of Experimental Psychology (3rd ed). Vol. 1: Sensation and Perception. Hoboken, NJ: John Wiley & Sons; 2002. pp. 235–286. [Google Scholar]
- Luks TL, Simpson GV. Preparatory deployment of attention to motion activates higher-order motion-processing brain regions. NeuroImage. 2004;22(4):1515–1522. doi: 10.1016/j.neuroimage.2004.04.008. DOI: 10.1016/j.neuroimage.2004.04.008. [DOI] [PubMed] [Google Scholar]
- Mangun GR. Neural mechanisms of visual selective attention. Psychophysiology. 1995;32:4–18. doi: 10.1111/j.1469-8986.1995.tb03400.x. DOI: 10.1111/j.1469-8986.1995.tb03400.x. [DOI] [PubMed] [Google Scholar]
- Mangun GR, Fannon SP. Attention: Control in the visual cortex. Current Biology. 2007;17(5):R170–R172. doi: 10.1016/j.cub.2006.12.028. DOI: 10.1016/j.cub.2006.12.028. [DOI] [PubMed] [Google Scholar]
- Mangun GR, Hillyard SA. Modulations of sensory-evoked brain potentials indicate changes in perceptual processing during visual-spatial priming. Journal of Experimental Psychology: Human Perception and Performance. 1991;17(4):1057–1074. doi: 10.1037//0096-1523.17.4.1057. DOI: 10.1037/0096-1523.17.4.1057. [DOI] [PubMed] [Google Scholar]
- Müller HJ, Findlay JM. The effect of visual attention on peripheral discrimination thresholds in single and multiple element displays. Acta Psychologica. 1988;69(2):129–155. doi: 10.1016/0001-6918(88)90003-0. DOI: 10.1016/0001-6918(88)90003-0. [DOI] [PubMed] [Google Scholar]
- Müller HJ, Rabbitt PM. Spatial cueing and the relation between the accuracy of ‘where’ and ‘what’ decisions in visual search. The Quarterly Journal of Experimental Psychology A: Human Experimental Psychology. 1989;41(4-A):747–773. doi: 10.1080/14640748908402392. [DOI] [PubMed] [Google Scholar]
- Müller M, Hillyard S. Concurrent recording of steady-state and transient event-related potentials as indices of visual-spatial selective attention. Clinical Neurophysiology. 2000;111(9):1544–1552. doi: 10.1016/s1388-2457(00)00371-0. DOI: 10.1016/S1388-2457(00)00371-0. [DOI] [PubMed] [Google Scholar]
- Navalpakkam V, Itti L. Modeling the influence of task on attention. Vision Research. 2005;45(2):205–231. doi: 10.1016/j.visres.2004.07.042. DOI: 10.1016/j.visres.2004.07.042. [DOI] [PubMed] [Google Scholar]
- Nobre AC, Sebestyen GN, Miniussi C. The dynamics of shifting visuospatial attention revealed by event-related potentials. Neuropsychologia. 2000;38(7):964–974. doi: 10.1016/s0028-3932(00)00015-4. DOI: 10.1016/S0028-3932(00)00015-4. [DOI] [PubMed] [Google Scholar]
- Picton TW, Bentin S, Berg P, Donchin E, Hillyard SA, Johnson R, Jr, Miller GA, Ritter W, Ruchkin DS, Rugg MD, Taylor MJ. Guidelines for using human event-related potentials to study cognition: Recording standards and publication criteria. Psychophysiology. 2000;37:127–152. DOI: 10.1017/S0048577200000305. [PubMed] [Google Scholar]
- Posner MI. Cognitive Neuroscience of Attention. New York, NY: The Guilford Press; 2004. [Google Scholar]
- Ruff CC, Driver J. Attentional preparation for a lateralized visual distractor: Behavioral and fMRI evidence. Journal of Cognitive Neuroscience. 2006;18(4):522–538. doi: 10.1162/jocn.2006.18.4.522. DOI: 10.1162/jocn. 2006.18.4.522. [DOI] [PubMed] [Google Scholar]
- Seiss E, Driver J, Eimer M. Effects of attentional filtering demands on preparatory ERPs eleicited in a spatial cueing task. Clinical Neurophysiology. 2009;120:1087–1095. doi: 10.1016/j.clinph.2009.03.016. DOI: 10.1016/j.clinph.2009.03.016. [DOI] [PubMed] [Google Scholar]
- Seiss E, Gherri E, Eardley AF, Eimer M. Do ERP components triggered during attentional orienting represent supramodal attentional control? Psychophysiology. 2007;44(6):987–990. doi: 10.1111/j.1469-8986.2007.00591.x. DOI: 10.1111/j.1469-8986.2007.00591.x. [DOI] [PMC free article] [PubMed] [Google Scholar]
- Serences JT, Yantis S, Culberson A, Awh E. Preparatory activity in visual cortex indexes distractor suppression during covert spatial orienting. Journal of Neurophysiology. 2004;92:3538–3545. doi: 10.1152/jn.00435.2004. DOI: 10.1152/jn.00435.2004. [DOI] [PubMed] [Google Scholar]
- Simpson GV, Dale CL, Luks TL, Miller WL, Ritter W, Foxe W. Rapid targeting followed by sustained deployment of visual spatial attention. Neuroreport: For Rapid Communication of Neuroscience Research. 2006;17(15):1595–1599. doi: 10.1097/01.wnr.0000236858.78339.52. DOI: 10.1097/01.wnr. 0000236858.78339.52. [DOI] [PubMed] [Google Scholar]
- Slotnick SD, Schwarzbach J, Yantis S. Attentional inhibition of visual processing in human striate and extrastriate cortex. Neuroimage. 2003;19:1602–1611. doi: 10.1016/s1053-8119(03)00187-3. DOI: 10.1016/S1053-8119(03)00187-3. [DOI] [PubMed] [Google Scholar]
- Spencer KD, Dien J, Donchin E. Spatiotemporal analysis of the late ERP responses to deviant stimuli. Psychophysiology. 2001;38(2):343–358. DOI: 10.1017/S0048577201000324. [PubMed] [Google Scholar]
- Sreenivasan KK, Jha AP. Selective attention supports working memory maintenance by modulating perceptual processing of distractors. Journal of Cognitive Neuroscience. 2007;19(1):32–41. doi: 10.1162/jocn.2007.19.1.32. DOI: 10.1162/jocn.2007.19.1.32. [DOI] [PubMed] [Google Scholar]
- Talsma D, Mulckhuyse M, Slagter HA, Theeuwes J. Faster, more intense! The relation between electrophysiological reflections of attentional orienting, sensory gain control, and speed of responding. Brain Research. 2007;1178:92–105. doi: 10.1016/j.brainres.2007.07.099. DOI: 10.1016/j.brainres.2007.07.099. [DOI] [PubMed] [Google Scholar]
- Talsma D, Slagter HA, Nieuwenhuis S, Hage J, Kok A. The orienting of visuospatial attention: An event-related brain potential study. Cognitive Brain Research. 2005;25:117–129. doi: 10.1016/j.cogbrainres.2005.04.013. DOI: 10.1016/j.cogbrainres.2005.04.013. [DOI] [PubMed] [Google Scholar]
- Thut G, Nietzel A, Brandt SA, Pascual-Leone A. A-Band electroencephalographic activity over occipital cortex indexes visuospatial attention bias and predicts visual target detection. The Journal of Neuroscience. 2006;26(37):9494–9502. doi: 10.1523/JNEUROSCI.0875-06.2006. DOI: 10.1523/JNEUROSCI. 0875-06.2006. [DOI] [PMC free article] [PubMed] [Google Scholar]
- Theeuwes J, Kramer A, Belopolsky AV. Attentional sets interacts with perceptual load in visual search. Psychonomic Bulletin and Review. 2004;11(4):697–702. doi: 10.3758/bf03196622. [DOI] [PubMed] [Google Scholar]
- Tipper SP, Rafal R, Reuter-Lorenz PA, Starrveldt Yl, Ro T, Egly R, Danzinger S, Weaver B. Object-based facilitation and inhibition from visual orienting in the human split-brain. Journal of Experimental Psychology: Human Perception and Performance. 1997;23(5):1522–1532. doi: 10.1037//0096-1523.23.5.1522. DOI: 10.1037/0096-1523.23.5.1522. [DOI] [PubMed] [Google Scholar]
- Torralbo A, Beck DM. Perceptual-load-induced selection as a result of local competitive interactions in visual cortex. Psychological Science. 2008;19(10):1045–1050. doi: 10.1111/j.1467-9280.2008.02197.x. DOI: 10.1111/j. 1467-9280.2008.02197.x. [DOI] [PMC free article] [PubMed] [Google Scholar]
- Van der Stigchel S, Heslenfeld DJ, Theeuwes J. An ERP study of preparatory and inhibitory mechanisms in a cued saccade task. Brain Research. 2006;1105:32–45. doi: 10.1016/j.brainres.2006.02.089. DOI: 10.1016/j.brainres.2006.02.089. [DOI] [PubMed] [Google Scholar]
- Worden MS, Foxe JJ, Wang N, Simpson GV. Anticipatory biasing of visuospatial attention indexed by retinotopically specific α-band electroencephalography increases over occipital cortex. The Journal of Neuroscience. 2000;20:RC63. doi: 10.1523/JNEUROSCI.20-06-j0002.2000. [DOI] [PMC free article] [PubMed] [Google Scholar]
- Yamagishi M, Goda N, Callan DE, Anderson SJ, Kawato M. Attentional shifts towards and expected visual target alter the level of alpha-band oscillatory activity in the human calcarine cortex. Cognitive Brain Research. 2005;25:799–809. doi: 10.1016/j.cogbrainres.2005.09.006. DOI: 10.1016/j.cogbrainres. 2005.09.006. [DOI] [PubMed] [Google Scholar]
- Yamaguchi S, Tsuchiya H, Kobayashi S. Electroencephalographic activity associated with shifts of visuospatial attention. Brain: A Journal of Neurology. 1994;117(3):553–562. doi: 10.1093/brain/117.3.553. DOI: 10.1093/brain/117.3.553. [DOI] [PubMed] [Google Scholar]


