

SUMMARY
The standard in genetic association studies of complex diseases is replication and validation of positive results, with an emphasis on assessing the predictive value of associations. In response to this need, a number of analytical approaches have been developed to identify predictive models that account for complex genetic etiologies. Multifactor Dimensionality Reduction (MDR) is a commonly used, highly successful method designed to evaluate potential gene-gene interactions. MDR relies on classification error in a cross-validation framework to rank and evaluate potentially predictive models. Previous work has demonstrated the high power of MDR, but has not considered the accuracy and variance of the MDR prediction error estimate. Currently, we evaluate the bias and variance of the MDR error estimate as both a retrospective and prospective estimator and show that MDR can both underestimate and overestimate error. We argue that a prospective error estimate is necessary if MDR models are used for prediction, and propose a bootstrap resampling estimate, integrating population prevalence, to accurately estimate prospective error. We demonstrate that this bootstrap estimate is preferable for prediction to the error estimate currently produced by MDR. While demonstrated with MDR, the proposed estimation is applicable to all data-mining methods that use similar estimates.
Keywords: epistasis, gene-gene interaction, retrospective and prospective sampling, prediction error, bias, variance
INTRODUCTION
A primary focus of genetic epidemiology is the identification of genetic risk factors for disease. In recent years, many studies have focused on characterizing the genetic architecture of complex diseases but their success has been limited, primarily due to lack of replication in independent studies (Lohmueller et al., 2003, Hirschhorn et al., 2002). This in part could be due to epistasis, or gene-gene interaction, which is thought to be an underlying cause of many complex diseases (Moore, 2003, Moore, 2005). Multifactor Dimensionality Reduction (MDR) has become a popular data-mining approach to identify epistatic interactions for case-control samples, and relies on a form of classification error to rank different combinations of loci in ability to predict disease risk (Ritchie et al., 2001). MDR utilizes classification error for variable selection since genetic models of greatest epidemiological interest are those that efficiently classify individuals as either diseased or healthy.
Many studies have focused on the power of MDR to detect the true underlying disease model and MDR has been shown to have high power to detect a range of disease risk models in both simulation studies and real data (Velez et al., 2007, Motsinger et al., 2006, Motsinger et al., 2007, Moore et al., 2006, Haas et al., 2006). However, in the current study we move from model selection to inference, and focus on the quality of the estimates produced by the method by evaluating the bias and variance of the reported error/accuracy estimates. The accuracy of reported estimates is critical in terms of proper prioritization of identified models for follow-up replication studies. If these estimates are biased, researchers may be prioritizing models for further evaluation ineffectively by focusing resources on erroneous models or by ignoring potentially effective predictors. If error is underestimated, then a model should actually receive lower priority than it appears; conversely, if error is overestimated, then a model should receive higher priority.
Recently, as data-mining approaches have become more commonly used in genetic association studies, emphasis has been placed on not just assessing model fit with a classification error, but on trying to assess predictive performance and prevent model overfitting by utilizing prediction error estimates from internal model validation methods (Altshuler et al., 2008, Pregibon, 1997). Researchers typically use these error estimates for prediction because models with low estimates of prediction error represent models that could be most useful in predicting the disease classification of individuals based on their genetic information. The case-control design is the most common type of study design for genetic association studies, however, in a case-control study, prediction error estimates are obtained from a retrospective sample (Schlesselman, 1982). Retrospective sampling is ideal to maximize power for correct model identification, but may pose problems for inference for the true population. This retrospective sample does not account for population prevalence since cases are often over-represented. Because prediction implies a prospective definition of classification, such retrospective error estimates may not be appropriate for prediction, specifically for MDR and more generally for similar data mining methods.
Let G be the genotype combination of an individual and let D be the disease status where D=1 if the individual has the disease and D=0 otherwise. Retrospective classification of prediction error is based on the probability of a specific genotype combination given disease status, P(G|D=d). However, prediction should focus on the probability of disease status given an individual’s genotypic combination, P(D=d|G), a prospective definition of classification. In a retrospective study, the number of individuals in the sample with and without the disease are fixed, so P(D=d|G) cannot be estimated. Therefore we must rely on estimates that can be calculated from a retrospective sample and are also unbiased in terms of prediction. Other studies have demonstrated the possible bias induced by this type of sampling scheme for general epidemiological studies analyzed with traditional linear models, but the issue has not been considered in the context of a data-mining technique such as MDR (Kagan, 2001, Neuhaus, 2002, Mukherjee & Liu, 2009).
In the current study we evaluate whether the retrospective MDR estimates of error are biased and are appropriate for prediction. We examine this issue both analytically and through Monte Carlo simulation and demonstrate that retrospective error estimates often underestimate and sometimes overestimate the true prospective population error necessary for prediction because they do not consider population prevalence. We propose a post hoc bootstrap error estimate that incorporates an estimate of population disease prevalence and show that this bootstrap estimate improves the accuracy of the current retrospective estimate produced by MDR. These findings have additional implications for the use of MDR and other data-mining methods utilizing classification and prediction error estimates for prospective inference, and have broad applications both within and outside the medical field. All disciplines struggle with a need to prioritize further investigation based on potential impact due to limited resources, and having accurate estimates of predictive ability are paramount to achieving this goal. These results also emphasize the need to move past evaluation of model selection performance for data-mining procedures and highlight the need to make first steps towards inference for data-mining methods and high-dimensional problems.
MATERIALS AND METHODS
Statistical Methods
Multifactor Dimensionality Reduction
Multifactor Dimensionality Reduction (MDR) is a data-mining tool to identify gene-gene interactions in case-control genetic association studies using data reduction (Ritchie et al., 2001). In overview, MDR reduces the full dimensionality of the data by focusing on combinations of loci that may interact. The method is both statistically and genetically nonparametric, since it makes no assumptions based on statistical distributions or genetic modes of inheritance. Suppose we have K total loci and are considering interactions of size k loci. With 3 genotypes per locus, the data can be classified into 3k possible genotypic combinations for a particular set of k loci. Based on these 3k combinations, the MDR model classifies individuals as high-risk or low-risk for developing the disease of interest. Therefore the full data is reduced from K-dimensions to a single dimension with two levels, high-risk and low-risk [Hahn et al, 2001; Moore et al, 2004].
Suppose we have a total sample size n with n1 cases and n0 controls. For simplicity, we will consider only balanced data where n1=n0. Intuitively, MDR defines a genotype combination as high-risk for disease if there are more cases than controls with that combination. Within each of the 3k multi-factorial classes, MDR classifies a genotype combination G=g with g=1,…,3k as high-risk or low-risk by calculating the ratio of cases with combination G (nG∩1) to controls with combination G (nG∩0). G is labeled as “high-risk” if the ratio exceeds the threshold n1/n0=1.0 or G is labeled as “low-risk” otherwise. Mathematically, MDR uses the following Naïve Bayes classifier to assign risk status to the genotype combination, G:
| (1) |
Therefore MDR reduces the k-dimensional space to one dimension with two levels, and this two-level parameterization comprises the MDR model for the particular loci involved. Let model i denote this particular combination of k loci and the MDR high-risk/low-risk parameterization. Each possible model i classifies an individual as a case or control based on the characterization of that individual’s genotype combination as high or low risk. Inherently, some individuals will be incorrectly classified and we want to select a final model to minimize misclassification or equivalently maximize some measure of classification accuracy. Let n10,i be the number of true cases who were incorrectly classified as controls and let n01,i be the number of true controls incorrectly classified as cases by model i. Define classification error as
| (2) |
MDR then selects model i to minimize the classification error CEi (or maximize classification accuracy, CAi =1-CEi) and this combination of loci will be the best model for a k-factor interaction; in this way, MDR uses classification error to rank potential models. For balanced studies with n1=n0, classification error is equivalent to 1-balanced accuracy, the mean of sensitivity and specificity, which is used for unbalanced data sets (Velez et al., 2007). A final best model over all possible sizes of interaction k is chosen with cross-validation [Hastie, 2001; Motsinger et al., 2006] and the statistical significance of the error estimate can be assessed nonparametrically with permutation testing (Motsinger-Reif et al., 2008).
Retrospective Classification Error
The MDR method classifies genotype combinations retrospectively, which is analogous to the case-control sampling scheme for which it was developed. In a retrospective sample, the number of cases and controls in the full dataset are fixed, and genotype combinations are considered random. Therefore retrospective classification is based on P(G|D=d). For instance, a genotype combination G is classified as high-risk in the sample if . Consider the retrospective population, which we define as the over-represented population where the prevalence is equal to the proportion of cases in the retrospective sample rather than the true population prevalence. At the population level, this sample classification is based on the retrospective odds of having the disease, and estimates the retrospective population classification where
| (3) |
Notice that P(G|case)=P(G|D=d), since the probability of having a certain genotype given disease status is the same in both the retrospective and true populations; we adopt this notation to emphasize the focus on the retrospective population rather than the true population. Based on this classification scheme, we can define the retrospective probability of making a classification error at the population level as the probability that an individual without disease has a high-risk genotype or an individual with disease has a low-risk genotype, or
| (4) |
Here P(case) and P(control) refer to the retrospective probabilities of being a case or control, both 0.5 for balanced data since we are considering the over-represented retrospective population.
Prospective Classification Error
In terms of prediction, we would like to be able to classify individuals as either high-risk or low-risk in a prospective rather than retrospective fashion, moving forward in time. For prediction, individuals from the true population (with correct disease prevalence) would be prospectively classified once an MDR model has been identified. Prospectively, the MDR model would define an individual as a “case” if that individual had a higher risk of disease than the population as a whole. In other words, an individual is high-risk if P(D = 1 | G) > P(D = 1), where P(D=1|G) is known as the penetrance of genotypic combination G and P(D=1) is the disease prevalence. Therefore genotype combinations with penetrance greater than the population prevalence are considered high-risk. Notice that this prospective classification scheme is equivalent to retrospective classification (see Supplemental Information for a proof). Both classifiers will result in the same MDR model, but we refer to the prospective classifier to maintain a consistent prospective viewpoint.
For prediction purposes, we can define the prospective probability of making a classification error at the population level as the probability that an individual without disease has a high-risk genotype or an individual with disease has a low-risk genotype, or
| (5) |
It is important to notice that the two probabilities of making a classification error are not the same; the probability of misclassifying an individual retrospectively is not the same as the probability of misclassifying an individual prospectively. To justify this claim, using (3), (4), and (5), mathematically we see that
| (6) |
To see why these two error probabilities are not equal, we must realize that P(case), the probability of having the disease in the retrospective sample is not the same as P(D=1), the population disease prevalence, because cases are usually over-represented in case-control study designs to achieve higher power for rare diseases (Schlesselman, 1982). The retrospective classification error reflects the probability of error from the retrospective population, with an equal number of cases and controls; the prospective classification error reflects the probability of error from the true population. Therefore the estimate of classification error is not invariant to study design and when estimating error of our MDR model, we must consider the sampling scheme. In particular, when we want to use our estimates for prediction, we must account for the population prevalence to reduce bias due to over-representing cases.
The retrospective MDR estimate of classification error, from (1) and (2),
| (7) |
should estimate P(ER) and not P(EP), since nG,0/n for high-risk G is an estimate of P(G|control)P(control), and so on. Hence we expect prediction estimates based on this retrospective estimate to be biased.
We can consider bias in two settings, both retrospective and prospective, in order to determine under which scenarios MDR error estimates are biased and which population-based error is actually estimated by MDR. Define retrospective bias (BR) and prospective bias (BP) as
| (8) |
In the retrospective setting, we expect BR to be low in absolute value for CE because we claim that CE is estimating P(ER). But in the prospective setting, or the prediction setting, we would expect that BP would be relatively high in absolute value, since CE does not estimate P(EP). The direction of this bias will depend on the penetrance and minor allele frequency of the particular disease model; specifically, it depends on the number of errors made from high risk genotypes compared to those made from low risk genotypes as follows:
| (9) |
See the Supplemental Information for an algebraic proof and an example.
Error Estimate from Bootstrap Resampling
In order to correct for the discrepancy between the retrospective MDR error estimate and the prospective nature of prediction and classification, we developed a new post-hoc estimator of model error based on a bootstrap resampling procedure to account for population prevalence by modifying the sampling rate. This method does rely on a reasonably accurate estimate of disease prevalence, p̂D, where E(p̂D) = P(D = 1) which is commonly attainable for many human diseases. First, N bootstrap resamples of the same size as the original sample are randomly constructed, where cases are sampled at the rate p̂D and controls at the rate 1−p̂D. Consequently, there will be np̂D cases and n(1−p̂D) controls in every bootstrap sample, resulting in a sample more representative of the true population. In the new bootstrap samples, P(case) = P(D = 1) in expectation, so P(Ep) ≈ P(ER) as n → ∞ . Next high-risk genotypes are defined as genotype(s) with the sample prevalence greater than the estimate of population prevalence. Then for the final selected MDR model, the classification error for each bootstrap sample is calculated using the following formula:
| (10) |
The final bootstrap estimate is the average of CEboot over all N bootstrap samples.
Additionally, as an alternative to bootstrap sampling, we could adjust our original estimate CE (Eqn 7) using the new post-hoc estimator
| (11) |
so that P(ER)=P(EP) in expectation. However, we feel that the bootstrap estimate is superior because the difference in prospective and retrospective error relies on more than just prevalence, but also the classification scheme. By using the bootstrap, we are constructing a prospective sample, which is more analogous to a prediction scenario. Additionally, because the bootstrap constructs a sample representative of the true population, the probability that an individual was sampled is independent of disease status. Therefore the probability of sampling an individual given they are a case (p1) is equal to the probability of sampling an individual given they are a control (p0) in terms of the true population, implying that the sampling ratio of cases to controls (r=p1/p0) is equal to 1. It has previously been shown that estimates are unbiased in this situation for the general linear model (Neuhaus, 2002).
Simulation Study Design
To illustrate our claims that the MDR estimate of CE is biased under a prospective definition of true classification error and to examine the validity of our proposed estimate CEboot as a solution for prediction, we performed a Monte Carlo simulation study. Our objective was to determine the bias and variance of CE produced by MDR under both the retrospective and prospective definitions of true error, and to consider the bias and variance of our proposed estimate, CEboot, under disease models where the functional loci interact. We designed a simulation study using 100 case-control Monte Carlo replications for single locus main effects models and two-locus epistatic disease models. Each data set was balanced with 500 cases and 500 controls and genotype information was available at 25 loci. However, because we are not considering the power to detect a true model but rather the accuracy of the error estimate for the true model, the nuisance loci are irrelevant.
Factors of the simulation were determined to be size of true model, prevalence, and model type as characterized by penetrance pattern (Table 1). Model sizes considered were single locus and 2-locus interactions. Penetrance patterns for the single locus models represent dominant, additive, and recessive risk models with main effects (Table 1a). Models of size two were epistatic models, with penetrance patterns reflecting XOR, ZZ and Box models (Table 1b). The XOR and ZZ models are well-described theoretical examples of epistasis with no main effects at either locus (Li & Reich, 2000, Frankel & Schork, 1996). We also consider a Box model, which is a two-locus interaction with main effects and a variation of the dominant-dominant model considered by Neuman and Rice (Neuman & Rice, 1992). Prevalence considered for all single locus models range from 0.1 to 0.5, and the prevalence for the XOR and Box models range from 0.05 to 0.5. The prevalence considered for the ZZ model ranges from 0.05 to 0.25 only, since prevalence greater than 0.25 is not possible for the particular penetrance pattern. Minor allele frequencies were fixed at 0.5 for all models; however, to evaluate the effect of minor allele frequency, frequencies of 0.25 were also considered for the dominant and recessive models. The heritability for each main effects model and the Box model was relatively low (4–11%). Heritability for the XOR and ZZ models was much higher (5–100%) and increases with prevalence. A total of 70 combinations of factors were considered and specific combinations and associated heritability of each model can be seen in Supplemental Information (Supplemental Tables 1 and 2).
Table 1.
Penetrance function patterns for data simulation.
| A: Penetrance patterns for single locus models. Variables “x” and “y” represent penetrance values with 0<y<x<1, so cells marked x represent genotypes with greater risk. | |||
|---|---|---|---|
| Genotype | AA | Aa | aa |
| Dominant | y | x | x |
| Recessive | y | y | x |
| Additive | y | (x+y)/2 | x |
| B: Penetrance patterns for 2-locus epistatic models. Cell marked “x” represent genotype combinations with greater risk. Both “x” and “y” represent penetrance values with 0<y<x<1. | |||||||||
|---|---|---|---|---|---|---|---|---|---|
| Model | XOR | ZZ | Box | ||||||
| Genotype | AA | Aa | aa | AA | Aa | aa | AA | Aa | aa |
| BB | 0 | x | 0 | 0 | 0 | 2x | y | y | y |
| Bb | x | 0 | x | 0 | x | 0 | y | x | x |
| bb | 0 | x | 0 | 2x | 0 | 0 | y | x | x |
Data Generation and Analysis
Retrospective case-control data were generated using the penetrance P(D|G). For all models, penetrance functions were explicitly determined to achieve the desired prevalence, minor allele frequency, model pattern, and to control heritability where applicable. These penetrance functions were used to generate 100 datasets for each of the 70 models using genomeSIM software, details of which have been previously described (Dudek et al., 2006).
All data sets were analyzed with MDR using 5-fold cross-validation [Motsinger, 2006 #7]. To obtain error estimates for the true disease models, MDR was restricted to the true functional loci so the true model would always be selected as the final model. The MDR estimate of classification error, CEMDR, was calculated based on the average of the five CE estimates obtained from the five cross-validation intervals as outlined in (Motsinger & Ritchie, 2006), such that the CE estimates are interpreted as prediction errors. Estimates of error averaged across cross-validation intervals were recorded for each of the 70 models, as well as the post-hoc bootstrap estimate, CEBOOT, for bootstrap samples of size N=100 and 1000, constructed from the true simulated prevalence. Monte Carlo estimates of variance and prospective bias, BP, were calculated for both CEMDR and CEBOOT to determine if MDR estimates are in fact biased for prediction and if a bootstrap solution reduces this bias. Retrospective bias, BR, was also calculated for CEMDR to determine if the bias is reduced when retrospective sampling is considered and if CEMDR actually estimates P(ER) as claimed. To assess the effect of a lower minor allele frequency, comparisons were also made between models of MAF=0.25 and 0.5 for the dominant and recessive models. And to evaluate the potential effectiveness of the post-hoc adjusted estimator CEadj (Eq. 11), we compare the bootstrap results to CEadj for all models with MAF=0.5.
Additionally, to assess the effect of error in the estimated prevalence rate, bootstrap estimates were also calculated with both overestimated and underestimates p̂D. Estimates for p̂D were constructed in two ways. First, a different estimate was constructed for each dataset for each model as the sample proportion of cases from a binomial distribution with success probability equal to the true prevalence P(D=1) and np=100 or 500, to reflect different magnitudes of error. Second, two estimates were constructed for all 100 datasets for a given model, both an underestimate and an overestimate, calculated as P(D = 1)±1.96 · SE, where and np=100 or 500 to reflect different magnitudes of error. All analyses were performed in R (R Development Core Team, 2005) and code for the MDR method and bootstrap estimates of error is available upon request from the authors.
After estimates were obtained, the simulation results were statistically analyzed under a general linear models framework to determine if prevalence significantly affected the level of prospective bias for MDR after controlling for type of model and heritability. Repeated measures analysis was also performed to determine if BP was significantly larger than BR for MDR after controlling for prevalence, type of model, and heritability. Analysis was performed in Version 9.1 of SAS software for Windows (SAS Institute Inc., 2004).
RESULTS
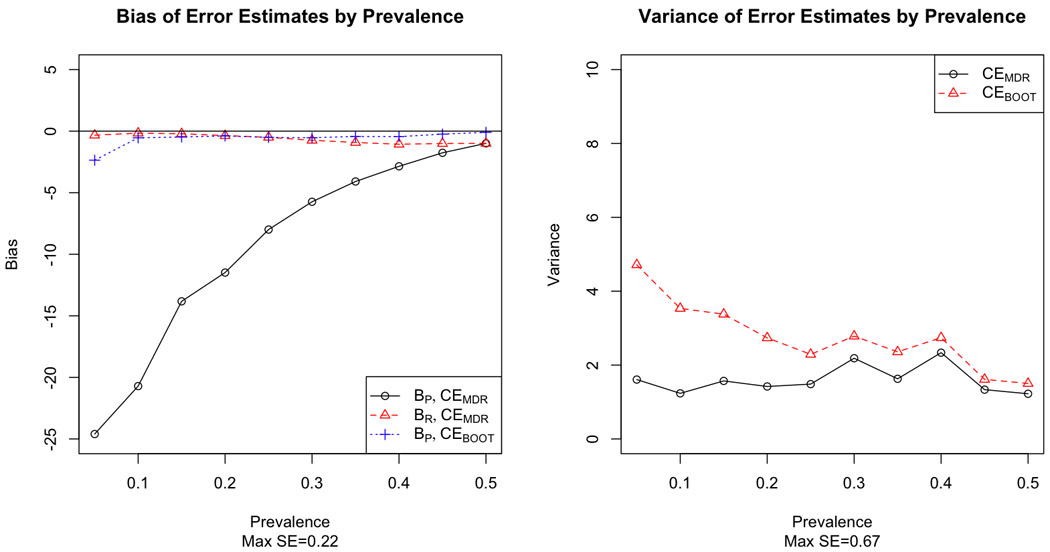
Figures 1–6 demonstrate the results for MAF=0.5 for both prospective and retrospective bias against prevalence for CEMDR and CEBOOT, and illustrate that prevalence is an important factor for MDR prospective bias (p<0.0001). For all model types, bias is much greater in absolute value under the prospective definition of error than under the retrospective definition of error for CEMDR (p<0.0001). Prospective bias (BP) for CEMDR is large for low prevalence, but decreases as prevalence approaches 0.5 for all three main effects models (Figure 1–3). For the dominant and additive models BP for CEMDR is negative, while for the recessive model BP is positive. Retrospective bias (BR) for CEMDR is near zero for all three models, and notice that BP=BR for CEMDR when p̂D = 0.5. Also BP of CEBOOT is less than that of CEMDR, particularly for the dominant and recessive risk models where BP remains near zero across all values of prevalence (Figure 1–2). Variance is higher for CEBOOT than for CEMDR in all models, particularly when the prevalence is low; additionally, the variability of CEBOOT is extremely high for the additive model (Figure 3).
Figure 1.
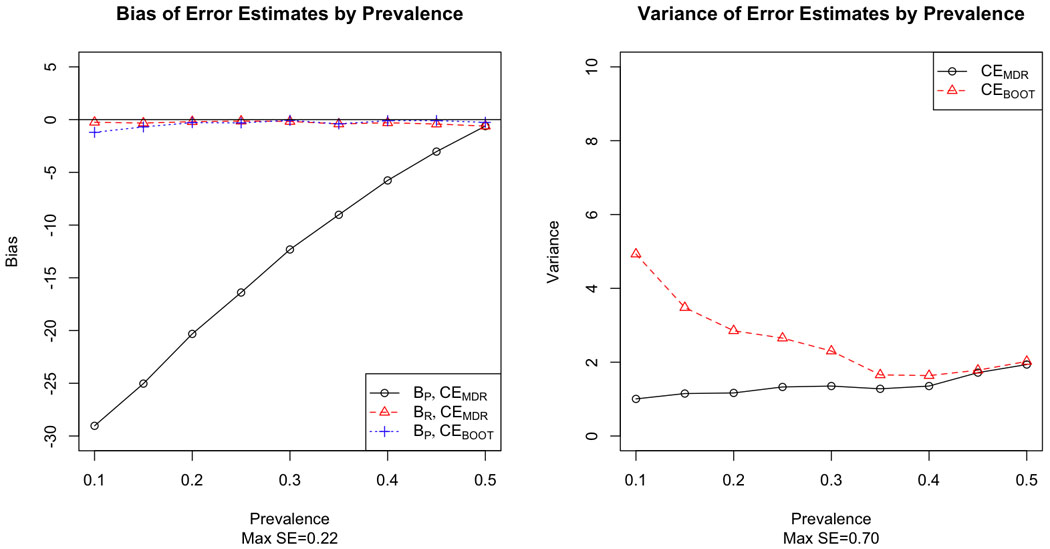
Bias (left) and variance (right) of MDR and bootstrap estimates of prediction error by prevalence for a single locus model with dominant risk.
Figure 6.
Bias (left) and variance (right) of MDR and bootstrap estimates of prediction error by prevalence for the two-locus Box risk model.
Figure 3.

Bias (left) and variance (right) of MDR and bootstrap estimates of prediction error by prevalence for a single locus model with additive risk.
Figure 2.
Bias (left) and variance (right) of MDR and bootstrap estimates of prediction error by prevalence for a single locus model with recessive risk.
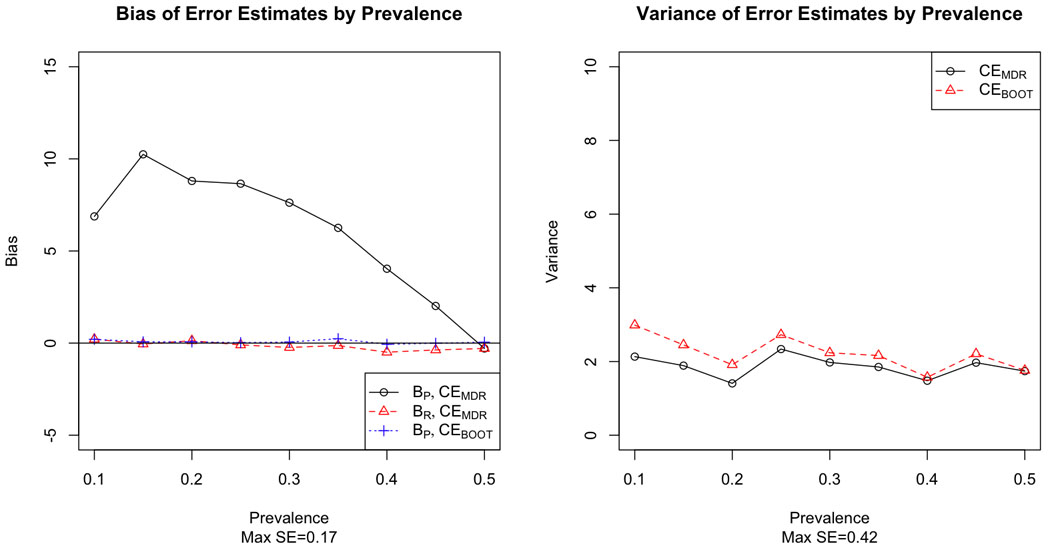
We see similar results for the two-locus epistatic models; BR for CEMDR is very close to zero, but BP is much less than zero, indicating that CEMDR grossly underestimates error for prediction (Figure 4–6). The bootstrap estimate does much better, with bias near zero for all three two-locus models. In terms of variability, the bootstrap estimate is slightly more variable than the MDR estimate, but the variability of the bootstrap estimate decreases as prevalence increases, particularly when prevalence is near 0.5.
Figure 4.

Bias (left) and variance (right) of MDR and bootstrap estimates of prediction error by prevalence for the two-locus XOR risk model.
For CEBOOT, we report the results for N=100. The estimates of bias appear to be stable across N=100 and N=1000, and the variability is only slightly lower with N=1000. For instance, we report the comparison for the bootstrap estimates for the dominant models (Table 2). Other models displayed similar results.
Table 2.
Comparison of bias and variance of bootstrap estimates for 100 and 1000 samples for the dominant models.
| Bias | Variance | |||
|---|---|---|---|---|
| Prevalence | 100 | 1000 | 100 | 1000 |
| 0.10 | −1.21 | −1.19 | 4.93 | 4.53 |
| 0.15 | −0.69 | −0.67 | 3.48 | 3.10 |
| 0.20 | −0.29 | −0.27 | 2.85 | 2.82 |
| 0.25 | −0.31 | −0.29 | 2.65 | 2.68 |
| 0.30 | −0.07 | −0.06 | 2.30 | 2.34 |
| 0.35 | −0.40 | −0.41 | 1.66 | 1.68 |
| 0.40 | −0.10 | −0.09 | 1.64 | 1.66 |
| 0.45 | −0.10 | −0.09 | 1.78 | 1.78 |
| 0.50 | −0.26 | −0.24 | 2.02 | 2.05 |
Additionally, there is little difference between the performance of CEBOOT and CEadj, except in the case of the additive model, where CEadj had much higher variance. Figure 7 shows the prospective bias and variance by prevalence for the additive model. See the Supplemental Information for full results of the comparison of . CEBOOT and CEadj for additional models.
Figure 7.

Prospective bias (left) and variance (right) of CEMDR, CEBOOT with N=100, and CEadj with known prevalence for the single locus model with additive risk.
For both the dominant and recessive models, the patterns of both bias and variance for CEMDR and CEBOOT are similar across minor allele frequencies of 0.25 and 0.5, although the degree of prospective bias (Bp) depends on the particular model and penetrance values. We also notice high variance for CEBOOT for MAF=0.25 for the recessive model. For full results, see the Supplemental Information.
When the bootstrap estimate is constructed with error in the prevalence estimate p̂D for each individual dataset, we see little change compared with the estimate constructed with known prevalence in terms of bias, but a higher degree of variability. (See Supplemental Information for figures displaying the full results). When a single under- or over-estimate of prevalence is used for all 100 datasets per model, we see that the bias is slightly increased (one direction for under-, the other direction for over-), and the degree of this increase depends on the magnitude of the standard error; the bias is greater when the prevalence is estimated with np=100 individuals as compared to np=500 individuals . Variance is also marginally changed, with increased variance for an underestimate and decreased variance for an overestimate. The bias and variance results are shown for the ZZ model in Figures 8 and 9 respectively. Results for additional models are included in the Supplemental Information.
Figure 8.

Prospective bias for CEBOOT with under-estimated (left) and over-estimated (right) prevalence from np=100, 500 subjects compared with CEBOOT with known prevelance and CEMDR for the two-locus ZZ risk model.
Figure 9.

Variance for CEBOOT with under-estimated (left) and over-estimated (right) prevalence from np=100, 500 subjects compared with CEBOOT with known prevelance and CEMDR for the two-locus ZZ risk model.
DISCUSSION
In this study, we demonstrate that prospective and retrospective biases are not the same for the MDR error estimate, particularly when population prevalence is far from 0.5. In the special case that prevalence equals 0.5, retrospective and prospective bias are equal as expected. We see that CEMDR has large prospective bias but low retrospective bias. For the dominant and additive models, CEMDR underestimates true prospective error associated with prediction, but CEMDR overestimates for the recessive model. The direction of prospective bias is dependent on the particular penetrance pattern, specifically on the ratio of cases and controls compared to the prevalence and the ratio of errors made from low risk genotypes compared to high risk genotypes, where more low risk genotypes are present for the recessive model (see Supplemental Information for a concrete example). For both the dominant and additive models, more errors are made from high risk genotypes, whereas for the recessive model, more errors are made from low risk genotypes. Consequently, for the case of an additive or dominant model, the current MDR error estimate deceivingly indicates that the model classifies well, so researchers may be unnecessarily focusing their attention on non-predictive models. In the recessive case, the MDR estimate is too low and the model appears to classify poorly, and researchers may miss following up on a model which should actually receive high priority. In practice, without knowledge of the penetrance pattern, the direction of bias may be difficult to predict, but the use of a post-hoc adjustment could potentially be used as an assessment tool. These results have great implications for using MDR for inference beyond selecting important loci for follow-up study and raise questions about how the method should be appropriately used for prospective inference. MDR has proven successful in identifying epistatic interactions for complex diseases (Brassat et al., 2006, Edwards et al., 2008, Nordgard et al., 2007), and this success motivates a need to evaluate the identified models in terms of predictive capability; however, current estimates of prediction error are not adequate for prospective classification, and may adversely affect prioritization of genetic factors. The results from a retrospective analysis are powerful and valuable for model identification and selection, and in many situations gene identification is more important than prospective inference; however, in many other situations, model selection through data-mining is simply a first step and approaches to make prospective inference after data-mining need also be considered.
Retrospective bias for the MDR estimate is low (near 0) in all cases, indicating that the error estimate produced by the method does in fact estimate retrospective rather than prospective error. This could in part explain why independent studies do not replicate, since researchers are currently utilizing retrospective samples to address a prospective problem where the estimators employed are not invariant to sampling scheme. As a result, CEMDR should be used primarily to retain high power for model selection; we cannot use CEMDR to prospectively predict disease classification of individuals, particularly when the estimated prevalence of disease is far from 50%, and instead we propose a post-hoc method that accurately estimates prospective error. We recommend using CEMDR for model identification, but a post-hoc prospective estimator for prediction.
Furthermore, CEBOOT has less prospective bias than CEMDR, especially for diseases with lower prevalence. However, we also see a bias/variance trade-off with the use of the bootstrap, a property common to many estimators (Geman et al., 1992). While it reduces bias, it increases the variance of the estimator, particularly when prevalence is low. When this type of trade-off is present, the mean-squared error (MSE = bias2 + variance) is typically considered, and CEBOOT frequently has lower MSE than CEMDR in most settings. Increasing the number of bootstrap samples could reduce the variability of CEBOOT; however, we only saw a marginal reduction in variance when increasing the number of samples by a factor of 10, which may not justify the increased computation time in a large-scale simulation study, but could be helpful for a single real dataset. The increased variance of the bootstrap estimator is due to the additional variability associated with bootstrap resampling, particularly for disease models with low prevalence where there is high random variation in the cases selected and covariance due to selecting the same controls multiple times within a single resample.
It should also be noted that the reduction in bias seen with the bootstrap is not always substantial, such as with the additive model, and could potentially be improved with other adjusted estimators. The bootstrap solution works well if the penetrance of each genotype combination is far from the prevalence, but performs poorly if the penetrance is equal to the prevalence for some genotypes, as in the case of the additive model. When the penetrance of a particular genotype is close to the population prevalence, there is large instability in the classification of that genotype as high or low risk because the genotype actually incurs moderate risk. The additive model appears to demonstrate the limitaion of the model-free nature of the MDR classifier in general rather than the bootstrap estimator specifically, since the heterozygous genotype will often be incorrectly classified; the problem is exacerbated for the bootstrap, however, because the prospective sample provides a more unstable classification. The bootstrap solution is an improvement, but only represents a first step in addressing the use of retrospective sampling methods to make prospective inference to detect epistasis with MDR.
We see that varying the minor allele frequency changed the penetrance pattern and therefore affected the prospective bias, although the bias for CEBOOT is still much smaller than for the retrospective estimator CEMDR. Most notably, the variance of the bootstrap estimator was extremely high for the recessive model with MAF=0.25 for prevalence 0.2 and 0.25. This is primarily due to the instability in resampling for these particular models, since the probability of being a case and having the more common homozygous genotype is very close to the probability of being a control and having the more common homozygous genotype. Therefore this genotype is frequently incorrectly classified as high-risk, a similar problem as was seen with the additive model. A possible solution would be to fix the classification of each genotype in the bootstrapping procedure.
Both CEadj and CEBOOT were proposed as post-hoc corrections for the estimate of prospective classification error, and can be implemented without cross-validation after initial model selection with CEMDR. We see that the results of CEadj are similar to those of the bootstrap, with the exception of the extremely high variance observed for the additive model. This is again because of the unstable classification of the heterozygous genotype, which is even greater for CEadj since CEBOOT averages across N resamples. Because of this instability, we recommend the use of CEBOOT over CEadj.
Our bootstrap estimator appears to be relatively robust to errors in the estimated prevalence rate. When the prevalence estimate is not accurate, the magnitude of the prospective bias is slightly increased, where the directional change depends on whether an underestimate or overestimate is utilized; however, the magnitude of this change is small relative to the bias seen with CEMDR, suggesting that CEBOOT is still the preferred prospective estimator, even in the case of error in the prevalence estimate used. The variance is also affected by an inaccurate estimated prevalence, with higher variance observed for underestimates and lower variance observed for overestimates. This is not surprising, since underestimates of prevalence will provide a prospective sample with a higher discrepancy between number of cases and controls and overestimates will provide a prospective sample closer to the original retrospective sample.
The current simulation study generates new questions about the use of the bootstrap to correct for bias due to retrospective sampling and could be extended to explore a wider range of scenarios for further investigation. From preliminary examination, it appears that the performance of our estimator could be improved by estimating the high-risk/low-risk characterization of each genotype combination from the full data and incorporating this characterization into the estimate of CE (Eqn 10) for each bootstrap resample to enhance stability, but this needs to be further explored. Additionally, we only considered a balanced case-control design with a large sample size and could examine a broader range of samples sizes and degrees of imbalance (sampling ratio) between cases and controls to better reflect clinical settings. Although we considered balanced datasets and varied disease prevalence, we could directly incorporate the sampling ratio of cases to controls into the study and investigate how our results are affected for direct comparison to previous studies of retrospective bias (Neuhaus, 2002, Mukherjee & Liu, 2009). We could also explore incorporating heritability into our error estimate, as heritability is related to prevalence as a function of both penetrance and genotype frequency.
At the heart of this study is that while the classifier used to construct the MDR model is equivalent under both retrospective and prospective sampling, the measure used to evaluate the model (classification error) is not equivalent under both sampling schemes. Retrospective sampling relies on the retrospective odds of disease, which is not equal to the prospective odds of disease. This suggests that we may want to consider a new evaluation measure that is invariant to sampling scheme. Currently many other evaluation measures are available for the MDR method, but they suffer from the same pitfalls as classification error in terms of prediction bias. They are also based on a retrospective framework and were designed to improve power, and are not invariant to sampling scheme (Namkung et al., 2009, Bush et al., 2008, Velez et al., 2007). The odds ratio is a classic example of an invariant statistic in terms of retrospective and prospective sampling, and is commonly utilized for disease modeling with logistic regression (Agresti, 2002, Prentice & Pyke, 1979). An invariant statistic such as the odds ratio may be optimal for settings where retrospective sampling is used to make prospective inference.
In the future, we would like to incorporate the use of the traditional odds ratio into the evaluation measure used to rank models so that both the ranking and error estimate are invariant to study design. Using a prospective versus a retrospective evaluation measure could change the ranking of the MDR models, resulting in potentially different best models for the two sampling schemes. When we utilize a retrospective evaluation measure, we may not be selecting the appropriate model in terms of prediction since we are ranking models based on the incorrect retrospective error. Possibly a measure of prospective error may be more appropriate for ranking with MDR, particularly if our ultimate goal is prospective inference. We would like to further investigate this by determining if the ranking of models differs when a prospective evaluation measure is considered.
The development of prospective classification estimates will be a crucial step in translating genetic and genomic associations into the clinic. Prediction is an important clinical objective and for genetic and genomic associations to be integrated into personalized medicine, prospective models will have to be used for these associations to be truly predictive in a clinical setting. As the end goal of any methods development is real data application, the proposed post hoc bootstrap approach should be empirically evaluated in real datasets, and should be considered for previously identified MDR models that are currently undergoing follow-up in additional studies.
In summary, MDR is a powerful tool to detect epistatic interactions in epidemiological studies, but its utility to build truly predictive models is compromised by the difficulty in inference for the method, particularly in its failure to correctly analyze prospective data. Additionally, as genetics and genomics are integrated into a “personalized medicine” framework, prospective samples will become more commonplace, and we need to extend our methods to accommodate this shift. The post hoc bootstrap approach for error estimation proposed here is a promising solution to this limitation. When using an MDR model for prediction, we must consider population prevalence and the prospective nature of prediction estimates as compared to the retrospective nature of the error estimates currently employed by the MDR method. By doing so, the bootstrap error estimate provided reasonably unbiased prospective error. Furthermore, the bias induced due to retrospective sampling is in no way unique to MDR and affects all data-mining methods that utilize classification error. This should be considered in all genetic epidemiological applications that utilize methods rooted in both classification error and retrospective sampling. While retrospective sampling is a powerful tool for rare diseases where few cases can be expected, the desired inference in genetic epidemiology is often prospective in nature and we need to consider the validity of prospective analysis on retrospective data.
Supplementary Material
Figure 5.

Bias (left) and variance (right) of MDR and bootstrap estimates of prediction error by prevalence for the two-locus ZZ risk model.
ACKNOWLEDGEMENTS
This work was supported by Grant Number T32GM081057 from the National Institute of General Medical Sciences and the National Institute of Health.
REFERENCES
- Agresti A. Categorical Data Analysis. Wiley; 2002. [Google Scholar]
- Altshuler D, Daly MJ, Lander ES. Genetic mapping in human disease. Science. 2008;322:881–888. doi: 10.1126/science.1156409. [DOI] [PMC free article] [PubMed] [Google Scholar]
- Brassat D, Motsinger AA, Caillier SJ, Erlich HA, Walker K, Steiner LL, Cree BA, Barcellos LF, Pericak-Vance MA, Schmidt S, Gregory S, Hauser SL, Haines JL, Oksenberg JR, Ritchie MD. Multifactor dimensionality reduction reveals gene-gene interactions associated with multiple sclerosis susceptibility in African Americans. Genes Immun. 2006;7:310–315. doi: 10.1038/sj.gene.6364299. [DOI] [PMC free article] [PubMed] [Google Scholar]
- Bush WS, Edwards TL, Dudek SM, Mckinney BA, Ritchie MD. Alternative contingency table measures improve the power and detection of multifactor dimensionality reduction. Bmc Bioinformatics. 2008;9 doi: 10.1186/1471-2105-9-238. [DOI] [PMC free article] [PubMed] [Google Scholar]
- Dudek SM, Motsinger AA, Velez DR, Williams SM, Ritchie MD. Data simulation software for whole-genome association and other studies in human genetics. Pac Symp Biocomput. 2006:499–510. [PubMed] [Google Scholar]
- Edwards TL, Dudek SM, Ritchie MD. Resolving the power of multifactor dimensionality reduction in the presence of many noise variables or genetic heterogeneity. Genet. Epidemiol. 2007;31:69. [Google Scholar]
- Edwards TL, Wang X, Chen Q, Wormly B, Riley B, O'neill FA, Walsh D, Ritchie MD, Kendler KS, Chen X. Interaction between interleukin 3 and dystrobrevin-binding protein 1 in schizophrenia. Schizophr Res. 2008;106:208–217. doi: 10.1016/j.schres.2008.07.022. [DOI] [PMC free article] [PubMed] [Google Scholar]
- Frankel WN, Schork NJ. Who's afraid of epistasis? Nat Genet. 1996;14:371–373. doi: 10.1038/ng1296-371. [DOI] [PubMed] [Google Scholar]
- Geman S, Bienenstock E, Doursat R. NEURAL NETWORKS AND THE BIAS VARIANCE DILEMMA. Neural Computation. 1992;4:1–58. [Google Scholar]
- Haas DW, Geraghty DE, Andersen J, Mar J, Motsinger AA, D'aquila RT, Unutmaz D, Benson CA, Ritchie MD, Landay A. Immunogenetics of CD4 lymphocyte count recovery during antiretroviral therapy: An AIDS Clinical Trials Group study. J Infect Dis. 2006;194:1098–1107. doi: 10.1086/507313. [DOI] [PubMed] [Google Scholar]
- Hahn LW, Ritchie MD, Moore JH. Power of multifactor dimensionality reduction (MDR) for identifying gene-gene and gene-environment interactions. American Journal of Human Genetics. 2001;69:1174. doi: 10.1086/321276. [DOI] [PMC free article] [PubMed] [Google Scholar]
- Hirschhorn JN, Lohmueller K, Byrne E, Hirschhorn K. A comprehensive review of genetic association studies. Genetics in Medicine. 2002;4:45–61. doi: 10.1097/00125817-200203000-00002. [DOI] [PubMed] [Google Scholar]
- Kagan A. A note on the logistic link function. Biometrika. 2001;88:599–601. [Google Scholar]
- Li W, Reich J. A complete enumeration and classification of two-locus disease models. Hum Hered. 2000;50:334–349. doi: 10.1159/000022939. [DOI] [PubMed] [Google Scholar]
- Lohmueller KE, Pearce CL, Pike M, Lander ES, Hirschhorn JN. Meta-analysis of genetic association studies supports a contribution of common variants to susceptibility to common disease. Nature Genet. 2003;33:177–182. doi: 10.1038/ng1071. [DOI] [PubMed] [Google Scholar]
- Moore JH. The ubiquitous nature of epistasis in determining susceptibility to common human diseases. Hum Hered. 2003;56:73–82. doi: 10.1159/000073735. [DOI] [PubMed] [Google Scholar]
- Moore JH. A global view of epistasis. Nat Genet. 2005;37:13–14. doi: 10.1038/ng0105-13. [DOI] [PubMed] [Google Scholar]
- Moore JH, Gilbert JC, Tsai CT, Chiang FT, Holden T, Barney N, White BC. A flexible computational framework for detecting, characterizing, and interpreting statistical patterns of epistasis in genetic studies of human disease susceptibility. J Theor Biol. 2006;241:252–261. doi: 10.1016/j.jtbi.2005.11.036. [DOI] [PubMed] [Google Scholar]
- Motsinger-Reif AA, Reif DM, Fanelli TJ, Ritchie MD. A comparison of analytical methods for genetic association studies. Genet Epidemiol. 2008;32:767–778. doi: 10.1002/gepi.20345. [DOI] [PubMed] [Google Scholar]
- Motsinger AA, Brassat D, Caillier SJ, Erlich HA, Walker K, Steiner LL, Barcellos LF, Pericak-Vance MA, Schmidt S, Gregory S, Hauser SL, Haines JL, Oksenberg JR, Ritchie MD. Complex gene-gene interactions in multiple sclerosis: a multifactorial approach reveals associations with inflammatory genes. Neurogenetics. 2007;8:11–20. doi: 10.1007/s10048-006-0058-9. [DOI] [PubMed] [Google Scholar]
- Motsinger AA, Ritchie MD. The effect of reduction in cross-validation intervals on the performance of multifactor dimensionality reduction. Genet Epidemiol. 2006;30:546–555. doi: 10.1002/gepi.20166. [DOI] [PubMed] [Google Scholar]
- Motsinger AA, Ritchie MD, Shafer RW, Robbins GK, Morse GD, Labbe L, Wilkinson GR, Clifford DB, D'aquila RT, Johnson VA, Pollard RB, Merigan TC, Hirsch MS, Donahue JP, Kim RB, Haas DW. Multilocus genetic interactions and response to efavirenz-containing regimens: an adult AIDS clinical trials group study. Pharmacogenet Genomics. 2006;16:837–845. doi: 10.1097/01.fpc.0000230413.97596.fa. [DOI] [PubMed] [Google Scholar]
- Mukherjee B, Liu I. A note on bias due to fitting prospective multivariate generalized linear models to categorical outcomes ignoring retrospective sampling schemes. Journal of Multivariate Analysis. 2009;100:459–472. doi: 10.1016/j.jmva.2008.05.011. [DOI] [PMC free article] [PubMed] [Google Scholar]
- Namkung J, Kim K, Yi S, Chung W, Kwon MS, Park T. New evaluation measures for multifactor dimensionality reduction classifiers in gene-gene interaction analysis. Bioinformatics. 2009;25:338–345. doi: 10.1093/bioinformatics/btn629. [DOI] [PubMed] [Google Scholar]
- Neuhaus JM. Bias due to ignoring the sample design in case-control studies. Australian & New Zealand Journal of Statistics. 2002;44:285–293. [Google Scholar]
- Neuman RJ, Rice JP. TWO-LOCUS MODELS OF DISEASE. Genet. Epidemiol. 1992;9:347–365. doi: 10.1002/gepi.1370090506. [DOI] [PubMed] [Google Scholar]
- Nordgard SH, Ritchie MD, Jensrud SD, Motsinger AA, Alnaes GI, Lemmon G, Berg M, Geisler S, Moore JH, Lonning PE, Borresen-Dale AL, Kristensen VN. ABCB1 and GST polymorphisms associated with TP53 status in breast cancer. Pharmacogenet Genomics. 2007;17:127–136. doi: 10.1097/FPC.0b013e328011abaa. [DOI] [PubMed] [Google Scholar]
- Pregibon D. Data Mining. Stat Computing and Graphics. 1997;7 [Google Scholar]
- Prentice RL, Pyke R. LOGISTIC DISEASE INCIDENCE MODELS AND CASE-CONTROL STUDIES. Biometrika. 1979;66:403–411. [Google Scholar]
- R Development Core Team. Vienna, Austria: R Foundation for Statistical Computing; 2005. R: A language and environment for statistical computing. ISBN 3-900051-07-0, URL http://www.R-project.org. [Google Scholar]
- Ritchie MD, Hahn LW, Moore JH. Power of multifactor dimensionality reduction for detecting gene-gene interactions in the presence of genotyping error, missing data, phenocopy, and genetic heterogeneity. Genet Epidemiol. 2003;24:150–157. doi: 10.1002/gepi.10218. [DOI] [PubMed] [Google Scholar]
- Ritchie MD, Hahn LW, Roodi N, Bailey LR, Dupont WD, Parl FF, Moore JH. Multifactor-dimensionality reduction reveals high-order interactions among estrogen-metabolism genes in sporadic breast cancer. Am J Hum Genet. 2001;69:138–147. doi: 10.1086/321276. [DOI] [PMC free article] [PubMed] [Google Scholar]
- Cary, NC: Sas Institute Inc.; 2004. [Google Scholar]
- Schlesselman JJ. Case Control Studies: Design, Conduct, Analysis. New York: Oxford University Press; 1982. [Google Scholar]
- Velez DR, White BC, Motsinger AA, Bush WS, Ritchie MD, Williams SM, Moore JH. A balanced accuracy function for epistasis modeling in imbalanced datasets using multifactor dimensionality reduction. Genet Epidemiol. 2007;31:306–315. doi: 10.1002/gepi.20211. [DOI] [PubMed] [Google Scholar]
Associated Data
This section collects any data citations, data availability statements, or supplementary materials included in this article.