

Abstract
Mutations in the Leucine Rich Repeat Kinase 2 (LRRK2) gene, first described in 2004 have now emerged as the most important genetic finding in both autosomal dominant and sporadic Parkinson’s Disease (PD). While a formidable research effort has ensued since the initial gene discovery, little is known of either the normal or the pathological role of LRRK2. We have created lines of mice that express human mutant wild-type (hWT) or G2019S Lrrk2 via bacterial artificial chromosome (BAC) transgenesis. In vivo analysis of the dopaminergic system revealed abnormal dopamine neurotransmission in both hWT and G2019S transgenic mice evidenced by a decrease in extra-cellular dopamine levels, which was detected without pharmacological manipulation. Immunopathological analysis revealed changes in localization and increased phosphorylation of microtubule binding protein tau in G2019S mice. Quantitative biochemical analysis confirmed the presence of differential phospho-tau species in G2019S mice but surprisingly, upon dephosphorylation the tau isoform banding pattern in G2019S mice remained altered. This suggests that other post-translational modifications of tau occur in G2019S mice. We hypothesize that Lrrk2 may impact on tau processing which subsequently leads to increased phosphorylation. Our models will be useful for further understanding of the mechanistic actions of LRRK2 and future therapeutic screening.
Keywords: Parkinson’s Disease, Transgenic, Dopamine, Microdialysis, Neuropathology, Anxiety
INTRODUCTION
LRRK2 mutations represent a unique opportunity for the development of genetic model systems for Parkinson’s disease (PD). LRRK2 mutations are the most common form of familial parkinsonism and account for up to 40% of sporadic parkinsonism in certain populations (reviewed by Farrer, 2006). Clinically and pathologically, the features of LRRK2-associated parkinsonism are often indistinguishable from idiopathic PD; although variability exists even within PARK8-linked kindreds, ranging from nigral neuronal loss only, to neuronal loss with α-synuclein, ubiquitin or tau inclusions (reviewed by Whaley et al., 2006). To date, four different domains (ROC, C-terminal of ROC, kinase and WD40) of Lrrk2 are known to be affected by mutation/risk factors. Whilst the ultimate downstream consequence of LRRK2 mutation in humans is parkinsonism, it is still unclear if the variants share common pathogenic mechanisms or if individual variants exert specific effects.
Until recently, hypotheses about Lrrk2 dysfunction were based on data from lower model organisms and cellular systems. Several lines of evidence now point towards an important role of Lrrk2 in neuronal outgrowth and guidance (MacLeod et al., 2006; Plowey et al., 2008; Sakaguchi-Nakashima et al., 2007; van Egmond et al., 2008). Mechanistic studies have repeatedly observed increased kinase activity for the most common G2019S mutation, however the mode of action for the other mutations has remained conflicting (Greggio and Cookson, 2009). With the emergence of several rodent mutant LRRK2 models, in vivo insight into the mechanistic actions is now forthcoming. ROC domain mutant human R1441G BAC and R1441C knock-in mice both exhibit impaired dopamine release (Li et al., 2009; Tong et al., 2009), with additional behavioral and pathological abnormalities seen in the R1441G baterial artificial chromosome (BAC) mice. Mice over-expressing a murine LRRK2 BAC containing a G2019S mutation have also been shown to have decreased dopamine release whereas mice over-expressing a murine wild-type LRRK2 BAC have increased dopamine release and are hyperactive (Li et al., 2010). Inducible human G2019S and wild-type over-expressing mice, whilst absent of phenotype alone, both show synergistic effects when crossed with mutant A53T alpha-synuclein mice (Lin et al., 2009). Curiously, A53T mice on a murine LRRK2 knockout background have an ameliorated phenotype (Lin et al., 2009) whereas the kidneys of LRRK2 knockout mice accumulate alpha-synuclein (Tong et al., 2010). Interestingly, although extracellular dopamine release was not measured in LRRK2 knockout mice, in two independent lines levels of striatal dopamine were normal and the knockout mice are without overt brain phenotype (Andres-Mateos et al., 2009; Tong et al., 2010).
In this study we report human wild type (hWT) and mutant G2019S mice that were generated via BAC transgenesis. We have performed a comprehensive analysis of the dopaminergic system in these mice as well as behavioral and pathological analysis. We show that human kinase domain G2019S over-expressing mutants, like ROC mutants and murine G2019S BAC mutants, have reduced extracellular dopamine levels, which can be detected without pharmacological intervention. Importantly, we demonstrate that BAC mice over-expressing human wild type Lrrk2 also exhibit decreased extracellular dopamine levels, lending support to gain of function mechanism. Furthermore, we show that G2019S mice exhibit a number of age related changes in tau protein, including mislocalization and increased tau phosphorylation. We present novel biochemical data that suggests that the tau banding pattern is altered in G2019S mice compared to age matched controls. Finally, we show that G2019S mice, but not hWT mice, display anxiety like behaviors. Our results both support and extend data recently obtained in other LRRK2 models. The human G2019S and wild-type BAC mice will provide further insight into understanding basic mechanisms of LRRK2 biology and aid future therapeutic design.
METHODS
Animals
All animal procedures were approved by the Mayo Clinic Institutional Animal Care and Use Committee and were in accordance with the National Institute of Health Guide for the Care and Use of Laboratory Animals (NIH Publications No. 80-23) revised 1996.
Generation of BAC transgenic mice
A BAC (RP-11 568G5) was identified in silico to contain the entire human LRRK2 gene (NM_198578.3) and regulatory sequences, and was purchased from the Children’s Hospital Oakland Research Institute (Oakland, CA). Library RP-11 genomic DNA originated from human male blood and was cloned into vector pBACe3.6 (Osoegawa et al., 2001). BAC mutagenesis was used to generate Lrrk2 c.6055 G to A transition that encodes the Lrrk2 G2019S amino acid substitution. BAC DNA was isolated using standard alkaline purification. Integrity was confirmed by restriction mapping and pulse field analysis. For oocyte injection the final DNA pellet was dissolved in Tris-EDTA and diluted in sterile injection buffer (5mM Tris-HCl, pH 7.5, 0.05mM EDTA, 50mM NaCl. 0.1 mM polyamines (spermidine and spermine). Purified human wild-type (hWT) and G2019S BAC DNA at concentrations ranging from 1.5–5ng/μl was injected into FVB/N (Taconic, Germantown, NY) fertilized oocytes and transplanted into pseudo-pregnant ICR (Harlan, Indianapolis, IN) female mice. Subsequent offspring were genotyped by polymerase chain reaction (PCR) using two sets of primers designed within the vector arms and the human 5’ and 3’ insert, to identify founders. Transgenic founders were bred to FVB/N mice and transgenic F1 offspring analyzed for gene and protein expression.
Real time quantitative reverse transcriptase PCR
Mice were euthanized by cervical dislocation and brains were subsequently separated into different regions (olfactory bulb, hippocampus, striatum, cortex, mid-brain, brainstem, cerebellum) and frozen on dry ice. RNA was isolated using TRIzol® (Invitrogen, Carlsbad, CA,) according to manufacturer’s instructions. cDNA was synthesized using Superscript II (Invitrogen). Real time PCR assays were performed in triplicate on a 384 well plate using an ABI 7900 detection system to assess the relative level of human LRRK2 mRNA using TaqMan® probe Hs00417273_ml specific for human LRRK2 (ABI, Foster City, CA, USA). In addition, expression analysis was performed with murine probes to LRRK1 (Mm00713303_ml), LRRK2 (Mm00481934_ml), SNCA (Mm00447333_ml) and MAPT (Mm00521988_ml). In all instances murine GAPDH (Mm99999915_ml) was used as the endogenous reference gene.
In situ hybridization
Cartridge purified oligonucleotides were synthesized by Sigma Genosys (St Louis, MO, USA). Murine LRRK2 was detected with oligonucleotide designed to mouse exon 15 5’CTTGGTCATCTGGATACATCTGTAAGGTGTGGAGGACTGAGTCAACTGC’3 and human LRRK2 with oligonucleotide 5’TTTAAGGCTTCCTAGCTGTGCTGTCATCATGACTCTG’3 designed to human exon 41. 100ng of oligonucleotide was 3’ end labeled with 33P α-dATP (Perkin Elmer, Boston, MA, USA) using Terminal Transferase (Roche, Indianapolis, IN, USA). Labeled oligonucleotides were purified using Nick columns (Amersham, Piscataway, NJ, USA) to remove unincorporated probe and the specific activity checked to ensure a minimum of 1×10⁸ cpm/μg.
15μm coronal frozen cryostat sections were fixed in cold 4% paraformaldehyde in Sörensen’s phosphate buffer, dehydrated in ascending alcohols and incubated at 37°C overnight in hybridization buffer (4x Standard sodium citrate, 50%(w/v) formamide, 10%(w/v) dextran sulfate, 200mg/μl Herring Sperm DNA) containing 33Pα-dATP labeled oligonucleotides. Competition hybridizations performed in the presence of excess unlabeled probe served as an additional control for each oligonucleotide. Slides were stringently washed three times in 1X SSC at 55°C and exposed to Kodak MS high-resolution film (Eastman Kodak via Fisher Scientific, Rockford, IL) for 10–14 days.
Antibodies
Affinity purified rabbit polyclonal antibody PA0362 (C-terminal amino acid residues 2507–2527, Novus Biologicals, Littleton, CO, # 110-58771) was raised to synthetic human Lrrk2 peptides (Melrose et al., 2007). For immunohistochemistry on tissue sections tyrosine hydroxylase (TH) (1:200, Affinity Bioreagents/ ThermoFisher Scientific Rockford, IL) was used to visualize dopamine neurons. Detection of α-synuclein was with mouse monoclonal α-synuclein (clone 42, 1:3500, BD Transduction Labs, San Jose, CA) and the α-synuclein phosphorylated at Ser129 antibody (1:1000) was a kind gift from Dr. Takeshi Iwatsubo, University of Tokyo. Activated microglia were detected by Iba-1 (1:2000, Wako Chemicals, Richmond, VA). Tau antibodies were CP-13 (1:1000 immunohistochemistry, 1/200 immunblots), Tau-5 (1/ 500 immunoblots) and PHF-1 (1/500 Immunoblotting) all kind gifts from Dr. Peter Davies, Albert Einstein College of Medicine), 12E8 (1:10,000 immunohistochemistry) gift from Dr. Peter Seubert, Elan Pharmaceuticals) and Tau-1 (1/500 Immunoblots (from Millipore, Billerica, MA).
Lrrk2 Immunoblotting
For the analysis of Lrrk2 protein, 5 volumes (V/m) of homogenization buffer (50mM Na2PO4, 10mM Na4P2O7.10H2O, 20mM NaF, 2mM EGTA, 2mM EDTA, 2mM Na 3VO4, 2mM DTT, protease inhibitor cocktail (Sigma, St. Louis, MO) and phosphatase inhibitor cocktails I and II (Sigma) were added to one volume of freshly dissected tissue. Samples were then homogenized and centrifuged at 12,000×g for 5 minutes at 4°C. The supernatant corresponding to the cytosolic fraction was collected and the concentration determined using BCA protein assay reagents (Pierce Biotechnology, Inc/ThermoFisher Scientific Rockford, IL). Samples were denatured in sodium dodecyl sulphate sample buffer before being resolved on a 3–8% Tris-acetate gel (Invitrogen). Blots were blocked in 5% non-fat milk in Tris buffered-saline-Tween and probed with primary antibody overnight at 4°C (PA0362 1:500). After incubation with the appropriate conjugated secondary antibodies, bands were visualized using enhanced chemiluminescence (Pierce Biotechnology).
Tau immunoblotting
Lysate preparation and immunoblotting were as described above except brain tissue was harvested by craniotomy under deep anesthesia with 120mg/kg ketamine and 20mg/kg xylazine cocktail to preserve phosphorylation and samples were resolved on 10% Tris-glycine gels (Invitrogen). To dephosphorylate tau, 100μg of cortical lysate was incubated for 1 hour with 10 units/μl of calf alkaline phosphatase (Sigma).
Stereology
Brains from 22–24 month old hWT (n=5 male), G2019S mice (n=4 male), and a combined group of age matched NT mice from each line (n=5 males) were post-fixed in 4% paraformaldehyde (PFA) for 24 hours followed by 30% sucrose cryoprotection for 48 hours. Brains were sectioned exhaustively at 50μm thickness using a freezing sledge microtome. For dopamine neuron estimates, after a random start, every third section was stained free floating with TH antibody. Free floating immunostaining was performed utilizing the VECTASTAIN® ABC System (Vector laboratories, Burlingame, CA). Sections were mounted onto glass slides, allowed to dry overnight, lightly counterstained with cresyl-violet and then dehydrated and cover slipped. Quantification was performed at high magnification (400X) using the optical fractionator probe in Stereo Investigator software (MicroBrightField Williston, VT). Statistical analysis was performed using GraphPad Prism (Version 3).
High performance liquid chromatography
Frontal sections (250μm) were prepared in a cryostat from the frozen brains from G2019S mice (n=10; 4 females, 6 males) and littermate non-transgenic (NT) controls (n=10; 5 males, 5 females) as well as hWT mice (n=7, 5 female, 2 males) and littermate NT controls (n=10, 5 male, 5 female). One 14 gauge tissue punch was collected from the striatum of every other section (the most rostral section at 1.54 from Bregma) for a total of three samples for each brain according to a modified version of the method of Palkovits (Palkovits, 1973). Samples were placed in 100μl of tissue buffer (0.2N perchloric acid with 100mg/ml sodium metabisulfite) and stored at −80 C until neurochemical analysis. All samples were thawed on the day of analysis, sonicated with 3 one-second bursts and centrifuged at 10,000rpm for 1 minute. The supernatants were removed and analyzed for dopamine, 3,4-dihydroxyphenylacetic acid (DOPAC) and homovanillic acid (HVA) content using high performance liquid chromatography coupled with electrochemical detection (HPLC-EC) (Lindley et al., 1990). The amounts of monoamines/metabolites in the tissue samples were determined by comparing peak area values (as determined by a Hewlett Packard Integrator, Model 3395, Hewlett Packard, Palo Alto, CA) with those obtained from external standards run on the same day. Neurochemical concentrations were determined by normalizing samples to protein concentrations obtained from the pellets (BCA method). Data was plotted (mean ± SEM) and statistically analyzed using Mann Whitney non-parametric comparisons in GraphPad Prism® software (GraphPad Software, La Jolla, CA).
Microdialysis
hWT (n=8; 5 females, 3 males), G2019S (n=11; 6 males, 5 females) and a combined group of age matched NT mice from both lines (n=9; 4 males, 5 females) aged 8–10 months were anesthetized with 100mg/kg ketamine and 10mg/kg xylazine. Guide cannulae (CMA Microdialysis Inc., Acton, MA, USA) were surgically implanted into the striatum using a standard stereotaxic frame (Kopf Instruments, Tujunga, CA) utilizing coordinates (from Bregma anterior-posterior 0.1cm, lateral-medial 0.2cm, dorso-ventral 0.2cm) according to the Paxinos and Franklin Mouse Atlas (Paxinos and Franklin, 2001). Mice were allowed to recover for at least 24 hours. Microdialysis experiments were carried out on conscious, freely moving mice with surgically implanted guide cannulae. On the day of the experiment, the stylet in the guide cannula was replaced with the microdialysis probe (CMA/7 with 2 mm membrane, CMA Microdialysis Inc). The probe was perfused at 2μl/min with artificial cerebrospinal fluid (145mM NaCl, 1.2mM CaCl2, 3mM KCl, 1.0mM MgCl2) for a two hour equilibration period before collection. Dialysate samples were automatically collected every 20 minutes into vials containing 2μl perchloric acid (0.5M) to retard oxidation of monoamines. Four baseline collections were taken at twenty minute intervals, and a subcutaneous injection of 2mg/kg amphetamine was given 9 minutes into the fourth collection. This sub-threshold dose was chosen based on prior experiments in FVB/N mice of 8–10 months of age. In general the response in old FVB/N mice to amphetamine was modest, which is consistent with reported strain variations and age related reductions in in vivo dopamine release in rodents (Ebel et al., 1987; Nakano and Mizuno, 1996; Puglisi-Allegra and Cabib, 1997; Ventura et al., 2004). Following amphetamine treatment, six subsequent samples were collected every 20 minutes for a further 120 minutes. Samples were analyzed by HPLC for dopamine content. Data was plotted (mean ± SEM) and statistically analyzed using Mann Whitney non-parametric comparisons in GraphPad Prism® software (GraphPad Software, La Jolla, CA).
Dopamine D1 and D2 receptor autoradiography
To assess striatal dopaminergic receptor density, 18 month old G2019S (n=9; 3 female, 6 males) and NT littermates (n=11; 6 females, 5 males) and hWT (n=9, 3 female, 6 male) and NT littermates (n=4, 3 females, 1 male) were analyzed using autoradiographical methods similar to that described by Piggott (Piggott et al., 1999). Hemi-brains were coronally sectioned 14μm thick throughout the whole striatum, such that each slide contained 9 sections that represented the striatum rostral to caudal. Serial slides were used for D1 and D2 autoradiography and dopamine transporter (DAT) immunostaining (see below). Cryosections were incubated in pre-incubation buffer (50mM Tris-HCl, pH7.4) for 15 minutes at 4°C then incubated with radioligand diluted in incubation buffer (50mM Tris-HCl pH 7.4, 120mM NaCl, 5mM KCl, 2mM CaCl2, 1mM MgCl2 and 100nM ketanserin to block 5-HT sites). For D1 receptors incubation was with 1nM [3H] SCH 23390 (Amersham, Little Chalfont, UK) for 90 minutes at room temperature with non-specific binding defined by 10μM fluphenazine. For D2 receptors incubation was with 2nM [3H] methylspiperone (NMSP, Amersham) for 90 minutes at room temperature with non-specific binding defined by 10μM haloperidol. Following incubations, slides were washed 3 times for 3 minutes each in 50mM Tris-HCl, pH7.4 at 4°C, followed by a dip in ice-cold distilled water. Slides were air dried overnight and exposed to BioMax MR film with tritium Microscales (Amersham) for 3–4 weeks. Quantitative densitometry was performed using the MCID Elite system (InterFocus Imaging Ltd, Cambridge, UK). Since non-specific binding was absent for both D1 and D2 receptors in the striatum, average film background was subtracted from measured values and data was plotted as density in nCi/mg (mean ± SEM). Data was statistically analyzed using Mann Whitney non-parametric comparisons in GraphPad Prism® software.
DAT immunostaining and Image Analysis
Frozen 14μm cryosections (described above) were dried for 5 minutes and then fixed for 10 minutes in 10% buffered formalin and washed twice for 5 minutes in PBS before staining. Immunohistochemistry was performed using the DAKO Autostainer (DAKO, Carpinteria, CA). Tissue was endogenously quenched in 0.03% H2O2 and blocked in Dako All-purpose blocking solution for 30 minutes. Primary antibody was incubated for 45 minutes at room temperature. The secondary antibody was from the Envision+ System Labeled Polymer HRP anti-rabbit (Dako), followed with 3,3′-diaminobenzidine tetrahydrochloride (DAB) substrate (Dako). Immunostained slides were digitally captured using Aperio Scan Scope Analysis Package (Aperio, Vista, CA) and the intensity of immunostaining was quantified using the Aperio ImageScope package. Data was plotted (mean ± SEM) and statistically analyzed using Mann Whitney non-parametric comparisons in GraphPad Prism® software.
D2 Autoceptor analysis
hWT, G2019S and a combined group of age matched NT mice from both lines (n=5 male per group) were treated with the D2 receptor antagonist raclopride (1.0mg/kg, i.p.; Sigma) or saline and killed by cervical dislocation 30 minutes later. Striatal tissue punches were processed for HPLC and western blotting analysis with TH and pTH antibodies.
Pathological analysis
At least six mice from each line were analyzed per timepoint. Paraffin embedded tissue sections were dewaxed in xylene and rehydrated in descending alcohols and water. For antigen retrieval in paraffin sections, tissue was pressure cooked (10 minutes) in distilled water (all antibodies, except α-synuclein). Appropriate disease/tissue positive controls were included for each antibody (diffuse lewy body disease for α-synuclein, Alzheimer for tau antibodies, Alzheimer/vascular dementia for Iba-1, tonsil tissue for caspase-3). Immunohistochemistry was performed using the Dako Autostainer. Tissue was endogenously quenched in 0.03% H2O2 and blocked in Dako All-purpose blocking solution for 30 minutes. Primary antibody was incubated for 45 min at room temperature. All secondary antibodies were from the Envision+ System Labeled Polymer HRP anti-rabbit (Dako), followed with DAB substrate (Dako). Sections were lightly counter stained in Gills 3 hematoxylin.
Behavioral testing
hWT (n = 10, 5 males, 5 females), G2019S BAC (n=10; 5 males, 5 females) and a combined group of NT from both lines (n= 12; 5 males, 7 females) were transferred to the behavioral lab at the age of 7–8 months and allowed to acclimate to the reversed 12:12-hour light/dark cycle (lights off at 07:00 hour) for 2 weeks. During that period, the mice were handled daily and their body weight was recorded once per week. Food and water were available ad libitum.
A battery of behavioral tests, including an open-field, beam crossing, and negative geotaxis were carried out in the listed order. Inked footprint analysis was performed in a separate cohort of mice (see below). The open field test was carried out in a circular arena (120 cm in diameter) made of white plastic. Two sets of 40W lights (3 per wall) directed at the ceiling provided ambient light in the room with the light intensity at the surface of the arena of 65 lux. A novel object, a plastic, 15 cm tall, 10 cm in diameter bottle painted with black and white stripes was placed in the centre of the arena. The test was administered once. A mouse was placed near a wall of the arena and was allowed to explore it for 300 seconds. The movement of mice in the arena was recorded by a video camera suspended 2.5 m above the centre of the pool and connected to a video tracking system (HVS Image Advanced Tracker VP200, HVS Image, Buckingham, UK) and a PC computer running HVS software. The following behavioral measures were recorded and analysed: latency to start exploration, the total duration of search path, thigmotaxic exploration along the wall of the arena, % of time exploring an inner zone of the arena, % of time of active walking and immobility, the latency of object approach, the time spent on object exploration, search path tortuosity and average left and right turns during exploration. Despite its simplicity, the open field behavior has to be carefully analyzed due to inter-relations of its measures. Therefore, in order to decrease the probability of obtaining a false positive results, the analysis of data was preceded by the examination of a correlation matrix of all variables and the redundant variables were removed and the final analysis and interpretation of data was based on the activity level and path length, areas of the arena explored, the quality of path exploration and the object exploration.
Deficits in limb coordination and accuracy of limb placement, as well as general motor coordination of the mice was evaluated in the beam crossing test (Allen et al., 2003). In the test a mouse has to walk across a narrow beam to reach a home cage. The difficulty to traverse a 120 cm beam was increased by placing small obstacles 10 cm apart on a beam (0.5 × 0.5 cm). The beam was suspended 50 cm off the ground (with cloth below it to cushion a fall) and 2 home cages were available on each side of the beam. A mouse was placed in the middle of a beam and allowed to walk to one of the cages. The only illumination of the room was provided by a red fluorescent light yielding a light intensity on the beam of 20 lux. Two sessions were performed, one per day, with 2 trials each for all mice. A 2.5 cm wide beam was used during the first session, and during the 2nd session the task difficulty was increased by using a narrower, 1.9 cm wide beam. Maximum time allocated to each trial was 120 seconds. The latency to move and to reach the goal box, the time of active walking, inactivity and number of turns on a beam and number of falls during each trial were recorded.
Negative geotaxis test was carried out by placing a mouse on a horizontally held large wire grid which then was raised and slowly inclined to an angle of 70–80° with an animal facing a floor. Negative geotaxis response (turning and climbing up the grid) was recorded.
Data was analyzed using a factorial model analysis of variance (ANOVA) using genotype and cohort as “between subjects”, and days of testing as “within subject” (repeated measure). While performing all repeated measures ANOVAs, departures from the assumption of compound sphericity were evaluated by Mauchly sphericity test (SPSS statistical package (SPSS Inc. Chicago) version16 run on a Macintosh computer) with α-level set to 0.05. In cases when sphericity was significantly violated, degrees of freedom were adjusted by Greenhouse-Geisser ε-correction. Post-hoc analyses were performed using Bonferroni or Dunnett’s corrections. To identify gait disturbances G2019S mice (n=10; 5 males, 5 females), hWT (n=10; 5 males, 5 females) and a combined group of NT controls from both lines (n=12; 5 males, 7 females) were trained to walk through a Perspex alley to a darkened cage (Fleming and Chesselet, 2006). Paper was then placed in the alley and fore- and hind-paws painted with different color of non-toxic paint. Paw prints were recorded and the stride length determined by the distance between the fore and hind paw prints. Stridelength distances were plotted in Graphpad Prism® and G2019S, hWT and NT mice compared using one-way ANOVA with Dunnett’s correction (GraphPad Software, La Jolla, CA).
RESULTS
Generation of Human LRRK2 wild type and G2019S BAC mice
The F1 offspring from transgenic hWT and G2019S founders were characterized for LRRK2 expression and full length human LRRK2 cDNA transcript was found in one hWT and in four G2019S BAC lines. The data for G2019S mice presented in this manuscript are from the highest expressing G2019S line. The presence of the G→A base change was confirmed in human LRRK2 cDNA isolated from G2019S mice (Figure 1A). Regional localization of transgenic mRNA with a Taqman human specific probe (Figure 1B) and finer anatomical mapping via in situ hybridization with mouse and human specific LRRK2 probes revealed that anatomical expression pattern of the human LRRK2 transgene resembled endogenous mouse LRRK2, albeit with higher transgene expression in the hippocampus (Figure 1C). Lrrk2 protein expression was assessed using an in-house specific antibody PA0362 (Melrose et al., 2006) and confirmed protein expression in both hWT and G2019S transgenic lines in most brain regions (Figure 1D). To determine relative expression levels, extracts of half brain from NT, hWT and G2019S animals were immunoblotted with Lrrk2 antibody. Assuming the relative affinity of PA0362 to mouse and human Lrrk2 protein is comparable, in half-brain extracts the G2019S transgenic line was found to have ~2.5-fold protein expression over endogenous mouse Lrrk2 while the hWT line had ~ 3.5-fold protein expression (Supplemental Figure 1A,B). In all of the transgenic LRRK2 lines we generated, the human promoter drove the highest expression levels in the hippocampus. In hippocampal lysates human Lrrk2 protein levels were ~14 fold over murine levels for G2019S and ~20-fold for the hWT line (Supplemental Figure 1C,D).
Figure 1.
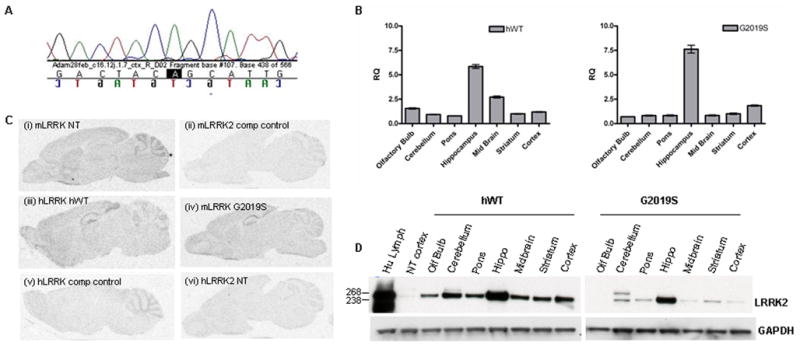
(A) Confirmation that transgenic mRNA contains the G2019S mutation. RNA was extracted from F1 G2019S transgenic mouse brain, cDNA synthesized and sequencing with human specific primers to LRRK2 exon 41 performed (the G to A transition highlighted in black).
(B) Real time PCR to examine regional expression of human mRNA expression in transgenic mice. Real-time PCR was performed with ABI (gene human LRRK2 specific TaqMan® probe Hs00417273_ml using mouse GAPDH (Mm99999915_ml) as the endogenous reference gene. Data is plotted as mean ± SEM.
(C) In situ hybridization reveals resemblance between endogenous murine LRRK2 expression and transgenic expression. (i) Murine LRRK2 was visualized with a probe to mouse exon 15 in NT mice. (ii) Excess unlabeled probe was used as control. (iii) Human LRRK2 in hWT (iv) G2019S mice was visualized with a probe to human exon 41. (v) Excess unlabeled exon 41 probe on transgenic mouse section was used as an additional control. (vi) Specificity of the human probe was confirmed by the absence of signal in NT mice.
(D) hWT and G2019S transgenic mice expression human Lrrk2 protein in multiple brain regions. Human Lrrk2 transgenic protein expression in the hWT line and the highest expressing G2019S line was evident throughout the mouse brain. 50μg of protein lysate was loaded per sample and following electrophoresis, membranes were immunoblotted with antibody PA0362. Human lymphoblast was used as a positive control. GAPDH antibody was used as a loading control.
To determine if any compensatory mRNA changes were occurring, a mouse specific LRRK2 probe was used to measure endogenous murine LRRK2 expression in transgenic, versus non-transgenic mice. Murine LRRK2 expression remained consistent in all brain regions in G2019S and hWT transgenic brains compared to non-transgenic (NT) littermates (Figure 2). Similarly, no compensatory mRNA changes were observed in the LRRK2 paralog LRRK1, nor for SNCA and MAPT, two other genes implicated in PD (Figure 2).
Figure 2. Endogenous LRRK1, LRRK2, SNCA and MAPT levels unchanged in hWT and G2019S BAC mice.

No compensatory changes are observed in the expression levels of murine LRRK1, LRRK2, α-synuclein (SNCA) or tau (MAPT) genes in G2019S mice compared to non-transgenic littermates. Real-time PCR was performed with ABI TaqMan® probes to murine (A) LRRK1 (Mm00713303_ml), (B) murine LRRK2 (Mm00481934_ml), (C) murine SNCA (Mm00447333_ml) and (D) murine MAPT (Mm00521988_ml). Mouse GAPDH (Mm99999915_ml) as the endogenous reference gene. Data is plotted as mean ± SEM.
Dopaminergic system characterization
The loss of striatal dopaminergic terminals and substantia nigra dopamine neurons is a prominent feature of both LRRK2-associated and idiopathic PD. Stereological counts of TH positive neurons in the substantia nigra in aged hWT and G2019S mice (22–24 months) and age matched NT controls revealed no differences (neuronal estimates were NT = 8254 ± 732, hWT 8134 ± 262 and G2019S 8374 ± 317, Figure 3). Despite the apparent preservation of dopamine neurons in the transgenic mice, we hypothesized that axon terminal dopamine neurochemistry may still be altered. The concentration of dopamine and metabolites DOPAC and HVA was measured by HPLC in tissue punches from the striatum in hWT, G2019S and NT littermates mice aged 18 months. No significant differences were detected between transgenic and NT mice for dopamine nor its metabolites (Supplemental Figure 2), and correspondingly turnover ratios were comparable (data not shown).
Figure 3. Stereological estimates of TH neurons in the substantia nigra reveal no differences between NT, hWT and G2019S mice.

Counting was performed using the optical fractionator probe in tissue processed for TH staining from hWT, G2019S and NT mice aged 22–24 months. (A) TH immunostaining in the nigra of NT, hWT and G2019S mice (B) Neuronal estimates in NT, hWT and G2019S mice. Data is plotted as mean ± SEM.
To further investigate the intact dopaminergic system in vivo, and in particular to measure extracellular dopamine levels, we performed microdialysis in hWT, G2019S BAC and age matched NT controls from each line. Extracellular dopamine levels were measured before and after amphetamine challenge. Amphetamine raises extracellular dopamine levels by inducing calcium-independent dopamine efflux via reverse transport through DAT and by inhibiting dopamine re-uptake (Schmitz et al., 2001). Remarkably we found that baseline dopamine levels were significantly lower (~66%) in hWT (mean ± SEM 2.95±0.23 p<0.0001) and in G2019S BAC mice (~33%, mean 4.96 ± 0.67 pg/μl, Mann Whitney p<0.002) compared to NT controls (7.36 ± 0.76 pg/μl) (Figure 4A). Conversely, the average dopamine levels following amphetamine challenge were comparable in the three groups (hWT 12.37±1.44, G2019S 12.13 ± 1.58 pg/ul and NT 10.31 ± 1.75 pg/μl, Figure 4A). When the post-amphetamine challenge levels for each animal were normalized to the average of their individual basal dopamine levels (i.e. % response) a significant difference was observed between the response in hWT (454 ± 119 % p<0.008) and G2019S BAC (397 ± 85 %, p<0.05) compared to NT controls (156 ± 21 %) after twenty minutes (Figure 4B). These data suggested that while basal dopamine levels were lower in hWT and G2019S mice, reverse transport of dopamine induced by amphetamine was intact. Likewise, this also confirmed that the deficits in extracellular dopamine levels were not due to reduced availability of dopamine stores.
Figure 4. In vivo microdialysis reveals significantly lower baseline levels of dopamine and elevated response to amphetamine in hWT and G2019S transgenic mice.

(A) Dopamine levels pre and post amphetamine treatment in hWT and G2019S mice versus NT. Dopamine levels were measured by HPLC from microdialysis samples collected from the striatum. (B) % response plots for NT, hWT and G2019S following amphetamine challenge. Dopamine levels were measured by HPLC from microdialysis samples collected from the striatum and plotted as a percentage of each individual animals mean baseline levels to compare response over time.
Data is plotted as mean ± SEM. * p<0.05, ** p<0.01, ***p<0.001 Mann Whitney Test.
Given the lower basal levels of extracellular dopamine levels in the striatum in hWT and G2019S BAC mice compared to NT controls, we hypothesized that compensatory post-synaptic changes may occur over time in striatal dopamine receptors. We thus determined the density of dopamine D1 and D2 receptors in striatum by quantitative autoradiography on tissue sections from 18 month old hWT, G2019S BAC and NT control mice. A modest 11% increase (P<0.01) was observed in D1 receptor density in hWT mice compared to NT controls (mean ± SEM for hWT 48.38 ± 0.85 and NT 42.98 ± 1.89, Figure 5A) however whilst there was a trend towards increased D1 receptors in the G2019S mice, it did not achieve significance (Figure 5B). Similarly, a trend towards increase D2 receptors existed for both hWT and G2019S mice compared to controls but this was not significant (Figure 5C and D). Quantitative DAT immunohistochemistry results suggested no differences in either hWT, nor in G2019S to NT controls (Fig 5E and F) although this does not rule out alterations in DAT activity or cellular localization of the receptor.
Figure 5. A modest compensatory increase is observed in Dopamine D1 receptors in hWT but not G2019S mice, whereas D2 receptors and DAT levels remain unchanged in hWT and G2019S mice.

Quantitative autoradiography was performed with (A, B) D1 receptor ligand [3H] SCH 23390 and (C, D) D2 receptor ligand [3H] methylspiperone in serial striatal sections. (E, F) Quantitative immunohistochemistry with anti-DAT antibody. Data is plotted as mean ± SEM. ** p<0.01
One of the feedback mechanisms in nigro-striatal neurons is D2 autoreceptor mediated inhibition of synthesis and release. It is well known that antagonizing pre-synaptic D2 autoreceptors can remove this feedback inhibition, and cause increased synthesis as well as release of dopamine (Shi et al., 2000). In order to determine whether the observed extracellular dopamine differences in transgenic BAC mice was due to differential function of D2 receptors, hWT and G2019S BAC mice were treated with the D2 receptor antagonist raclopride, sacrificed 30 minutes later and dopamine and its metabolites measured. As expected, dopamine turnover, as measured by the ratio of dopamine metabolites to stores of dopamine (DOPAC/dopamine and HVA/dopamine) increased dramatically following treatment with raclopride (Supplemental Figure 3). Furthermore, there was a significant increase in levels of serine-40 phosphorylated TH after raclopride treatment, indicating increased synthesis (data not shown). However, there was no difference in this response between hWT or G2019S BAC transgenic and NT littermates suggesting that autoreceptor-mediated feedback is normal in these mice.
Neuropathological Analysis
To assess mice for neuropathological changes we examined LRRK2 transgenic mice aged up to 24 months using immunohistochemistry with neurodegenerative markers commonly observed in PD. No abnormalities in α-synuclein, phosphorylated pSer129 α-synuclein, nor in caspase-3 were observed (data not shown). In contrast, analysis with phospho-tau antibodies revealed that aged G2019S BAC (18–24 months) accumulate phosphorylated tau at epitopes pSer202 (CP-13) and pSer262/356 (12E8) (Figures 6 and 7). The alterations in tau were not present in mice aged 6 or 12 months (data not shown). In aged G2019S mice, phospho-tau immunoreactivity was observed in the neuropil and in cell bodies in several regions throughout the brain, including cortical regions (Figure 6A,C), particularly the parietal association area, pre-limbic, medio-orbital, frontal association, cingulate and somatosensory cortices. In addition reactivity was also observed in hippocampus (Figure 6C), hypothalamus, amygdala and locus coeruleus. Moderate to heavy staining was also noted in white matter fibers in the thalamus, hypothalamus, striatum and midbrain, as well as tracts in the pontine base and medulla (Figure 7). In the hippocampal area phospho-tau pSer 262/356 positive staining was observed in non-neuronal cells that morphologically resembled oligodendroglia (Figure 6C). In general the immunostaining was more robust with the pSer 262/356 antibody compared to the pSer 202 antibody. Iba-1 staining for microglia revealed increased activation in the hippocampus of G2019S mice (Figure 6B), however in other regions of the brain, even those with tau alterations, microglial activation was not remarkable.
Figure 6. Aged G2019S mice have increased tau phosphorylation and microglial staining compared to age matched NT controls.

Immunohistochemistry was performed on paraffin embedded sections using phospho-tau antibodies CP-13 (pSer202) and 12E8 (pSer262/365). (A) Low power images of NT and G2019S mice (B) Upper panel: low power image of microglial staining in the hippocampus of G2019S and NT mice. Lower panel: Higher power image to demonstrate the activated morphology of microglia in G2019S mice (C) CP-13 and 12E8 staining in upper panel is dentate gyrus (DG) interneurons, middle panel CA2 region of hippocampus (arrow denotes tau immoreative glia) and lower panel the cortex of G2019S and NT mice. Scale bars 25μm.
Figure 7. Aged G2019S mice have increased tau phosphorylation in the striatum and brainstem compared to age matched NT controls.

Immunohistochemistry was performed on paraffin embedded sections using phospho-tau antibodies CP-13 (pSer202) and 12E8 (pSer262/365). (A) in the striatum and (B) the brain stem at the locus ceruleus. Scale bars 25μm.
To further determine the nature of the tau species, we performed western blot analysis with brain lysates from G2019S mice (18–24 months) and age matched NT mice with the pSer202 (CP-13) antibody and pSer396/404 (PHF-1), a phospho-epitope that is normally present in mice in white matter and gray matter (Hernandez et al., 2003). At pSer 202 epitope the most marked differences were observed in the cortex and the hippocampus, corresponding to the regions of highest transgenic expression (Figure 8A). However increased levels of pSer396/404 could be detected in most brain regions (Figure 9A). Following normalization to GAPDH, quantitative analysis for the pSer 202 antibody revealed that the upper ~60kDa band was around two-fold more abundant in G2019S compared to aged matched NT controls in both cortex and hippocampus, whereas the lower ~50kDa band was only slightly elevated. When the upper and lower bands were plotted as a ratio, in both cortex and hipocampus the ratio of the upper band to the lower band was at least 2.5 fold higher in G2019S compared to NTs (Figure 8B). Similarly, for the pSer396/404 epitope, the ratio of the middle ~55kDa to lower ~50 KDa bands, in the striatum, hippocampus, midbrain, cortex and cerebellum, was around 3 fold higher in G2019S compared to NTs (Figure 9B). To determine whether these alterations were due to differences in total tau, immunoblots were run with tau-5, which reacts with phosphorylated as well as non-phosphorylated forms of tau (Figure 9A). The banding pattern of total tau was visibly different between G2019S and NT controls, and in particular the two doublet bands around 50 and 55 kDa were altered in G2019S samples. Upon quantitative analysis it was apparent that the ratio of these two bands was altered in G2019S mice, such that in NT mice the ~50KDa species tended to be more prominent but in G2019S mice the ~55 kDA species tended to be equal or more abundant. When plotted as a ratio of middle/lower band, G2019S mice had at least two fold higher ratios than NT mice for striatum, hippocampus, cortex and midbrain (Figure 9B).
Figure 8. Immunoblotting with CP-13 antibody reveals that increased levels of phospho-tau, but not hyperphosphorylated tau, are present in G2019S mice.

Lysates were prepared from 18–22 month old G2019S mice sacrificed by craniotomy to preserve phosphorylation.
(A) CP-13 (pSer202) immunoblot from cortical and hippocampal lysates. JNP3L mice that overexpress tau-P301L (Lewis et al., 2000) were used as a positive control for hyperphosphorylated tau. Arrows denote bands of interest for quantification.
(B) Quantitative analysis of immunoblots. The average ratio of the bands of interest (indicated by arrows) of the two mice analyzed for each region was plotted as mean ± SEM.
Figure 9. Immunoblotting with Tau-1 and PHF-1 antibodies reveals that the ratio of tau species is altered in G2019S mice.

(A) PHF-1 (pSer396/404) and Tau-5 (total tau) and immunoblots from multiple brain regions. Arrows denote bands of interest for quantification.
(B) Quantitative analysis of immunoblots. The average ratio of the bands of interest (indicated by arrows) of the two mice analyzed for each region was plotted as mean ± SEM.
We next asked whether the tau alterations were still apparent after dephosphorylation, hypothesizing that a shift in species composition might affect propensity for phosphorylation. Focusing just on the cortex, since it is a region of high Lrrk2 expression and pronounced tau changes, we compared untreated samples with samples dephosphorylated by enzymatic treatment with alkaline phosphatase. We utilized Tau-1, which has a preference for non-phosphorylated tau in axons before enzymatic treatment, but recognizes astrocytes, perineuronal glial cells, as well as axons, cell bodies and dendrites of neurons following enzymatic desphosphorylation (Papasozomenos 1987). The banding pattern for tau-1 in untreated samples (and thus predominantly axonal tau) was identical in NT and G2019S samples, suggesting that axonal tau levels and species composition were unaltered (Figure 10A). However, following dephosphorylation, the tau-1 banding pattern was different between NT and G2019S mice, with a more prominent ~65KDa band appearing in G2019S mice (Figure 10B,C) and a tendency for a shift in the relative intensity between the bands at ~60 and 62kDa (Figure 10D). These results suggest that non-axonal tau species composition is different in G2019S mice and furthermore, because the samples are dephosphorylated, the tau species changes cannot be due to phosphorylation, but instead must be another post-translational modification.
Figure 10. Tau species composition is altered following desphosphorylation in G2019S mice.

(A) Immunoblot with tau-1 antibody in non-treated (−) and dephosphorylated (+) samples. Arrows denote the heavier upper band around 65kDa. Control “R” denotes human recombinant tau isoforms (recombinant murine isoforms were not available). Of note adult mice produce only 4-repeat tau.
(B) Example to show how the bands were measured for quantification.
(C) Histogram plots from Image J analysis package show the appearance of an additional peak in the G2019S samples.
(D) Graphical representation of the tau-1 immunoblots. The mean intensity of the bands of interest of the two mice analyzed for each region was plotted as mean ± SEM.
Immunohistochemical analysis of hWT mice, despite their higher transgenic expression levels, revealed only modest increases pSer 262/356 (Figure 11), these changes being restricted to the hippocampal area where both cell bodies and processes were immunopositive. Western blotting with tau antibodies did not reveal any remarkable differences (data not shown).
Figure 11. Modest increases in tau immunostaining were observed in hWT mice in hippocampus.

Upper panel shows CP-13 (pSer202) immunostaining in NT and hWT mice. Lower panel shows 12E8 (pSer 262/365) immunostaining in NT and hWT mice. Scale bars 25μm.
Behavioral Analysis
We characterized hWT, G2019S and a combined age matched NT controls from each line in a battery of behavioral tests, which included motor abilities (beam-crossing test, inked footprint analysis), reactivity to sensory stimulation (negative geotaxis test) and evaluation of general exploratory activity (open-field test). In the beam test, hWT showed a comparable performance to age matched NT controls when crossing both wider and narrower beams (Supplemental Figure 4A). G2019S mice tended to reach the goal cage faster than NT controls, however this was not statistically significant. There was no difference in latency to move, nor in the number of falls from the beam for either hWT or G2019S mice when compared to NT controls (data not shown). In the geotaxis test all mice climbed up the inclined wire grid against the force of gravity indicating comparable motoric, postural and vestibular responses between the genotypes, which substantiated the absence of falling off the beam during the beam crossing test (Supplemental Figure 4B). Inked footprint analysis revealed similar stride-lengths between NT control mice and hWT and G2019S transgenic mice (Supplemental Figure 4 C,D).
In the open field test, hWT and NT mice had comparable exploratory profiles, however G2019S mice showed significantly longer exploratory path (p <0.006) compared to NT mice (Figure 12A). Although overall activity levels were not altered (61.64% ± 6.29 NT and 66.72% ± 7.69 G2019S Figure 12B), the G2019S mice showed a trend (p = 0.056) towards greater thigmotaxis (mean ± SEM 55.73 cm ± 8.50 for NT and 80.17 ± 5.84 for G2019S, Figure 12C) searching the arena persistently in the close vicinity of the wall, as well as a tendency to taking less turns (tortuosity was 157.1 °/m ± 53.0 for NT versus 80.1 °/m ± 9.6 path for G9019S mice, Figure 12D) and spent less time exploring the central zone of the arena (4.49% ± 1.72 for NT versus 1.43%, ± 0.77 for G2019S, Figure 12E) including the novel object (2.07% ± 0.89 NT versus 0.93 ± 0.49 G2019S, Figure 12F). Post-hoc analysis revealed that the G9019S mice showed significantly faster walking speed (p < 0.05) in the arena (0.25 m/s ± 0.02 SEM) than NT mice (0.18 m/s ± 0.02 respectively). Taken together our data indicate that while performance for sensory and motor tasks appear equivalent in NT, hWT and G2019S mice, when placed in a novel environment, the G2019S mice exhibit reduced exploratory behaviors, which may be indicative of fear or anxiety.
Figure 12. Open Field Test reveals abnormal exploratory behavior in G2019S mice.

(A) Mean path length in G2019S was found to be significantly different from NT and hWT mice (p<0.006). (B) Overall activity in hWT and G2019S mice was comparable to NT controls. (C) G2019S mice display and almost significant trend towards increased thigmotaxis (wall hugging) tending to (D) take less turns than hWT and NT mice (E) spend less time in innermost zone and (F) at the novel object.
DISCUSSION
Our data indicate that over-expression of human wild type LRRK2 significantly reduces extracellular dopamine levels in the striatum. Likewise, the reduction in extracellular dopamine levels (~33%) in our G2019S mice complements findings in mutant R1441G BAC transgenic mice (Li et al., 2009) which exhibit a 35% decrease in extracellular dopamine compared to NT following administration of the DAT blocker nomifensine. This is additionally supported by a 50% deficit in dopamine release in chromaffin cells derived from R1441C homozygous knock-in mice compared to wild-type controls (Tong et al., 2009) and in murine BAC G2019S slices (Li et al., 2010). It is important note that our in vivo microdialysis data in the hWT mice is in contrast with the murine WT BAC mouse slices (Li et al., 2010) which showed an increased release of dopamine in the absence of altered striatal stores of dopamine. The reasons for these differences may be due to the differences in the BAC (human versus murine), background strain (FVB versus C57BL6), transgene expression levels or experimental technique. Like the R1441C knock-in model (Tong et al., 2009), our dopamine phenotype is the absence of any hypo/akinesia. The discrepancy between the motor behavior in our LRRK2 models and the R1441G model (albeit derived from different BAC clones but notably on the same genetic strain background) is difficult to reconcile given the similar effect on extracellular dopamine levels. Further analysis may reveal other mechanisms by which the R1441G mice become akinetic, since even 70–90% striatal depletion in acute toxin-induced mouse models of parkinsonism only result in very subtle behavioral deficits (Meredith et al., 2008). Interestingly, the human phenotype for Lrrk2 G2019S and R1441G carriers is equivalent; both mutations have high genotypic and population attributable risk and comparable age-associated penetrance (Gonzalez-Fernandez et al., 2007; Hulihan et al., 2008).
Regulation of intracellular and extracellular dopamine levels depend on synthesis, storage, release and uptake. Striatal dopamine concentrations measured by HPLC reflect vesicular stored dopamine at the axon terminal, which represents greater than 99% of striatal dopamine as compared to extracellular dopamine measured by microdialysis (Di Chiara et al., 1996). In both our hWT and G2019S mice dopamine stores are found to be similar to NT levels suggesting that the axon terminals are intact and able to store dopamine. Striatal and midbrain immunoblot analysis of TH:pTH ratios did not suggest any differences between hWT and G2019S compared to NT mice (data not shown). Therefore it also seems unlikely that synthesis is impaired. Similar DA levels post raclopride treatment in NT, hWT and G2019S mice also suggest that D2 auto-receptor feedback mechanisms are unaltered, in contrast to ex vivo midbrain slice cultures derived from R1441C knock-in mice which display impaired D2 autoreceptor function (Tong et al., 2009). While we cannot rule out altered DAT function, levels of DAT in the striatum were equivalent between G2019S, hWT and NT mice and timing and post-amphetamine release of dopamine suggest reverse DAT transport was unimpaired. Despite the reduction in extracellular dopamine we were only able to detect a significant compensatory post-synaptic increase in striatal D1 receptors in hWT mice by receptor autoradiography. The lack of compensation of D1 receptors in G2019S may reflect the smaller deficit in baseline dopamine levels (33% compared to 66% in the hWT). It is possible that compensatory D1 and/or D2 receptors alterations may only occur in specific subset of neurons. Future studies will require more sensitive measures, for example electrophysiological recordings.
Assuming storage, synthesis and uptake of dopamine are all intact, the reduced levels of extracellular dopamine at the synapse may be due to altered synaptic vesicle trafficking or exocytosis. Fractionation studies have suggested that Lrrk2 is localized to vesicular structures (Biskup et al., 2006; Hatano et al., 2007) and furthermore loss of LRK-1 in C. elegans results in mislocalized synaptic vesicle proteins (Sakaguchi-Nakashima et al., 2007). Over-expression of both wild-type and G2019S Lrrk2 was also recently shown to slow synaptic vesicle endocytosis (Shin et al., 2008). Future electrophysiological experiments to explore the mechanisms behind the release phenotype in our G2019S and hWT models, as well as other LRRK2 murine models are warranted. Translating these findings to early dopaminergic dysfunction in patients will be interesting since neuro-imaging studies in asymptomatic LRRK2 carriers report a progressive loss of dopaminergic function (Nandhagopal et al., 2008).
Stabilization of microtubules by tau in neurons is important for maintenance of cellular morphology and transport of molecules and organelles over long distances, and altered tau function can block transport of organelles, neurofilaments and vesicles (reviewed by (Spires-Jones et al., 2009). The presence of tau alterations appears to be a recurring feature in LRRK2 model systems (Li et al., 2009; MacLeod et al., 2006) and tau pathology is also present in a subset of LRRK2 patients. LRRK2 has been proposed to phosphorylate tubulin-beta isoforms and modulate microtubule stability (Gandhi et al., 2008). Correspondingly, LRRK2 knockout mice have increased tubulin-beta levels and con-current decreases in tau phosphorylation (Gillardon, 2009). Over 15 genetic studies in small populations have implicated variability in the tau gene with Parkinson’s disease and a recent study of a large number of European PD samples unequivocally showed that tau variability is a major risk factor for PD, along with alpha-synculein (Simon-Sanchez et al., 2009). Our study adds further support to the link between Lrrk2 and tau. In G2019S BAC lines the tau alterations are late-onset and phosphorylated tau accumulation is notable in the neuropil (the complex net of axonal, dendritic, and glial arborizations) although accumulation also occurs in neuronal cell bodies, and even in oligodendrocytes in certain regions in the G2019S mice. The tau alterations in the hWT mice appear to be more subtle and restricted to the highest area of Lrrk2 transgene expression. This suggests that while expression level appears to correlate with tau alterations, the effect of mutant Lrrk2 on tau is more pronounced. The most prominent phospho-tau alterations in the G2019S transgenic mice visible by immunohistochemistry appear to be with pSer262/356, an early epitope phosphorylated in tauopathy. This epitope has been shown to appear earlier in Alzheimer's disease than pSer 202/Thr205 (Augustinack et al., 2002). Both Ser262 and 356 are found in the microtubule binding domain of tau, and phosphorylation at Ser262 which is primarily by microtubule affinity-regulating kinase, has been shown to dramatically decrease tau-microtubule interactions and liberate tau from microtubules (Drewes et al., 1995). Curiously, immunoblotting with phospho-tau epitope pSer 396/404 (PHF-1), a known target of GSK-3β, reveals that alterations at this epitope are more widespread and may appear even earlier than the pSer262/356 in G2019S mice. In Alzheimer’s disease PHF-1 is typically a later stage epitope, however in a neurofibrillary cell culture system its phosphorylation has been shown to precede pSer202 (Hall et al., 2001). In normal mice, the PHF-1 epitope is particularly enriched in the axon compartment and differential tau isoform phosphorylation at the PHF-1 tau epitope may be dependent on subcellular localization (Hernandez et al., 2003). In non-pathological situations, phosphorylation at the PHF-1 epitope has previously been linked to axon development, regeneration (Pope et al., 1993) and neuritogenesis (Lambert et al., 1995), roles also connected to Lrrk2 function. Our biochemical data suggest that the composition of tau species may be altered by mutant Lrrk2 in the non-axonal components (i.e. cell bodies and glia). Tau is subject to a number of post-translational modifications, which can affect the behavior and biochemical profile of each isoform and produce a wide variation in its activity. In humans, tau protein undergoes several post-translational modifications such as phosphorylation, truncation, nitration, glycation, glycosylation, ubiquitination and polyaminations. When these modifications are perturbed, they play a serious role in neurodegeneration (Pevalova et al., 2006). In AD phosphorylation of tau is the most important of these modifications. When phosphorylation is perturbed, destabilization of the microtubular network and subsequent impairment of microtubule associated axonal transport occurs.
Curiously, the tau species alterations are evident even in dephosphorylated samples, therefore the changes in isoform banding cannot be due to phosphorylation alone and must be a result of other post-translational modification(s). We propose that LRRK2 dysfunction impacts on how tau is processed post-translationally, which in turn impacts on compartmentalization and thus the functional roles of tau in neuronal maintenance and transport. Future exploration of the staging of tau epitopes, tau species composition and post-translational modification in LRRK2 transgenic mice and in the brains of LRRK2 patients with tau pathology may be informative.
Somewhat surprisingly, G2019S mice display abnormal exploratory activity behavior in open field analysis when compared to NT or hWT mice. The open field test evaluates not only the locomotor exploratory activity of animals, but also their emotional response to a novel environment. A decreased exploration of the arena centre is usually interpreted as an indicator of increased anxiety-like behavior (Kallai et al., 2007; Royce et al., 1975). Increased thigmotaxis or wall hugging is also associated with anxiety and spatial memory impairment (Kallai et al., 2009; Kallai et al., 2007; Simon et al., 1994). These behaviors are consistent with several mouse models of tauopathy that have reported anxiety like behavior (Egashira et al., 2005; Rosenmann et al., 2008; Schindowski et al., 2006). Anxiety and depression are also common non-motor features in Parkinson’s disease. The hippocampus is a major structure supporting spatial memory, spatial navigation and is involved in coping with stressful situations (Kallai et al., 2009). Interestingly, imaging studies reveal asymptomatic LRRK2 carriers have reduced hippocampal volume (Reetz et al., 2010). Furthermore, hippocampal neurogenesis, which has been linked functionally to hippocampal dependent memory tasks (Clelland et al., 2009; Jessberger et al., 2009; Thuret et al., 2009), is impaired in G2019S mice (Winner, Melrose in preparation). Since the hippocampus is also the highest region of transgene expression and is susceptible to alterations of tau, it will be interesting to see the tau and anxiety phenotypes are related. The persistence of thigmotaxic searches indicates compromised plasticity in search strategies used in spatial navigation tasks (Janus, 2004; Lipp et al., 1989; Wolfer et al., 1998) hence progression of this deficit and possible emergence of other deficits at later stages of development should be also addressed in detail in the future studies. To facilitate these studies we have backcrossed the hWT and G2019S mice on to the more favorable C57BL6 background, as retinal degeneration in the FVB background prevents visual dependent behavioral testing.
Conclusions
In summary we describe two new LRRK2 models, created using BAC transgenesis to over-express human WT or G2019S Lrrk2 in mice. As for previous LRRK2 models, we confirm a deficit in extracellular dopamine levels in our mutant G2019S model, but importantly we demonstrate this dopamine impairment is also present in mice expressing high levels of human wild-type Lrrk2. Furthermore, we show that while tau alterations occur in both models, mutant G2019S leads to a much more pronounced effect. Finally we reveal that G2019S mice have abnormal exploratory behaviors, which may indicate a fear/anxiety deficit. Whilst admittedly our models do not recapitulate cardinal features of PD, the mechanisms behind the subtle dopamine release phenotype in our models may give clues to the etiology behind sub-clinical dopaminergic dysfunction in asymptomatic LRRK2 patients. The tau abnormalities and abnormal behavioral profiles in G2019S our mice may serve as useful markers for studying normal Lrrk2 function and for future therapeutic screening.
Supplementary Material
(A,B) Lrrk2 immunoblot from hemi-brain lysates. Quantification reveals around 3.5 fold in hWT and 3 fold in G2019S mice.
(C,D) Lrrk2 immunoblot from hippocampal lysates (the region of highest expression in all lines) comparing several transgenic lines. Quantification revealed around 20-fold expression in hWT and 14-fold expression in the G2019S line “4K”, described in this paper.
HPLC analysis of monoamines and their metabolites striatal tissue punches in (A) hWT and NT littermates and (B) G2019S mice and NT littermates. Data is plotted as mean ± SEM.
Mice were treated with D2 receptor antagonist raclopride and sacrificed 30 minutes later. Dopamine and dopamine metabolite levels were measured by HPLC. No differences were detected in (A) dopamine or (B) turnover of DOPAC/Dopamine or (C) turnover of HVA/dopamine.
(A) Beam walking test. The mouse walks across a narrow beam to reach a home cage. Trail day 1 utilized a 2.5cm beam, trail day 2 utilized a more difficult narrower 1.9cm beam. The time to cross the beam was recorded. Data is plotted as mean ± SEM.
(B) Negative geotaxis test. The mouse is placed horizontally held large wire grid that is then raised and slowly inclined to an angle of 70–80° with an animal downwards. Negative geotaxis response (turning and climbing up the grid) was recorded. Score scale: 0 = turns and climbs grid, 1 = turns and freezes, 2 = moves but fails to turn, 3 = does not move in 30 secs, 4= falls off. T1- trial day 1, T2-trail day 2. The data point for each animal is presented.
(C and D) Gait footprint analysis was performed to determine fore- and hind-limb stridelength in cm. Fore- and hind-paws were painted with non-toxic paint and footprints recorded as the mice run down a perspex alley to darkened box. The data point for each animal is presented.
Acknowledgments
We would like to thank Linda Rousseau and Virginia Philips for technical assistance. Funding support was provided by the Mayo Clinic, NIH Grants NIA AG17216, NINDS NS40256, NIA AG11762 and AG17586, Lundbeck A/S, The Pacific Alzheimer’s Research Foundation, Michael J Fox Foundation and the Robert H and Clarice Smith/ML Simpson Foundation Trust Fellowship.
Abbreviations
- LRRK2/Lrrk2
leucine rich repeat kinase 2
- PD
Parkinson’s Disease
- hWT
human wild type
- BAC
bacterial artificial chromosome
- PCR
polymerase chain reaction
- TH
tyrosine hydroxylase
- NT
non transgenic
- DOPAC
3,4-dihydroxyphenylacetic acid
- HVA
homovanillic acid
- HPLC
high performance liquid chromatography
- DAT
dopamine transporter
- DAB
3,3′-diaminobenzidine tetrahydrochloride
- ANOVA
analysis of variance
Footnotes
Publisher's Disclaimer: This is a PDF file of an unedited manuscript that has been accepted for publication. As a service to our customers we are providing this early version of the manuscript. The manuscript will undergo copyediting, typesetting, and review of the resulting proof before it is published in its final citable form. Please note that during the production process errors may be discovered which could affect the content, and all legal disclaimers that apply to the journal pertain.
References
- 1.Allen JP, et al. Somatostatin receptor 2 knockout/lacZ knockin mice show impaired motor coordination and reveal sites of somatostatin action within the striatum. Eur J Neurosci. 2003;17:1881–95. doi: 10.1046/j.1460-9568.2003.02629.x. [DOI] [PubMed] [Google Scholar]
- 2.Andres-Mateos E, et al. Unexpected lack of hypersensitivity in LRRK2 knock-out mice to MPTP (1-methyl-4-phenyl-1,2,3,6-tetrahydropyridine) J Neurosci. 2009;29:15846–50. doi: 10.1523/JNEUROSCI.4357-09.2009. [DOI] [PMC free article] [PubMed] [Google Scholar]
- 3.Augustinack JC, et al. Specific tau phosphorylation sites correlate with severity of neuronal cytopathology in Alzheimer's disease. Acta Neuropathol. 2002;103:26–35. doi: 10.1007/s004010100423. [DOI] [PubMed] [Google Scholar]
- 4.Biskup S, et al. Localization of LRRK2 to membranous and vesicular structures in mammalian brain. Ann Neurol. 2006;60:557–69. doi: 10.1002/ana.21019. [DOI] [PubMed] [Google Scholar]
- 5.Clelland CD, et al. A functional role for adult hippocampal neurogenesis in spatial pattern separation. Science. 2009;325:210–3. doi: 10.1126/science.1173215. [DOI] [PMC free article] [PubMed] [Google Scholar]
- 6.Di Chiara G, et al. Estimation of in-vivo neurotransmitter release by brain microdialysis: the issue of validity. Behav Pharmacol. 1996;7:640–657. [PubMed] [Google Scholar]
- 7.Drewes G, et al. Microtubule-associated protein/microtubule affinity-regulating kinase (p110mark). A novel protein kinase that regulates tau-microtubule interactions and dynamic instability by phosphorylation at the Alzheimer-specific site serine 262. J Biol Chem. 1995;270:7679–88. doi: 10.1074/jbc.270.13.7679. [DOI] [PubMed] [Google Scholar]
- 8.Ebel A, et al. Genotypic differences in central neurotransmitter responses to aging in mice. Neurobiol Aging. 1987;8:417–27. doi: 10.1016/0197-4580(87)90036-4. [DOI] [PubMed] [Google Scholar]
- 9.Egashira N, et al. Altered depression-related behavior and neurochemical changes in serotonergic neurons in mutant R406W human tau transgenic mice. Brain Res. 2005;1059:7–12. doi: 10.1016/j.brainres.2005.08.004. [DOI] [PubMed] [Google Scholar]
- 10.Farrer MJ. Genetics of Parkinson disease: paradigm shifts and future prospects. Nat Rev Genet. 2006;7:306–18. doi: 10.1038/nrg1831. [DOI] [PubMed] [Google Scholar]
- 11.Fleming SM, Chesselet MF. Behavioral phenotypes and pharmacology in genetic mouse models of Parkinsonism. Behav Pharmacol. 2006;17:383–91. doi: 10.1097/00008877-200609000-00004. [DOI] [PubMed] [Google Scholar]
- 12.Gandhi PN, et al. The Roc domain of leucine-rich repeat kinase 2 is sufficient for interaction with microtubules. J Neurosci Res. 2008;86:1711–20. doi: 10.1002/jnr.21622. [DOI] [PMC free article] [PubMed] [Google Scholar]
- 13.Gillardon F. Leucine-rich repeat kinase 2 phosphorylates brain tubulin-beta isoforms and modulates microtubule stability--a point of convergence in parkinsonian neurodegeneration? J Neurochem. 2009;110:1514–22. doi: 10.1111/j.1471-4159.2009.06235.x. [DOI] [PubMed] [Google Scholar]
- 14.Gonzalez-Fernandez MC, et al. Lrrk2-associated parkinsonism is a major cause of disease in Northern Spain. Parkinsonism Relat Disord. 2007;13:509–15. doi: 10.1016/j.parkreldis.2007.04.003. [DOI] [PubMed] [Google Scholar]
- 15.Greggio E, Cookson MR. Leucine-rich repeat kinase 2 mutations and Parkinson's disease: three questions. ASN Neuro. 2009;1 doi: 10.1042/AN20090007. [DOI] [PMC free article] [PubMed] [Google Scholar]
- 16.Hall GF, et al. Staging of neurofibrillary degeneration caused by human tau overexpression in a unique cellular model of human tauopathy. Am J Pathol. 2001;158:235–46. doi: 10.1016/S0002-9440(10)63962-4. [DOI] [PMC free article] [PubMed] [Google Scholar]
- 17.Hatano T, et al. Leucine-rich repeat kinase 2 associates with lipid rafts. Hum Mol Genet. 2007;16:678–90. doi: 10.1093/hmg/ddm013. [DOI] [PubMed] [Google Scholar]
- 18.Hernandez F, et al. GSK-3 dependent phosphoepitopes recognized by PHF-1 and AT-8 antibodies are present in different tau isoforms. Neurobiol Aging. 2003;24:1087–94. doi: 10.1016/j.neurobiolaging.2003.04.002. [DOI] [PubMed] [Google Scholar]
- 19.Hulihan MM, et al. LRRK2 Gly2019Ser penetrance in Arab-Berber patients from Tunisia: a case-control genetic study. Lancet Neurol. 2008;7:591–4. doi: 10.1016/S1474-4422(08)70116-9. [DOI] [PubMed] [Google Scholar]
- 20.Janus C. Search strategies used by APP transgenic mice during navigation in the Morris water maze. Learn Mem. 2004;11:337–46. doi: 10.1101/lm.70104. [DOI] [PMC free article] [PubMed] [Google Scholar]
- 21.Jessberger S, et al. Dentate gyrus-specific knockdown of adult neurogenesis impairs spatial and object recognition memory in adult rats. Learn Mem. 2009;16:147–54. doi: 10.1101/lm.1172609. [DOI] [PMC free article] [PubMed] [Google Scholar]
- 22.Kallai J, et al. Anxiety-dependant spatial navigation strategies in real and virtual spaces. Cogn Process. 2009;10:S229–S232. doi: 10.1007/s10339-009-0288-5. [DOI] [PubMed] [Google Scholar]
- 23.Kallai J, et al. Cognitive and affective aspects of thigmotaxis strategy in humans. Behav Neurosci. 2007;121:21–30. doi: 10.1037/0735-7044.121.1.21. [DOI] [PubMed] [Google Scholar]
- 24.Lambert MP, et al. Constitutive Alzheimer's-type tau epitopes in a neuritogenic rat CNS cell line. Neurobiol Aging. 1995;16:583–9. doi: 10.1016/0197-4580(95)00042-d. [DOI] [PubMed] [Google Scholar]
- 25.Lewis J, et al. Neurofibrillary tangles, amyotrophy and progressive motor disturbance in mice expressing mutant (P301L) tau protein. Nat Genet. 2000;25:402–5. doi: 10.1038/78078. [DOI] [PubMed] [Google Scholar]
- 26.Li X, et al. Enhanced striatal dopamine transmission and motor performance with LRRK2 overexpression in mice is eliminated by familial Parkinson's disease mutation G2019S. J Neurosci. 2010;30:1788–97. doi: 10.1523/JNEUROSCI.5604-09.2010. [DOI] [PMC free article] [PubMed] [Google Scholar]
- 27.Li Y, et al. Mutant LRRK2(R1441G) BAC transgenic mice recapitulate cardinal features of Parkinson's disease. Nat Neurosci. 2009 doi: 10.1038/nn.2349. [DOI] [PMC free article] [PubMed] [Google Scholar]
- 28.Lin X, et al. Leucine-rich repeat kinase 2 regulates the progression of neuropathology induced by Parkinson's-disease-related mutant alpha-synuclein. Neuron. 2009;64:807–27. doi: 10.1016/j.neuron.2009.11.006. [DOI] [PMC free article] [PubMed] [Google Scholar]
- 29.Lindley SE, et al. 3,4-Dihydroxyphenylacetic acid concentrations in the intermediate lobe and neural lobe of the posterior pituitary gland as an index of tuberohypophysial dopaminergic neuronal activity. Brain Res. 1990;506:133–8. doi: 10.1016/0006-8993(90)91209-y. [DOI] [PubMed] [Google Scholar]
- 30.Lipp HP, et al. Using genetically-defined rodent strains for the identification of hippocampal traits relevant for two-way avoidance behavior: a non-invasive approach. Experientia. 1989;45:845–59. doi: 10.1007/BF01954059. [DOI] [PubMed] [Google Scholar]
- 31.MacLeod D, et al. The familial Parkinsonism gene LRRK2 regulates neurite process morphology. Neuron. 2006;52:587–93. doi: 10.1016/j.neuron.2006.10.008. [DOI] [PubMed] [Google Scholar]
- 32.Melrose H, et al. Anatomical localization of leucine-rich repeat kinase 2 in mouse brain. Neuroscience. 2006;139:791–4. doi: 10.1016/j.neuroscience.2006.01.017. [DOI] [PubMed] [Google Scholar]
- 33.Melrose HL, et al. A comparative analysis of leucine-rich repeat kinase 2 (Lrrk2) expression in mouse brain and Lewy body disease. Neuroscience. 2007;147:1047–58. doi: 10.1016/j.neuroscience.2007.05.027. [DOI] [PubMed] [Google Scholar]
- 34.Meredith GE, et al. Modeling PD pathogenesis in mice: advantages of a chronic MPTP protocol. Parkinsonism Relat Disord. 2008;14(Suppl 2):S112–5. doi: 10.1016/j.parkreldis.2008.04.012. [DOI] [PMC free article] [PubMed] [Google Scholar]
- 35.Nakano M, Mizuno T. Age-related changes in the metabolism of neurotransmitters in rat striatum: a microdialysis study. Mech Ageing Dev. 1996;86:95–104. doi: 10.1016/0047-6374(95)01680-5. [DOI] [PubMed] [Google Scholar]
- 36.Nandhagopal R, et al. Progression of dopaminergic dysfunction in a LRRK2 kindred: a multitracer PET study. Neurology. 2008;71:1790–5. doi: 10.1212/01.wnl.0000335973.66333.58. [DOI] [PMC free article] [PubMed] [Google Scholar]
- 37.Osoegawa K, et al. Construction of bacterial artificial chromosome (BAC/PAC) libraries. Curr Protoc Mol Biol. 2001;Chapter 5(Unit 5):9. doi: 10.1002/0471142727.mb0509s55. [DOI] [PubMed] [Google Scholar]
- 38.Palkovits M. Isolated removal of hypothalamic or other brain nuclei of the rat. Brain Res. 1973;59:449–50. doi: 10.1016/0006-8993(73)90290-4. [DOI] [PubMed] [Google Scholar]
- 39.Paxinos G, Franklin K. The Mouse Brain in Stereotaxic Coordinates. Academic Press; San Diego: 2001. [Google Scholar]
- 40.Pevalova M, et al. Post-translational modifications of tau protein. Bratisl Lek Listy. 2006;107:346–53. [PubMed] [Google Scholar]
- 41.Piggott MA, et al. Striatal dopaminergic markers in dementia with Lewy bodies, Alzheimer's and Parkinson's diseases: rostrocaudal distribution. Brain. 1999;122(Pt 8):1449–68. doi: 10.1093/brain/122.8.1449. [DOI] [PubMed] [Google Scholar]
- 42.Plowey ED, et al. Role of autophagy in G2019S-LRRK2-associated neurite shortening in differentiated SH-SY5Y cells. J Neurochem. 2008;105:1048–56. doi: 10.1111/j.1471-4159.2008.05217.x. [DOI] [PMC free article] [PubMed] [Google Scholar]
- 43.Pope W, et al. Phosphorylated tau epitope of Alzheimer's disease is coupled to axon development in the avian central nervous system. Exp Neurol. 1993;120:106–13. doi: 10.1006/exnr.1993.1044. [DOI] [PubMed] [Google Scholar]
- 44.Puglisi-Allegra S, Cabib S. Psychopharmacology of dopamine: the contribution of comparative studies in inbred strains of mice. Prog Neurobiol. 1997;51:637–61. doi: 10.1016/s0301-0082(97)00008-7. [DOI] [PubMed] [Google Scholar]
- 45.Reetz K, et al. Structural imaging in the presymptomatic stage of genetically determined parkinsonism. Neurobiol Dis. 2010 doi: 10.1016/j.nbd.2010.05.006. [DOI] [PubMed] [Google Scholar]
- 46.Rosenmann H, et al. A novel transgenic mouse expressing double mutant tau driven by its natural promoter exhibits tauopathy characteristics. Exp Neurol. 2008;212:71–84. doi: 10.1016/j.expneurol.2008.03.007. [DOI] [PubMed] [Google Scholar]
- 47.Royce JR, et al. Behavior genetic analysis of mouse emotionality. III. The diallel analysis. Behav Genet. 1975;5:351–72. doi: 10.1007/BF01073205. [DOI] [PubMed] [Google Scholar]
- 48.Sakaguchi-Nakashima A, et al. LRK-1, a C. elegans PARK8-related kinase, regulates axonal-dendritic polarity of SV proteins. Curr Biol. 2007;17:592–8. doi: 10.1016/j.cub.2007.01.074. [DOI] [PubMed] [Google Scholar]
- 49.Schindowski K, et al. Alzheimer's disease-like tau neuropathology leads to memory deficits and loss of functional synapses in a novel mutated tau transgenic mouse without any motor deficits. Am J Pathol. 2006;169:599–616. doi: 10.2353/ajpath.2006.060002. [DOI] [PMC free article] [PubMed] [Google Scholar]
- 50.Schmitz Y, et al. Amphetamine distorts stimulation-dependent dopamine overflow: effects on D2 autoreceptors, transporters, and synaptic vesicle stores. J Neurosci. 2001;21:5916–24. doi: 10.1523/JNEUROSCI.21-16-05916.2001. [DOI] [PMC free article] [PubMed] [Google Scholar]
- 51.Shi WX, et al. Endogenous DA-mediated feedback inhibition of DA neurons: involvement of both D(1)- and D(2)-like receptors. Synapse. 2000;35:111–9. doi: 10.1002/(SICI)1098-2396(200002)35:2<111::AID-SYN3>3.0.CO;2-7. [DOI] [PubMed] [Google Scholar]
- 52.Shin N, et al. LRRK2 regulates synaptic vesicle endocytosis. Exp Cell Res. 2008;314:2055–65. doi: 10.1016/j.yexcr.2008.02.015. [DOI] [PubMed] [Google Scholar]
- 53.Simon-Sanchez J, et al. Genome-wide association study reveals genetic risk underlying Parkinson's disease. Nat Genet. 2009;41:1308–12. doi: 10.1038/ng.487. [DOI] [PMC free article] [PubMed] [Google Scholar]
- 54.Simon P, et al. Thigmotaxis as an index of anxiety in mice. Influence of dopaminergic transmissions. Behav Brain Res. 1994;61:59–64. doi: 10.1016/0166-4328(94)90008-6. [DOI] [PubMed] [Google Scholar]
- 55.Spires-Jones TL, et al. Tau pathophysiology in neurodegeneration: a tangled issue. Trends Neurosci. 2009;32:150–9. doi: 10.1016/j.tins.2008.11.007. [DOI] [PubMed] [Google Scholar]
- 56.Thuret S, et al. Hippocampus-dependent learning is associated with adult neurogenesis in MRL/MpJ mice. Hippocampus. 2009;19:658–69. doi: 10.1002/hipo.20550. [DOI] [PubMed] [Google Scholar]
- 57.Tong Y, et al. R1441C mutation in LRRK2 impairs dopaminergic neurotransmission in mice. Proc Natl Acad Sci U S A. 2009;106:14622–7. doi: 10.1073/pnas.0906334106. [DOI] [PMC free article] [PubMed] [Google Scholar]
- 58.Tong Y, et al. Loss of leucine-rich repeat kinase 2 causes impairment of protein degradation pathways, accumulation of {alpha}-synuclein, and apoptotic cell death in aged mice. Proc Natl Acad Sci U S A. 2010 doi: 10.1073/pnas.1004676107. [DOI] [PMC free article] [PubMed] [Google Scholar]
- 59.van Egmond WN, et al. Intramolecular activation mechanism of the Dictyostelium LRRK2 homolog Roco protein GbpC. J Biol Chem. 2008;283:30412–20. doi: 10.1074/jbc.M804265200. [DOI] [PMC free article] [PubMed] [Google Scholar]
- 60.Ventura R, et al. Dopamine in the medial prefrontal cortex controls genotype-dependent effects of amphetamine on mesoaccumbens dopamine release and locomotion. Neuropsychopharmacology. 2004;29:72–80. doi: 10.1038/sj.npp.1300300. [DOI] [PubMed] [Google Scholar]
- 61.Whaley NR, et al. Clinical and pathologic features of families with LRRK2-associated Parkinson's disease. J Neural Transm Suppl. 2006:221–9. doi: 10.1007/978-3-211-45295-0_34. [DOI] [PubMed] [Google Scholar]
- 62.Wolfer DP, et al. Increased flexibility and selectivity in spatial learning of transgenic mice ectopically expressing the neural cell adhesion molecule L1 in astrocytes. Eur J Neurosci. 1998;10:708–17. doi: 10.1046/j.1460-9568.1998.00089.x. [DOI] [PubMed] [Google Scholar]
Associated Data
This section collects any data citations, data availability statements, or supplementary materials included in this article.
Supplementary Materials
(A,B) Lrrk2 immunoblot from hemi-brain lysates. Quantification reveals around 3.5 fold in hWT and 3 fold in G2019S mice.
(C,D) Lrrk2 immunoblot from hippocampal lysates (the region of highest expression in all lines) comparing several transgenic lines. Quantification revealed around 20-fold expression in hWT and 14-fold expression in the G2019S line “4K”, described in this paper.
HPLC analysis of monoamines and their metabolites striatal tissue punches in (A) hWT and NT littermates and (B) G2019S mice and NT littermates. Data is plotted as mean ± SEM.
Mice were treated with D2 receptor antagonist raclopride and sacrificed 30 minutes later. Dopamine and dopamine metabolite levels were measured by HPLC. No differences were detected in (A) dopamine or (B) turnover of DOPAC/Dopamine or (C) turnover of HVA/dopamine.
(A) Beam walking test. The mouse walks across a narrow beam to reach a home cage. Trail day 1 utilized a 2.5cm beam, trail day 2 utilized a more difficult narrower 1.9cm beam. The time to cross the beam was recorded. Data is plotted as mean ± SEM.
(B) Negative geotaxis test. The mouse is placed horizontally held large wire grid that is then raised and slowly inclined to an angle of 70–80° with an animal downwards. Negative geotaxis response (turning and climbing up the grid) was recorded. Score scale: 0 = turns and climbs grid, 1 = turns and freezes, 2 = moves but fails to turn, 3 = does not move in 30 secs, 4= falls off. T1- trial day 1, T2-trail day 2. The data point for each animal is presented.
(C and D) Gait footprint analysis was performed to determine fore- and hind-limb stridelength in cm. Fore- and hind-paws were painted with non-toxic paint and footprints recorded as the mice run down a perspex alley to darkened box. The data point for each animal is presented.