

Abstract
Purpose
Sensitive detection and characterization of circulating tumor cell (CTC) could revolutionize the approach to patients with early stage and metastatic cancer. The current methodologies have significant limitations including limited capture efficiency and ability to characterize captured cells. Here, we report the development of a novel parylene membrane filter-based portable microdevice for size-based isolation with high recovery rate and direct on-chip characterization of captured CTC from human peripheral blood.
Experimental Design
We evaluated the sensitivity and efficiency of CTC capture in a model system using blood samples from healthy donors spiked with tumor cell lines. 59 model system samples were tested for determining the recovery rate of the microdevice. Moreover, 10 model system samples and 57 blood samples from cancer patients were subjected to both membrane microfilter device and CellSearch® platform enumeration for direct comparison.
Results
Using the model system, the microdevice achieved >90% recovery with probability of 95% recovering at least one cell when 5 are seeded in 7.5 ml of blood. CTCs were identified in 51 out of 57 patients using the microdevice, compared to only 26 patients with the CellSearch® method. When CTC were detected by both methods, greater numbers were recovered by the microfilter device in all but 5 patients.
Conclusions
This filter-based microdevice is both a capture and analysis platform, capable of multiplexed imaging and genetic analysis. The microdevice presented here has the potential to enable routine CTC analysis in clinical setting for effective management of cancer patients.
The most important determinant of prognosis and management of cancer is the absence or presence of metastasis (1). The early spread of tumor cells to lymph nodes or bone marrow (BM) is referred to as “disseminated tumor cells” (DTC), or as CTC when observed in the peripheral blood. It has been well established that DTC or CTC can be present even in patients with no evidence of overt metastasis, and who have undergone complete resection of the primary tumor; this is the basis for the later development of overt metastases. Indeed, the possible presence of DTC or CTC is the rationale behind the use of systemic adjuvant chemotherapy in patients who have undergone definitive treatment of the primary tumor (2). Once there is clinical evidence of metastasis, patients will undergo systemic therapy. While the efficacy of such therapy is improving, many patients will not respond, even when appropriate targets have been identified (3). A growing body of evidence suggests that CTC monitoring can identify those patients that are responding to, or failing therapy early in the course of treatment, based on comparison of CTC counts before and after the initiation of treatment, allowing for earlier and more specific prediction of therapeutic efficacy (4-8). This application thus has the potential to fundamentally alter the way patients with metastatic cancer are managed.
The technical challenge for detection of CTCs is their extremely rare occurrence in blood, coupled with the task of correctly identifying tumor cells after enrichment. The number of CTCs in blood is rare in comparison to resident blood cells, which consists of white blood cells (WBCs) (5–10×106 ml−1), red blood cells (RBCs) (5–9×10⁹ ml−1), and platelets (2.5–4×10⁸ ml−1). A variety of technologies for CTC isolation have been described (9), including methodologies exploiting the physical characteristics of tumor cells such as density (10), cell size (11, 12), electrical properties (13), or expression of protein markers (14). Virtually all current systems depend on affinity based capture and enrichment, usually using antibodies to surface epithelial markers such as EpCAM (3). Affinity based systems are limited by the heterogeneity of expression of the target antigens, and also limited to the types of tumors expressing these antigens.
The current methodologies for CTC capture and identification in blood have significant barriers including multiple procedural steps, substantial human intervention, high cost, or most importantly, the lack of capture efficiency and standardization for the detection methods. Further, current methods have very limited ability to perform complex analysis of the captured cells, such as identification of targets or special biological characteristics (e.g. stem cell characteristics). Thus, there is a need for the development of a reliable, efficient platform to isolate, enrich and characterize CTC in blood. It would be highly desirable if such a capture device were portable and could be used at the point-of-care or in a reference laboratory to eliminate the variation in blood shipment conditions to centralized processing facility, enhancing clinical decision-making ability. This study describes development of such a clinical assay, explores its ability to capture more intact CTC than the FDA-approved CellSearch assay and presents data to show that it does so favorably. We believe this is a significant step forward towards analytical validation of a novel technology.
Patients and Methods
Cell Culture and Harvest
Carcinoma cell lines derived from different primary tumor sites were purchased from American Type Culture Collection (Manassas, VA) without further testing or authentication. All cell cultures were grown to confluence with the respective medium (RT4 and T24: McCoy’s 5A, J82 and HT-1080: EMEM, LNCaP: RPMI, MCF-7, MDA-MB-231 and SK-BR-3: DMEM) supplemented with 50 units/mL of penicillin and streptomycin and 10% FCS (Mediatech, Inc., Herndon, VA) in a 75 cm2 or 25 cm2 tissue culture flask (Corning, Corning, NY) and maintained in a humidified incubator at 5% CO2 and 37°C. Adherent cells were harvested using GIBCO® Trypsin-EDTA (Invitrogen Corp., Carlsbad, CA); we have demonstrated that expression of EpCAM is not affected by this process. Cell numbers were assessed using hemocytomter, and cell viability was measured using a dye exclusion method (Invitrogen Corp., Carlsbad, CA) where for each experiment, the cell viability showed at least 90% healthy cells after detachment from culture flask and washing steps.
Cell Size Measurement
To measure the diameter of cells in suspension, each of the cultured cell lines were suspended in PBS and loaded inside hemacytometers (Bright-Line, Hausser Scietific, Horsham, PA). Cells suspended over the etched grid were imaged using SPOT Insight Color camera (IN320, Diagnostic Instruments, Sterlin Heights, MI). Each image was analyzed using MATLAB to obtain 4 coordinates manually to define the maximum diameter vertically and horizontally. Cell diameters were calculated by averaging the vertical and horizontal length. Measurements in pixels were converted into μm by utilizing the etched 50μm grids within the hemocytometer as the reference scale bar.
Flow rate characteristics
To provide constant pressure source at the inlet of the microdevice, pressure regulators were connected in series from a CO2 gas cylinder to a working range of 0-10 psi. A pressure meter (Omega pressure calibrator PCL 100-30, Stamford, CT, 30 psi maximum, 0.001 psi sensitivity) was connected near the inlet of microdevice for monitoring the pressure source. For each measurement, sample solution was first injected into an inlet reservoir with the valve to the 0.5 psi pressure source in the ‘closed’ position. Upon opening the valve to the pressure source, the time and flow rate were recorded where the flow rate was monitored through mass change in the outlet reservoir.
Recovery rates with model system
To measure the recovery rates of tumor cells in blood using the microdevice, a mixture of cultured tumor cells (MCF-7, SK-BR-3, J82, T24, RT4, LNCaP) were harvested and cell counts were obtained using a hemacytometer. Cells were serially diluted to the desired number per 10 microliters and the expected cell count was obtained by averaging 10 measurements using hemacytometer. For sensitivity studies, cell suspension droplets containing approximately 3,000 cells were placed on a microscope slide and the desired numbers of cells (10 or 5 cells) were manually aspirated. Cells were spiked in blood and diluted with PBS with final blood to buffer ratio of 1:1 containing 1% formalin. Each sample underwent partial fixation for 10 minutes with constant rotation. The sample was dispensed through the filter with a syringe and the filter containing captured cells was fixed in 10% NBF for 10 min followed by permeabilization of cell membrane with 0.25% triton X-100 (BioRad, Hercules, CA). Each filter was allowed to air-dry overnight at room temperature and subjected to immunofluorescence (IF) analysis to identify CTCs and distinguish them from the background of non-target blood cells.
On-Chip Immunofluorescence Detection of Captured CTC
Tumor cells were identified and distinguished from leukocytes based on morphology and differential antigen expression. Tumor cells are epithelial, and express cytokeratin (CK), while leukocytes are non-epithelial, and are negative for CK. IF was performed directly on the filter membranes for the expression of CKs. Filter membranes were place on top of microscope slides and blocked with normal horse serum for 20 min. A cocktail of two different mouse monoclonal antibodies against CKs was used for the detection of epithelial tumor cells: AE-1 (1:600 dilution, Signet, Dedham, MA, cat. # 462-01) against low and intermediate Type I acidic keratins and CAM 5.2 (1:100 dilution, Beckton-Dickinson, San Jose, CA, cat. #349205) against CK 8 and 18. The slides were incubated for 1 hour in the cocktail of primary antibodies diluted in CheMate antibody diluent (DakoCyotmation, Carpinteria, CA). Subsequently, the slides were washed and incubated for 1 hour with fluorescent, Alexa Fluor 488 conjugated goat anti-mouse secondary antibody (Invitrogen, Carlsbad, CA). For samples collected from patients with castration resistant prostate cancer, the entire procedure is repeated using rabbit polyclonal antibodies against PSA (Dako, Denmark, cat. # A0562) followed by Alexa Fluor 594 conjugated goat anti-rabbit secondary antibody (Invitrogen, Carlsbad, CA) to confirm that the CK positive cells were of prostate origin. Membrane on slides were coverslipped using Vectashield® (Vector Laboratories, Burlingame, CA) mounting medium containing 4′,6-diamidino-2-phenylindole (DAPI) for nuclear staining and sealed with nail polish. IF images were obtained using Leica DM LB2 microscope equipped with Diagnostic Instruments 7.3.3 color camera viewed with Chroma filter sets consisting of excitation filters of 480/40 and 560/55, dichroic filters of 505 and 595 long pass, and emission filters of 535/50 and 560/55. Cells were imaged directly on filter membranes placed onto microscope slides.
Comparison of CellSearch® vs. Microdevice
Each blood sample collected in CellSave® preservative tube, provided by Quest Diagnostics, was spiked with mixture of cultured tumor cells (MCF-7, SK-BR-3, J82, T24, RT4, LNCaP) either by manual pipetting under microscopic visual control (10 cells) or serial dilution (90 cells). Although each sample collected in CellSave® tubes contains 10 ml of blood, the CellSearch® test only uses 7.5 ml of blood for their assay; therefore, in order to provide a direct comparison of performance, only 7.5 ml of blood was used in the analysis using the microdevice.
Patient Samples
Blood samples from patients with metastatic prostate, breast, colon or bladder cancer were obtained at Memorial Sloan-Kettering Cancer Center (MSKCC), New York, NY with appropriate informed consent from each patient. Each sample was collected using CellSave® tubes and shipped overnight in a styrofoam box at room temperature to our laboratory and processed immediately upon receipt. At the time of collection, a sample in CellSave tubes was also obtained and tested by the CellSearch® method at MSKCC.
Enrichment Count
To estimate the number of WBCs retained on the membrane, normal donor blood samples were processed through the filter, the cells were stained with DAPI and 30 images were captured using a fluorescence microscope with DAPI filter set. Each image were split into its red, green and blue component using the RGB split option with ImageJ, a free image processing software provide by NIH. The blue component was analyzed by using the automated particle analysis to detect circular objects within the field of view. Each nucleated cells were counted and averaged to provide an estimate to the number of WBC retained on each filter.
Results
We fabricated parylene membrane microfilters as described previously (15) and each device was constructed by sandwiching individual membrane filters with rectangular slabs of polydimethylsiloxane (PDMS) and clamped between acrylic jigs as shown in Figure 1 to form a fluidic chamber with openings from the top and bottom to create a sealed system with an inlet and an outlet.
Figure 1.

Illustration of device assembly. a) Schematic drawing of a functional microdevice consists of parylene membrane filter sandwiched between rectangular PDMS slabs and clamped in between acrylic jigs with inlet and outlet for syringes. b) Bright field image of an optically transparent parylene filter with uniformly shaped and spaced 8 μm pores. c) SEM picture of single cultured tumor cell captured on the membrane.
One of the major requisites for the detection of CTC is the ability to preserve their morphology for cytopathological analysis, which is critical for the identification of true CTC. Fixatives stabilize the cells to protect them from the rigors of subsequent processing and staining techniques. The use of precipitation-based fixatives such as alcohol and acetone result in formation of large aggregates of serum protein, which can quickly clog filters resulting in device failure. Therefore, a formaldehyde-based fixative, which forms methylene cross-links between basic amino acids was used for preservation of morphology in this study. Because the extent of methylene bridges depends upon various factors including concentration of formaldehyde, temperature, pH and time of exposure, with over-fixation resulting in formation of large clumps leading to device failure, we optimized the fixation protocol for blood so as to preserve CTC morphology while allowing a desirable flow rate through the filter. Different fixative concentrations, between 0.1-10% neutral buffered formalin in PBS (NBF, VWR®) were tested for cultured tumor cells, and the fixation by 1% formalin was found to be optimal for preserving morphology while retaining desirable flow rate (data not shown). In addition, flow characteristics of different samples were monitored using a constant pressure source for sample delivery while the flow rate was indirectly monitored by measuring the weight of the flow-through liquid in relation to time. Flow rates under constant pressure (0.5 psi) of samples with different fixatives (acetone and formalin), concentrations of NBF (0%, 1%, and 5%), dilutions of blood (100% and 50%) and amount of cultured tumor cells (0, 25,000 and 50,000) were measured and plotted in Figure 2. The most important determinant of flow property is the composition of the fluidic components in the sample, including cellularity of blood and concentration of fixative. The optimized protocol was 10 minute rotational fixation of blood diluted in equal volume of buffer containing 2% formalin; the final dilution of blood was 50%, and final formalin concentration was 1%.
Figure 2.

- PBS only (square);
- PBS with 50k LNCaP cells (circle);
- PBS with 50k LNCaP cells fixed in 1% acetone (triangle);
- 50% human blood (triangle);
- 50% human blood with 25k LNCaP cells (square);
- 50% blood fixed in 1% NBF (triangle);
- 50% blood and 25k LNCaP cells fixed in 1% NBF (triangle);
- 50% blood and 25k LNCaP cells fixed in 2% NBF (hexagon);
- 50% blood and 25k LNCaP cells fixed in 5% NBF. Dash line part of curve 9 was caused by severe blocking of filter so that the filtration could not be completed (star);
- 100% human blood (pentagon).
As a model system to optimize our device, we evaluated the sensitivity and efficiency of CTC capture using the membrane microfilter device. Five cultured human cancer cells were manually micro-pipetted with observation under microscope into 7.5 ml of whole blood from healthy, cancer-free donors, and processed by the membrane microfilter device. A total of 58 replicates were performed, where half of the replicates (29) were seeded with only J82 bladder cancer cell line, which is relatively small in size (14±1.5 μm), and the other half were seeded with a mixture of 6 different human cancer cell lines (J82 and T24 bladder cancer cell lines, MCF-7, SK-BR-3, and MDA-MB-231 breast cancer cell lines, and LNCaP prostate cancer cell line). The heterogeneity of tumor cells can be modeled using cells from a mixture of unsynchronized cell cultures with varying cell sizes as shown in Figure 3a. Cell sizes of cultured tumor cells (14μm ~ 19μm) are smaller compared to CTCs from breast cancer patients (15μm ~ 30μm) (16), making the model system more challenging for size-based enrichment. The membrane microfilter device successfully recovered 1+ tumor cell in 96.5% (28/29) and 93.1% (27/29) of trials when five cells from single J82 cell line and a mixture of 6 different human cancer cell lines were seeded into 7.5 ml blood from a healthy donor, respectively. Furthermore, the microfilter device recovered 3 or more cells in 64% of trials. Statistical analysis showed that true probability of recovering at least one cell when 5 are seeded in 7.5 ml of blood is 95% with the 95% confidence interval between 85% and 99%, which provides a sensitive assay to detect rare event. Due to optically transparent nature of parylene filter, we were able to perform microscopic and IF analysis of cells “on-chip”, that is directly on the membrane, circumventing the need to transfer cells for analysis. Tumor cells were identified and distinguished from leukocytes by expression of CK antigens by IF; epithelial tumor cells are CK positive, while leukocytes are CK negative (Figure 3a). Moreover, CK positive CTCs captured from prostate cancer patients were imaged on membrane, showing both prostate specific antigen (PSA) positive (Figure 3b, c) and negative (Figure 3d) CTCs. We also examined negative control samples from 10 healthy individuals and none of the samples from healthy subjects had any detectable CTCs.
Figure 3.
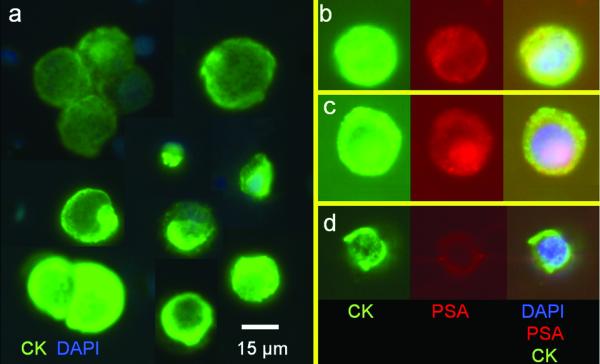
On-Chip capture and immunofluorescent (IF) testing of captured tumor cells. a) Montage of captured tumor cell lines (model system), showing expression of CK (green) by IF (with DAPI nuclear counterstain, blue); note the size heterogeneity within the model system. b) and c) CK positive/PSA positive and d) CK positive/PSA negative CTCs captured from the peripheral blood of a patient with prostate cancer. CK positive cells are green, PSA positive cells are red. When both CK and PSA are expressed, the combined color is yellow.
We also compared the performance of the microdevice for enumeration of tumor cells against a commercially available platform, the FDA-approved CellSearch® system, performed by Quest Diagnostics (San Juan Capistrano, CA) in a model system and at Memorial Sloan-Kettering Cancer Center (MSKCC), New York, NY in clinical samples. The initial set of samples using the model system were prepared in duplicates; one set was subjected to in-house microfilter-based CTC detection, while the replicate was sent for CellSearch® analysis. For the comparison of sensitivity, two sets of 5 replicates were prepared, where 10 cultured cancer cells were manually spiked under visual control into 10ml volumes of blood collected intravenously from healthy donors. Although 10ml of blood is collected, only 7.5 ml is actually tested using the CellSearch® assay per instruction from CellSearch® system. Therefore, we tested only 7.5 ml of collected blood in the microfilter device (final cell yield of 7 - 8 cells). One set of 5 replicates was shipped for CellSearch® analysis, while the other set of 5 replicates was subjected to microdevice analysis. The microdevice was able to detect at least 1 cell when 7 - 8 cells were spiked with all 5 replicates (mean = 4.6, median = 2) while the CellSearch® system detected at least 1 cell in only 3 replicates (mean = 1.2, median = 1) For the comparison of recovery rate, 5 more duplicates of blood collected from normal donor were spiked with 90 cultured cancer cells obtained through serial dilution; again, 1 set was sent for CellSearch® analysis, while the other was subjected to in house microdevice separation. The microfilter device vs. the CellSearch® system achieved recovery rates of 92 ± 14% vs. 42 ± 13%, respectively, where the microfilter device significantly outperformed the CellSearch® system (p = 0.0005, t-test, n=5, performed at Quest Diagnostics Inc.).
To compare the performance of microfilter device vs. CellSearch® using patient samples, we collected and processed a total of 57 samples from patients with metastatic cancer: prostate (n = 28), breast (n = 11), colorectal (n = 12), and bladder (n = 6). CTCs were identified in 51 patients using the microdevice, compared to only 26 patients with the CellSearch® method as tabulated in Table 1. Each CTC capture operation is completed in less than 2 minutes. The number of CTCs isolated ranged from 0 to 182 vs. 0 to 140 (microdevice vs. CellSearch®) per sample for prostate cancer (96 ± 47 vs. 18 ± 39, mean ± SD), 1 to 60 vs. 0 to 114 for breast cancer (25 ± 15 vs. 12 ± 34), 0 to 26 vs. 0 to 1 for colorectal cancer (10 ± 9 vs. 0.3 ± 0.5) and 0 to 47 vs. 0 to 1 for bladder cancer (10 ± 18 vs. 0.3 ± 0.5). As shown in Figure 4, the microfilter device outperformed the CellSearch® system in terms of recovery rates for all cancer types. When CTC were detected by both methods, greater numbers were recovered by the microfilter device in all but 5 patients. Immunomagnetic bead-based and carbon micropost enrichment methods depend on the expression of a specific surface antigen, EpCAM on the target tumor cells. EpCAM is expressed by only 75% of 134 epithelial tumors (17). In contrast, the microdevice exploits the inherent larger size of tumor cells and captures EpCAM positive and negative tumor cells. In addition, the ability to capture and characterize CTCs on a single platform simplifies the processing and prevents loss of cells, yielding high recovery rates. While the CellSearch assay may report higher number of cytokeratin-positive events, only a small proportion of these meet the strict definition of a CTC – an intact cell with DAPI-positive nucleus that is cytokeratin-positive and CD45- negative.
Table 1.
List of samples and CTC counts per 7.5 ml of blood using the CellSeardch® and Microdevice methods.
| Sample | Cancer Type |
CTC/7.5ml CellSearch® |
CTC/7.5mL Microdevice |
|---|---|---|---|
| 1 | Prostate | 22 | 77 |
| 2 | Prostate | 100 | 79 |
| 3 | Prostate | 7 | 86 |
| 4 | Prostate | 0 | 51 |
| 5 | Prostate | 0 | 94 |
| 6 | Prostate | 0 | 136 |
| 7 | Prostate | 140 | 68 |
| 8 | Prostate | 0 | 138 |
| 9 | Prostate | 100 | 157 |
| 10 | Prostate | 0 | 63 |
| 11 | Prostate | 8 | 123 |
| 12 | Prostate | 0 | 171 |
| 13 | Prostate | 1 | 56 |
| 14 | Prostate | 0 | 53 |
| 15 | Prostate | 4 | 84 |
| 16 | Prostate | 0 | 14 |
| 17 | Prostate | 44 | 182 |
| 18 | Prostate | 0 | 157 |
| 19 | Prostate | 1 | 25 |
| 20 | Prostate | 22 | 19 |
| 21 | Prostate | 5 | 16 |
| 22 | Prostate | 0 | 0 |
| 23 | Prostate | 1 | 68 |
| 24 | Prostate | 0 | 59 |
| 25 | Prostate | 0 | 19 |
| 26 | Prostate | 0 | 47 |
| 27 | Prostate | 0 | 170 |
| 28 | Prostate | 1 | 16 |
| 29 | Colorectal | 22 | 9 |
| 30 | Colorectal | 0 | 22 |
| 31 | Colorectal | 0 | 0 |
| 32 | Colorectal | 0 | 8 |
| 33 | Colorectal | 1 | 2 |
| 34 | Colorectal | 1 | 23 |
| 35 | Colorectal | 0 | 9 |
| 36 | Colorectal | 1 | 5 |
| 37 | Colorectal | 0 | 0 |
| 38 | Colorectal | 0 | 2 |
| 39 | Colorectal | 0 | 26 |
| 40 | Colorectal | 0 | 14 |
| 41 | Breast | 9 | 17 |
| 42 | Breast | 0 | 32 |
| 43 | Breast | 1 | 60 |
| 44 | Breast | 0 | 35 |
| 45 | Breast | 0 | 21 |
| 46 | Breast | 5 | 21 |
| 47 | Breast | 0 | 1 |
| 48 | Breast | 0 | 18 |
| 49 | Breast | 5 | 12 |
| 50 | Breast | 114 | 23 |
| 51 | Breast | 2 | 36 |
| 52 | Bladder | 0 | 0 |
| 53 | Bladder | 1 | 0 |
| 54 | Bladder | 0 | 47 |
| 55 | Bladder | 0 | 7 |
| 56 | Bladder | 1 | 5 |
| 57 | Bladder | 0 | 0 |
Figure 4.

Histogram demonstrating performance comparison of membrane microfilter vs. CellSearch® assay in clinical samples. Solid and striped bars denote number of CTCs detected using the commercially available CellSearch® assay and microdevice, respectively. The number of CTC positive samples were 27 vs. 14 (microdevice vs. CellSearch®) out of 28 patients for prostate cancer, 10 vs. 4 out of 12 patients for colorectal cancer, 11 vs. 6 out of 11 patients for breast cancer and 4 vs. 3 out of 6 patients for bladder cancer.
Discussion
Sensitive detection of rare CTC, a clinically relevant event in blood of cancer patients, has been a technical challenge, and in this report we demonstrate a possible solution utilizing a novel microfabricated parylene membrane filter device with simple manual syringe injection system for capturing CTC directly from human peripheral blood with minimal processing, which is capable of greater than 90% recovery with high enrichment factor (7 logs), out-performing the only FDA-approved method currently available to clinicians.. Previously, we reported the ability to perform on-chip capture integrated with electrolysis for further downstream nucleic acid analysis (15) and here we have shown that we can further characterize the cells on-chip by immunofluorescence. We have demonstrated superior recovery rate in comparison to the FDA-approved Cellsearch® system, and CTC recovery also appears superior to a recently described affinity-based microchip system that also uses antibody-based separation (7) based on the reported recovery rates using spiked model system. We have demonstrated the feasibility of using our microdevice to assay clinical specimens. Finally, standard microfabrication processes can ensure uniform manufacturing and the fact that antibodies are not required for enrichment of CTC, should provide lower cost per device, translating into lower assay costs for the patients and healthcare industry. The clinical utility of this technology can only be assessed in prospective multi-institutional clinical trials and in comparative studies with established, FDA approved technologies for CTC analysis, studies we are currently undertaking. These would move us towards analytical validation of this technology. The simplicity and portability of the microdevice provides for the potential to be incorporated as a routine clinical test. While it remains to be proven in a prospective clinical trial which we are in the process of, the CTC capture step can be performed at the bedside or office without additional equipment; thereby providing widespread access to this technology without large capital equipment outlays. This novel portable filter-based CTC enrichment microdevice could provide a cost-effective method to detect CTC with higher recovery rate for assaying metastasis, and should also be useful in monitoring therapeutic response in patients. Because virtually all solid tumors, including those of epithelial origin, are larger than the vast majority of normal cells of the blood (even small cell lung tumors are 1.5x – 4x the size of a lymphocyte (18), the microdevice should have much broader application than affinity based methods, which can only capture cells expressing high levels of the capture antigen. In initial assessments, the platform appears to provide reproducible results; our initial results from 3 independent operators yielded similar recovery rates from spiking experiments, but further studies will need to be performed. The platform has the potential to perform repeat tumor “biopsies” in patients undergoing cancer therapy through a simple blood test. The microdevice provides a single station capture, enrichment and molecular analysis tool for characterization of CTC, allowing for identification of therapeutic targets directly on the captured CTC. It is also clear that the device we have described could have utility for a variety of applications in which size based separation might be clinically important.
Statement of Translational Relevance.
The detection of circulating tumor cells (CTC) in the blood of cancer patients is a critically important issue with vast implications to the study and treatment of cancer. It has been demonstrated that CTC indicate disease progression and can be used to monitor therapeutic response. However, a major problem in the field has been the lack of sensitive and efficient methods to capture and analyze CTC. This filter-based portable microdevice exploits the differences between size of the larger epithelial CTC and the smaller hematopoetic cells and allows for efficient capture of CTC, followed by their on-chip analysis. The portable system we describe here allows for speedy bedside or in-office processing to circumvent the need for transportation to a central processing facility. Such a portable device with high CTC recovery rates and ease of post-capture analysis has the potential to revolutionize the field of CTC detection and analysis.
Acknowledgments
The authors thank participating patients for the source of clinical blood samples.
Grant Support This work was supported in part by National Institutes of Health Grant 1R21CA123027-01, Doheny Eye Institute Specialized Imaging Core grant EY03040.
Footnotes
Competing interests statement: The authors declare no competing financial interests.
References
- 1.Lugo TG, Braun S, Cote RJ, Pantel K, Rusch V. Detection and measurement of occult disease for the prognosis of solid tumors. J Clin Oncol. 2003;21:2609–15. doi: 10.1200/JCO.2003.01.153. [DOI] [PubMed] [Google Scholar]
- 2.Schabel FM., Jr Rationale for adjuvant chemotherapy. Cancer. 1977;39:2875–82. doi: 10.1002/1097-0142(197706)39:6<2875::aid-cncr2820390675>3.0.co;2-7. [DOI] [PubMed] [Google Scholar]
- 3.Pantel K, Alix-Panabieres C, Riethdorf S. Cancer micrometastases. Nat Rev Clin Oncol. 2009 doi: 10.1038/nrclinonc.2009.44. [DOI] [PubMed] [Google Scholar]
- 4.Scher HI, Jia X, de Bono JS, et al. Circulating tumour cells as prognostic markers in progressive, castration-resistant prostate cancer: a reanalysis of IMMC38 trial data. Lancet Oncol. 2009;10:233–9. doi: 10.1016/S1470-2045(08)70340-1. [DOI] [PMC free article] [PubMed] [Google Scholar]
- 5.Cristofanilli M, Budd GT, Ellis MJ, et al. Circulating tumor cells, disease progression, and survival in metastatic breast cancer. N Engl J Med. 2004;351:781–91. doi: 10.1056/NEJMoa040766. [DOI] [PubMed] [Google Scholar]
- 6.Maheswaran S, Sequist LV, Nagrath S, et al. Detection of mutations in EGFR in circulating lung-cancer cells. N Engl J Med. 2008;359:366–77. doi: 10.1056/NEJMoa0800668. [DOI] [PMC free article] [PubMed] [Google Scholar]
- 7.Nagrath S, Sequist LV, Maheswaran S, et al. Isolation of rare circulating tumour cells in cancer patients by microchip technology. Nature. 2007;450:1235–9. doi: 10.1038/nature06385. [DOI] [PMC free article] [PubMed] [Google Scholar]
- 8.de Bono JS, Scher HI, Montgomery RB, et al. Circulating tumor cells predict survival benefit from treatment in metastatic castration-resistant prostate cancer. Clin Cancer Res. 2008;14:6302–9. doi: 10.1158/1078-0432.CCR-08-0872. [DOI] [PubMed] [Google Scholar]
- 9.Paterlini-Brechot P, Benali NL. Circulating tumor cells (CTC) detection: Clinical impact and future directions. Cancer Lett. 2007 doi: 10.1016/j.canlet.2006.12.014. [DOI] [PubMed] [Google Scholar]
- 10.Rosenberg R, Gertler R, Friederichs J, et al. Comparison of two density gradient centrifugation systems for the enrichment of disseminated tumor cells in blood. Cytometry. 2002;49:150–8. doi: 10.1002/cyto.10161. [DOI] [PubMed] [Google Scholar]
- 11.Lara O, Tong XD, Zborowski M, Chalmers JJ. Enrichment of rare cancer cells through depletion of normal cells using density and flow-through, immunomagnetic cell separation. Experimental Hematology. 2004;32:891–904. doi: 10.1016/j.exphem.2004.07.007. [DOI] [PubMed] [Google Scholar]
- 12.Vona G, Sabile A, Louha M, et al. Isolation by size of epithelial tumor cells - A new method for the immunomorphological and molecular characterization of circulating tumor cells. American Journal Of Pathology. 2000;156:57–63. doi: 10.1016/S0002-9440(10)64706-2. [DOI] [PMC free article] [PubMed] [Google Scholar]
- 13.Becker FF, Wang XB, Huang Y, Pethig R, Vykoukal J, Gascoyne PR. Separation of human breast cancer cells from blood by differential dielectric affinity. Proc Natl Acad Sci U S A. 1995;92:860–4. doi: 10.1073/pnas.92.3.860. [DOI] [PMC free article] [PubMed] [Google Scholar]
- 14.Shaffer DR, Leversha MA, Danila DC, et al. Circulating tumor cell analysis in patients with progressive castration-resistant prostate cancer. Clin Cancer Res. 2007;13:2023–9. doi: 10.1158/1078-0432.CCR-06-2701. [DOI] [PubMed] [Google Scholar]
- 15.Zheng S, Lin H, Liu JQ, et al. Membrane microfilter device for selective capture, electrolysis and genomic analysis of human circulating tumor cells. J Chromatogr A. 2007;1162:154–61. doi: 10.1016/j.chroma.2007.05.064. [DOI] [PubMed] [Google Scholar]
- 16.Meng S, Tripathy D, Frenkel EP, et al. Circulating tumor cells in patients with breast cancer dormancy. Clin Cancer Res. 2004;10:8152–62. doi: 10.1158/1078-0432.CCR-04-1110. [DOI] [PubMed] [Google Scholar]
- 17.Went PT, Lugli A, Meier S, et al. Frequent EpCam protein expression in human carcinomas. Human pathology. 2004;35:122–8. doi: 10.1016/j.humpath.2003.08.026. [DOI] [PubMed] [Google Scholar]
- 18.Lee TK, Esinhart JD, Blackburn LD, Silverman JF. The size of small cell lung carcinoma cells. Ratio to lymphocytes and correlation with specimen size and crush artifact. Anal Quant Cytol Histol. 1992;14:32–4. [PubMed] [Google Scholar]