Summary
Pyruvate carboxylase (PC) is a conserved multifunctional enzyme linked to important metabolic diseases. PC homotetramer is arranged in two layers with two opposing monomers per layer. Cryo-EM explores the conformational variability of PC in the presence of different substrates. The results demonstrate that the biotin-carboxyl carrier protein (BCCP) domain localizes near the biotin carboxylase (BC) domain of its own monomer and travels to the carboxyltransferase (CT) domain of the opposite monomer. All density maps show noticeable conformational differences between layers, mainly for the BCCP and BC domains. This asymmetry may be indicative of a coordination mechanism where monomers from different layers catalyze the BC and CT reactions consecutively. A conformational change of the PC tetramerization (PT) domain suggests a new functional role in communication. A long-range communication pathway between subunits in different layers, via interacting PT-PT and BC-BC domains, may be responsible for the cooperativity of PC from S. aureus.
Introduction
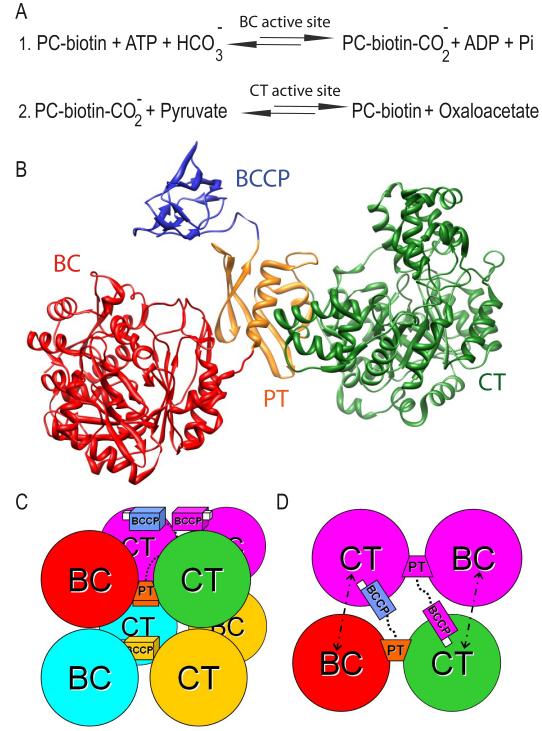
Pyruvate carboxylase (PC) is a biotin-containing multifunctional enzyme (EC 6.4.1.1) that carboxylates pyruvate into oxaloacetate, an important intermediate in the tricarboxylic acid cycle, in two sequential chemical reactions (Figure 1A) (Utter and Keech, 1960; Wallace et al., 1985). PC is linked to important metabolic processes such as glucose-induced insulin secretion and cell proliferation in pancreatic beta cells (Farfari et al., 2000; MacDonald, 1995; Xu et al., 2008), gluconeogenesis in the liver (Hanson and Patel, 1994; Robinson, 1971), glyceroneogenesis in fat cells (Reshef et al., 2003) and synthesis of a neurotransmitter, glutamate, in astrocytes (Hertz et al., 2007). The relevance of this enzyme in intermediary metabolism is supported by the various diseases related to aberrant forms of PC: lactic acidaemia, hypoglycemia, type-2 diabetes, and psychomotor retardation (Carbone et al., 2002; Carbone et al., 1998; Carbone and Robinson, 2003; Hamilton et al., 1997; Hasan et al., 2008; Lynch et al., 1992; MacDonald et al., 2009; Robinson et al., 1987; Robinson et al., 1984; Robinson and Sherwood, 1984; Van Coster et al., 1991). Consequently, since its discovery in 1960 (Utter and Keech, 1960), many efforts have been carried out towards understanding and characterization of this enzyme.
Figure 1.
Schema of the pyruvate carboxylase arrangement and function. (A) Chemical reactions carried out by PC. (B) Domain composition of the pyruvate carboxylase monomer: the biotin carboxylase (BC) domain in red, the protein tetramerization (PT) domain in orange, the carboxyl transferase (CT) domain in green and the biotin carboxyl carrier protein (BCCP) in blue. (C) A side view of the two layers of dimers comprising the homotetramer. (D) Model for the sequential chemical reactions: the biotin linked to the BCCP (in white) is carboxylated in the BC domain of its own monomer, and the transfer of the carboxyl group to pyruvate produces oxaloacetate in the CT domain of the opposite monomer.
PC is a 130kDa multifunctional single-chain enzyme in eukaryotes and most bacteria and is active only as a homotetramer (α4) (Attwood, 1995; Attwood et al., 1993; Jitrapakdee and Wallace, 1999). In archaea and some bacteria, PC is made up of two different subunits (α and β) and it is also active as a tetramer (αβ)4. The single-chain PC monomer is composed of four different domains (Figure 1B): the N-terminal biotin carboxylase (BC) domain; the central carboxyltransferase (CT) domain; a PC tetramerization (PT) domain, also known as the allosteric domain in RePC (St Maurice et al., 2007), and the C-terminal biotin carboxyl carrier protein (BCCP) domain. The BC and CT domains contain the two active sites necessary for the enzymatic activity while the BCCP domain couples both active sites. This domain contains a covalently bound biotinyl group which is carboxylated in the BC domain in a reaction that requires ATP hydrolysis. Subsequently, the BCCP domain moves to the CT domain where it transfers the carboxyl group to pyruvate, releasing oxaloacetate. Recent research reported the crystal structures for PC from Rhizobium etli (St Maurice et al., 2007), Homo sapiens and Staphylococcus aureus (Xiang and Tong, 2008; Yu et al., 2009). The monomers in the PC homotetramer are arranged in two layers, where each layer contains two antiparallel subunits that have almost no interactions with each other but maintain extensive contacts with monomers on the opposite layer through their BC-BC, CT-CT and PT-PT interacting interfaces (Figure 1C). Crystal structures showed the BCCP domain either in or close (named exo position) to the CT active site of the opposite monomer (antiparallel monomer within the same layer), explaining the need of oligomerization for catalysis. Based on the BCCP positions and the distance between the BC and CT active sites, the BCCP was predicted to translocate between the BC domain of the same subunit and the CT domain of the opposite subunit (St Maurice et al., 2007; Xiang and Tong, 2008) (Figure 1D). This prediction was confirmed by enzymatic assays using reconstituted hybrid tetramers of RePC (St Maurice et al., 2007). The fact that no BCCP has been crystallized near the BC domain yet suggests that the BCCP domain might have a greater affinity for the CT domain rather than for the BC domain (Yu et al., 2009). Mutagenesis studies have shown that the PT domain plays an important role in the tetramerization of the enzyme (Xiang and Tong, 2008). Likewise, the PT domain has also been shown to participate in binding the acetyl-CoA activator (Yu et al., 2009) and ethyl-CoA, an nonhydrolyzable analog of acetyl-CoA (St Maurice et al., 2007). Previous studies showed that the PC tetramer is much less stable in the absence of acetyl-CoA suggesting that binding of acetyl-CoA stabilizes the dimer of BC domains (Attwood et al., 1993; Yu et al., 2009).
The crystal structures of PC from different organisms have contributed to the understanding of the mechanism of action of this enzyme. The atomic structure for PC from R. etli (RePC) was found to be asymmetrical (St Maurice et al., 2007) while the atomic structures for PC from S. aureus (SaPC) and human (HsPC) were mostly symmetrical (Xiang and Tong, 2008). Furthermore, the long range communication and coordination mechanisms between subunits are yet to be understood and further work is still needed. In this work we present 3D density maps obtained for SaPC based on cryo-EM and single particle image processing. Electron density maps were obtained upon addition of different ligands: i) acetyl-CoA (SaPC/CoA); ii) acetyl-CoA and AMPPNP (SaPC/CoA-A); iii) acetyl-CoA, AMPPNP and pyruvate (SaPC/Pyr) and iv) acetyl-CoA, AMPPNP and oxaloacetate (SaPC/Oxa). Interestingly, comparison of the electron density maps obtained after addition of acetyl-CoA (SaPC/CoA), AMPPNP (SaPC/CoA-A) and pyruvate (SaPC/Pyr) does not show any significant difference between them. Within each density map (SaPC/CoA, SaPC/CoA-A and SaPC/Pyr), monomers belonging to different layers show major structural differences, which mainly correspond to the different positioning and flexibility of the BCCP domain and the conformational state of the BC domain. Addition of oxaloacetate triggers, however, a conformational change on both layers which also lead to major structural differences between layers regarding the BC and BCCP domains. The asymmetry observed between layers in all density maps, in the presence of different substrates, may be indicative of a coordination mechanism where monomers from different layers catalyze the BC and CT reactions consecutively rather than simultaneously. These results give structural evidence of the BCCP domain near the BC domain of its own monomer and support previous hybridization studies (St Maurice et al., 2007) concluding that the BCCP domain couples the BC and CT active sites of opposite subunits. Furthermore, comparison of the different electron density maps suggests a new role for the PT domain in communication within and between monomers.
Results and discussion
Cryo-EM reveals an overall symmetrical tetramer similar to that found by X-ray crystallography
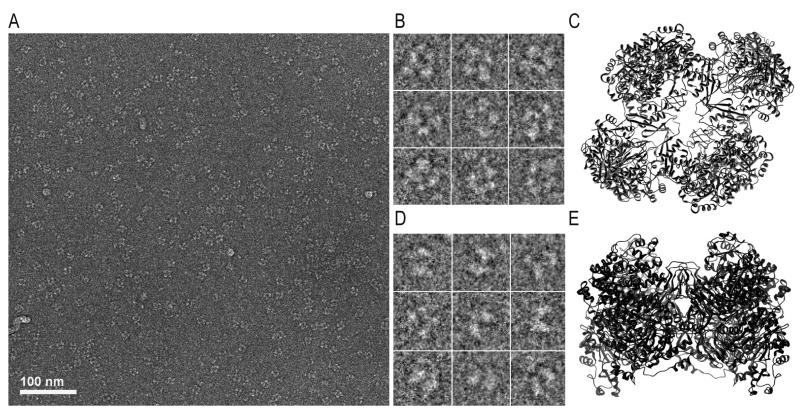
Grids for cryo-EM were prepared from solutions containing PC at a concentration of 0.1mg/ml. Electron micrographs show well defined particles resembling 2D projections of the SaPC crystal structure (Figure 2A). Some of the particles display a square-like shape delimited by four rounded regions and a central cavity (Figure 2B). These images resemble top/bottom views of the SaPC tetramer (Figure 2C). A separate cluster shows 2D images where two parallel pseudo-ellipses are joined together at a particular region (Figure 2D), similar to a lateral view of the crystal structure of SaPC (Figure 2E).
Figure 2.
SaPC observed by cryo-EM. (A) Micrograph corresponding to SaPC upon addition of acetyl-CoA and AMPPNP. (B) Particles defined by square-like shape delimited by four rounded regions (one on each corner) and a central cavity, that resemble (C) the top view of the SaPC atomic model based on 3BG5. (D) Particles characterized by two parallel pseudo-ellipses that were joined together at a particular region and resemble (E) the lateral view of the SaPC atomic model based on 3BG5.
Crystal structure analysis showed that while the SaPC tetramer obeys 222 symmetry overall, there are also significant local deviations from this symmetry for the subunits (Xiang and Tong, 2008; Yu et al., 2009). Consequently, three-dimensional reconstruction was carried out without imposing any symmetry (C1) and also enforcing a two-fold (C2) symmetry, relating monomers within the same layer, during the three-dimensional averaging. Results did not show significant differences between the electron density maps with and without imposed symmetry other than the increased resolution with C2 symmetry (Figures S1-S4). Consequently, all electron density maps described below correspond to the three-dimensional reconstructions with imposed C2 symmetry during the 3D averaging.
Previous cryo-EM experiments showed that SaPC is not very stable at low concentrations in the absence of acetyl-CoA (Yu et al., 2009). Addition of AMPPNP (SaPC/CoA-A) seems to further stabilize the homotetramer, thus improving the resolution of the electron density map from 13.4 Å to 12.26 Å (Table 1). Comparison of the electron density maps of SaPC/CoA and SaPC/CoA-A did not yield significant differences between them (Figure S2). As a result, both acetyl-CoA and AMPPNP were added prior to the addition of pyruvate and oxaloacetate in order to improve the stability of the complex.
Table 1.
Summary of the cryo-EM experiments carried out.
| Ligands | Number of Particles |
Resolution (Å) at 0.5 σ |
Resolution (Å) at 0.15 σ |
||
|---|---|---|---|---|---|
| SaPC/CoA | Acetyl-CoA (2mM) | 22,258 | 16.67 | 13.42 | |
| SaPC/CoA-A | Acetyl-CoA (2mM) AMPPNP (2mM) |
15,268 | 15.29 | 12.26 | |
| SaPC/Pyr | Acetyl-CoA (2mM) AMPPNP (2mM) KHCO3 (50mM) Pyruvate (10mM) |
9,522 | 19.3 | 13.23 | |
| SaPC/Oxa | Total | Acetyl-CoA (2mM) AMPPNP (2mM) KHCO3 (50mM) Oxaloacetate (10mM) |
69,056 | 10.31 | 7.88 |
| Class 1 | 20,695 | 12.9 | 9.11 | ||
| Class 2 | 13,471 | 13.49 | 9.45 | ||
| Class 3 | 27,943 | 11.6 | 8.53 | ||
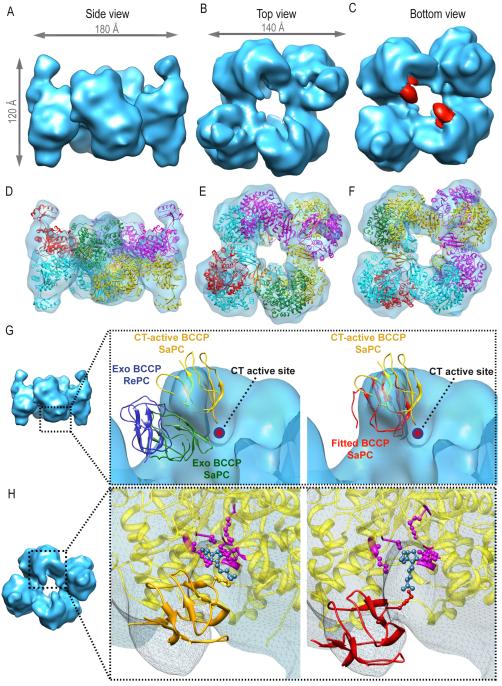
The electron density map corresponding to SaPC upon addition of acetyl-CoA and AMPPNP (SaPC/CoA-A) (Figures 3A-3C) shows a symmetrical complex of dimensions (180Å × 120Å × 140Å) similar to those computed for the crystal structure of SaPC (PDB code: 3BG5). Fitting of an atomic model based on the crystal structure (see Experimental Procedures) shows that each subunit and their domains are well defined within the boundaries of the electron density map, (Figures 3D-3F) revealing a 3D map for the SaPC/CoA-A tetramer with an overall arrangement similar to that of the crystallized SaPC. As shown in earlier work (Yu et al., 2009), the asymmetrical tetramer of RePC does not fit the SaPC/CoA-A density map.
Figure 3.
Electron density map of SaPC/CoA-A at σ = 3.44 and fitting of the atomic coordinates corresponding to SaPC (PDB code = 3BG5). (A) Lateral view. (B) Top view. (C) Bottom view, density colored in red corresponds to the BCCP domain. (D-F) Electron density map and the fitted atomic structure, each subunit is shown in a different color. (D) Lateral view. (E) Top view. (F) Bottom view. (G) Rigid fitting of RePC (PDB code: 2QF7) and SaPC within the electron density map. Displayed structures correspond to the exo BCCP domain of RePC (blue), exo BCCP domain of SaPC (green), CT active BCCP domain (yellow) and manually fitted BCCP domain into the obtained density map (red). (H) Close-up of the electron density region corresponding to the CT active site on the bottom layer. The atomic structure corresponding to the CT domain is shown in yellow, residues important for biotin (in blue) binding are highlighted in purple (Xiang and Tong, 2008): Ser911, Lys912, Gln575, Ala610, Arg644, Tyr651, Thr908. The BCCP domain corresponding to the 3BG5 active site position is shown in gold and the BCCP domain fitted into the obtained electron density map is shown in red.
SaPC shows different conformations on top and bottom layers
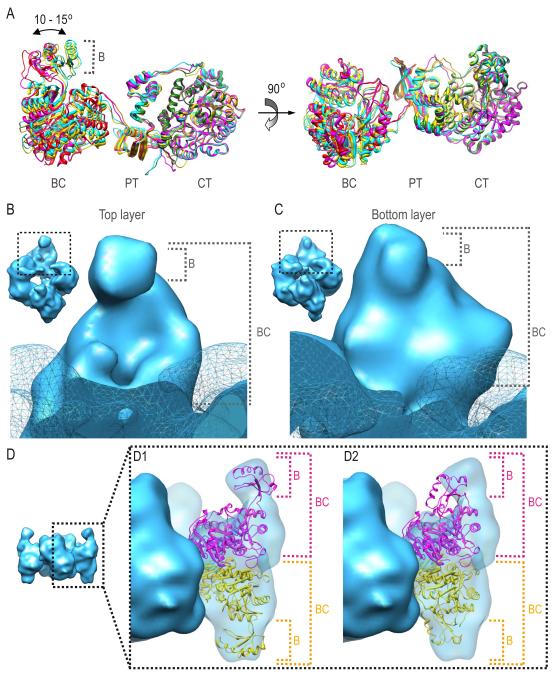
Cryo-EM studies of SaPC in complex with only acetyl-CoA (SaPC/CoA) described a mostly symmetrical enzyme (Yu et al., 2009). Electron density maps obtained after addition of pyruvate (SaPC/Pyr) do not show any significant difference with the electron density maps of SaPC/CoA and SaPC/CoA-A either (Figure S5). However, there are local differences among monomers located in different layers in each of these density maps (SaPC/CoA, SaPC/CoA-A and SaPC/Pyr). The main differences between top and bottom layers in all three complexes reside in the positioning of the BCCP and the conformational state of the BC domains. First, no BCCP domain is observed on the top layer; suggesting a flexible BCCP domain that could not be located within the 3D average density map (Figures 3B and 3E). On the bottom layer, BCCP domains can be observed near the CT active site of the opposite monomer, as in crystal structures (Figures 3C, density in red, and 3F). The cryo-EM map, however, depicts a BCCP position different from the ones observed in crystallographic studies. In the atomic structures, the BCCP was found either in the active site of the CT domain (Xiang and Tong, 2008) (Figures 3G-3H, ribbons in yellow), or in an exo site (Jitrapakdee et al., 2008; Xiang and Tong, 2008) (Figure 3G, ribbons depicted green and blue respectively). The BCCP domain was manually fitted within our cryo-EM map for SaPC/CoA-A defining a different BCCP position (Figures 3G-3H, ribbons in red). Structural comparison of the manually fitted BCCP domain and the BCCP domains in the SaPC crystal structure shows that the distance between the fitted BCCP domain and the BCCP in the CT active site is approximately 9 Å. On the other hand, the distance between the fitted BCCP domain and the BCCP in the exo position increases up to 15 Å approximately. At the BCCP position described in our SaPC/CoA-A density map, structural modeling of the biotinylated side chain of Lys1144 (Dunbrack, 2002) shows that the biotin group could still reach the CT active site (Figure 3H). The existence of several positions for BCCP confirms that a conformational flexibility of this domain is required for translocation during catalysis. Monomer overlay of the atomic model after molecular dynamics based flexible fitting within the SaPC/CoA-A density map revealed a rotation of 10-15 degrees of the BC domains with respect to each other (Figure 4A). The rotation of the BC subunits have already been described in previous crystallographic studies on RePC and SaPC which reported a BC rotation of 40 and 6-18 degrees respectively (St Maurice et al., 2007; Xiang and Tong, 2008).
Fig 4.
Conformational differences of the BC domain on top and bottom layers in SaPC/CoA-A electron density map. (A) Monomer superposition of the atomic model after flexible fitting. (B) Electron density region corresponding to the BC domain on the top layer. (C) Electron density region corresponding to the BC domain on the bottom layer. (D) Fitting of the assembled model into the given electron density map with the BC domains in (D1) open and (D2) closed conformation. Monomers are shown in magenta and yellow.
The conformation of the BC domain also differs in the top and bottom layers. The BC domain on the top layer shows a well-defined pocket (Figure 4B), whereas no pocket can be observed on the bottom layer (Figure 4C). Conformational changes on the B-subdomain determine whether the BC pocket can be observed or not. Despite the differences between layers, rigid body fitting based on models with the B-subdomain in an open (model based on crystal structure of biotin carboxylase from E. coli, PDB code: 1DV1) and closed conformation (modeled from 3BG5) suggests that the BC conformation corresponded to an open conformation on both layers (Figure 4D). While the open conformation can be clearly observed on the top layer, the structural conformation of the BC domain on the bottom layer suggests i) a different open conformation (compared to that observed for the top layer) and/or ii) an increased flexibility of the BC domain that does not allow the BC pocket to be observed on the bottom layer.
Oxaloacetate binding triggers a conformational change in SaPC
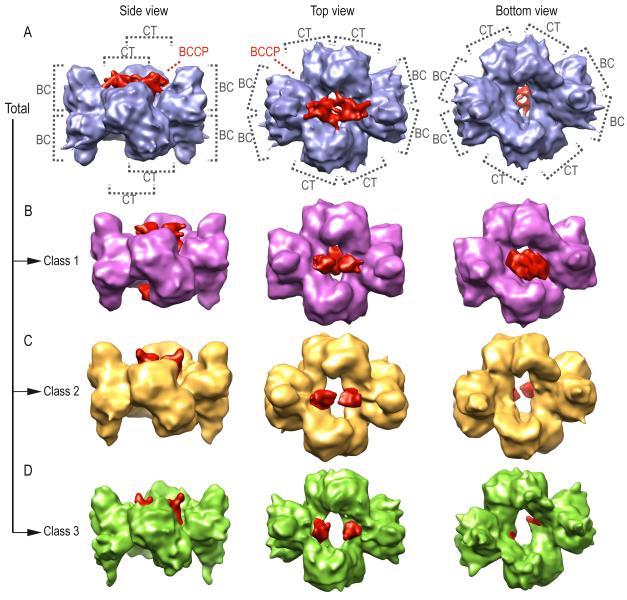
Addition of oxaloacetate (SaPC/Oxa) triggers a conformational change that yields remarkable differences compared to the other density maps and also leads to major structural differences between layers (Figure 5A). Overall, the electron density map, obtained using 69,056 single particle images (Table 1), indicates that the monomer arrangement is similar to that found for SaPC/CoA-A. The top layer shows an electron density region attributable to the BCCP domain that localizes roughly between the BC and CT domains of opposite monomers. On the bottom layer, no density that could potentially correspond to the BCCP is observed. The rendering of this density map shows poorly defined and blurred boundaries, which suggests flexibility or a mixture of conformational states in the sample. For instance, the density region of the BCCP domain on the top layer shows densities that connect this region to BC and CT domains. This is most likely indicative of a mixture of conformational states of the BCCP domain. Consequently, maximum likelihood-based unsupervised classification (Scheres et al., 2008) was carried out on the image dataset set of SaPC/Oxa in order to explore the structural variability of SaPC/Oxa (Figures 5B-5D).
Figure 5.
Electron density map of SaPC/Oxa using all particles (in blue) and the obtained density maps after maximum likelihood based classification (class 1 in purple, class 2 in yellow and class 3 in green). The density regions corresponding to BCCP domains are shown in red.
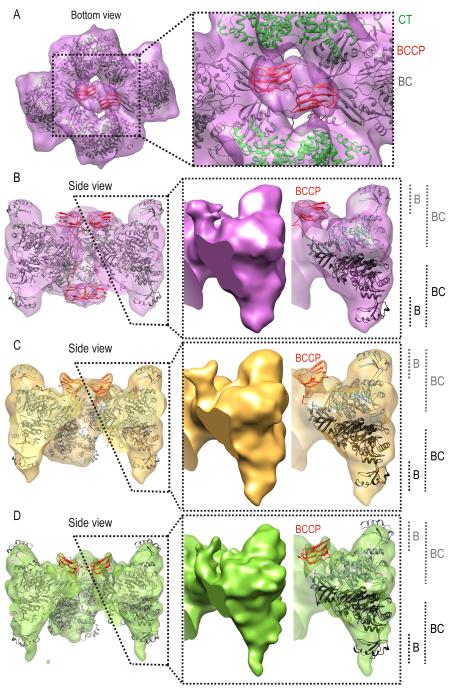
The classification yielded three classes with 20,695, 13,471 and 27,943 particles each, corresponding to 30%, 20% and 40% of the dataset respectively (Table 1). On the top layer, the density maps of each of the SaPC/Oxa classes reveal that the BCCP domain localizes near the BC domain (Figures 5B-5D, density colored in red, and 6B-6D). Structural analysis of the flexibly fitted atomic model shows that the distance between biotinylated Lys1144 Cα and the BC and CT active sites is approximately 30 Å and 60 Å respectively. Comparison of the different classes suggest that the BCCP domain gradually becomes more stable from SaPC/Oxa class 1 to SaPC/Oxa class 3 as the sigma value required to visualize the BCCP domain region increases from 2.48 to 3.79. On the contrary, the BCCP domain on the bottom layer is only observed in the density map from SaPC/Oxa class 1 (Figures 5B-5D, density colored in red). Manual fitting of this domain on the bottom layer of SaPC/Oxa class 1 depicts a central position away from the CT active site. In SaPC/Oxa class 2, the sigma value must be lowered from 3.2 to 1.8 in order to observe a density region (located in a similar position to that found for class 1) that could potentially correspond to the BCCP domain on this layer (data not shown). However, no BCCP could be observed at lower sigma values in SaPC/Oxa class 3. This suggests that the BCCP domains have gained flexibility on the bottom layer from the SaPC/Oxa class 1 to SaPC/Oxa class 3. BC domains show a different conformational state on top and bottom layers in all three SaPC/Oxa density maps (Figures 6B-6D). On the top layer, BC domains display a pocket near the BC active site in SaPC/Oxa class 1 and 2 (Figures 6B-6C). On the bottom layer, the density for SaPC/Oxa class 2 and 3 suggest that the flexibility of this domain increases as the B-subdomain is not as well defined as in SaPC/Oxa class 1. Moreover, the density relating to the bottom layer in SaPC/Oxa class 3 (Figure 6D) was found to be ill defined, thus suggesting an increase of flexibility not only for the BC domain, but also for the entire layer.
Figure 6.
Fitting of the SaPC atomic model within the electron density maps obtained after maximum likelihood based classification: (A-B) SaPC/Oxa class 1 at a sigma value σ of 2.48. (A) Bottom view of the SaPC/Oxa class 1 density map with the fitted atomic model, the CT and BCCP domains are highlighted in green and red respectively. (B) Lateral view of the clipped density map of SaPC/Oxa class 1 and the fitted atomic model, BCCP domains are highlighted in red. (C) Lateral view of the clipped density map of SaPC/Oxa class 2 at a sigma value σ of 3.2 and the fitted atomic model, BCCP domains are highlighted in red. (D) Lateral view of the clipped density map of SaPC/Oxa class 3 at a sigma value σ of 3.76 and the fitted atomic model, BCCP domains are highlighted in red.
Addition of AMPPNP (SaPC/CoA-A), KHCO3 and pyruvate (SaPC/Pyr) did not report any significant conformational change in comparison with the electron density map obtained upon addition of acetyl-CoA (SaPC/CoaA-A) (Figure S5). Consequently, the observed conformational state (relating to SaPC/CoA, SaPC/CoA-A and SaPC/Pyr) could indeed be indicative of the ground state of SaPC once the monomers are assembled together (Table 2). The observed conformation suggests that the top layer is prepared to bind the BCCP domain within the BC pocket (Figure 4B) and carry out the forward chemical reactions (Figure 1A). As with previous crystallographic studies, BCCP domains are only observed near the CT domain. This supports the hypothesis that the BCCP domain might have a higher affinity for the CT domain than for the BC domain (Yu et al., 2009).
Table 2.
Summary of the conformational states corresponding to different protein domains (BC, PT and BCCP) in SaPC observed in each density map. The CT domain was omitted as no noticeable structural differences are observed between density maps.
| Density map | Domain | Conformational state | |
|---|---|---|---|
| top layer | bottom layer | ||
| SaPC/CoA SaPC/CoA-A SaPC/Pyr |
BC | Open conformation, pocket shown |
Pocket not shown |
| PT | Symmetrical on both layers | ||
| BCCP | Not observed | Near CT active site | |
| SaPC/Oxa class1 | BC | Pocket shown | Pocket not shown |
| PT | Asymmetrical | ||
| BCCP | Near BC, oriented towards active site |
Central, not oriented towards active site |
|
| SaPC/Oxa class2 | BC | Pocket shown | Pocket not shown |
| PT | Asymmetrical | ||
| BCCP | Near BC, oriented towards active site |
Low occupancy, observed at a lower σ (1.8) |
|
| SaPC/Oxa class3 | BC | Pocket not shown | Highly flexible B subdomain, pocket not shown |
| PT | Asymmetrical | ||
| BCCP | Near BC, oriented towards active site |
Not observed | |
Addition of oxaloacetate (SaPC/Oxa) triggers a conformational change in both layers (Table 2) that might be related to the catalysis of the chemical reactions in the reverse direction (Attwood and Cleland, 1986; McClure et al., 1971). In the reverse reaction, the BCCP domain gets first carboxylated in the CT domain of the opposite subunit and then moves towards the BC domain of its own subunit where it transfers its carboxyl group and ADP gets phosphorylated into ATP (Figures 1A and 1D). No substrates were given to carry out the BC reaction in reverse order with the aim of capturing the BCCP domains close to the BC domain. Unexpectedly, only two of the four BCCP domains are found near the BC domain on one layer while the remaining BCCP domains become gradually more flexible and could not be located on the opposite layer (Figures 6B-6D).
Here, top and bottom layers were assigned according to particular structural features for clarification purposes. The layer displaying the BC pocket was regarded as the top layer and vice-versa. Likewise, the BCCP domain in the CT active site (SaPC/CoA-A) or in relative proximity to the CT active site (SaPC/Oxa class) was also considered while assigning the bottom layer. The assignment of layers should not be used to compare matching layers between SaPC/CoA-A and SaPC/Oxa density maps (eg. top layer in SaPC/CoA-A and SaPC/Oxa class 1). Addition of oxaloacetate might lead to major conformational changes (especially in the BC domain) that invert the conformational states of the top and bottom layers. Consequently, it is not possible to state whether the top layer of SaPC/Oxa (in all three classes) and its BCCP domain observed near the BC domain corresponds to the top layer of SaPC/CoA-A and its flexible BCCP domain or to the bottom layer SaPC/CoA-A and its BCCP domain located in the CT active position.
Structural evidence for the localization of the BCCP near the BC domain of its own monomer
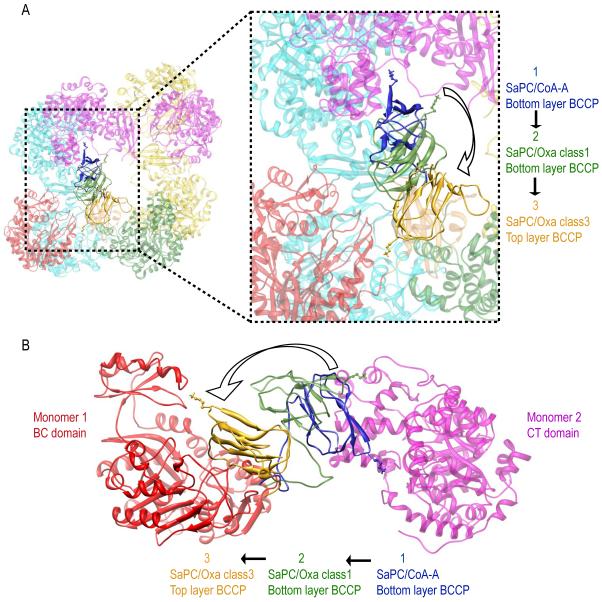
Previous crystallographic studies reported two different positions regarding the BCCP domain: i) the CT active site position and ii) the exo binding site near the CT domain (Jitrapakdee et al., 2008; St Maurice et al., 2007; Xiang and Tong, 2008). However, no structure reported the localization of the BCCP domain near the BC domain. Our results reveal that the BCCP domain can be observed near the BC active site of the same subunit (Figures 6B-6D). Comparison of the fitted BCCP domains depicts that this domain not only swings (pointing then its biotin towards the corresponding active site) but also travels between the BC and CT domains of opposite monomers during catalysis (Figure 7). Analysis of the flexibly fitted model shows that the distance between Lys1144 Cα (Dunbrack, 2002) and the BC active site is approximately 30 Å (in contrast to the approx. distance of 60 Å found between Lys1144 Cα and the CT active site). Modeling of the Lys1144 side chain and its covalently bound biotin group reduces the distance with the BC active site to approx. 20 Å. Hence, while the BCCP domain localizes near the BC domain, it still remains too far from the active site for the reaction to take place. This might be a consequence of the absence of the necessary substrates for the reverse BC reaction to occur (Figure 1A).
Figure 7.
BCCP transition from the CT active site of the opposite monomer (Monomer 2, in magenta) to the BC domain of its own monomer (Monomer 1, in red). BCCP transition is shown by superimposing the fitted BCCP domains in (i) the bottom layer of SaPC/CoA-A (in blue), (ii) the bottom layer of SaPC/Oxa class 1 (in green) and (iii) the top layer of SaPC/Oxa class 3 (in gold). (A) Top view. (B) Close up lateral view.
Cryo-EM density maps suggest a new functional role of PT domains in communication between domains and monomers
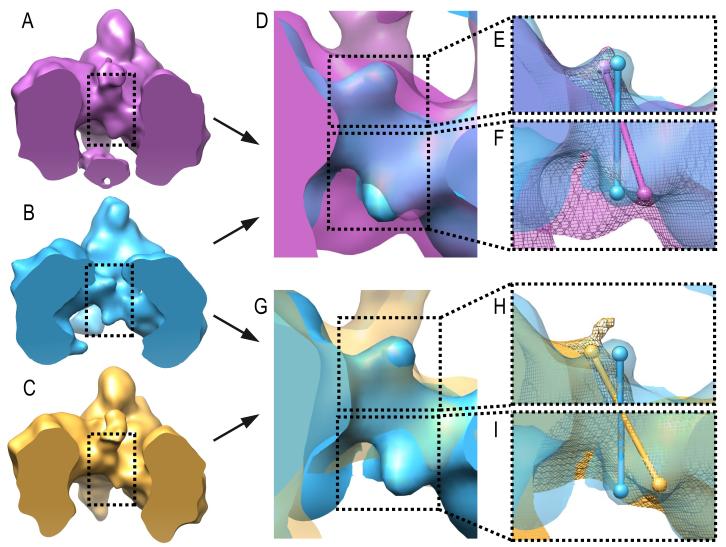
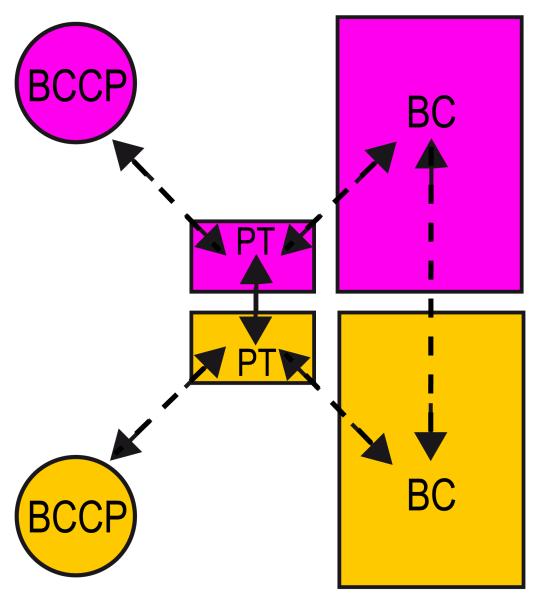
PT domains connect BCCP and BC domains within monomers. In addition, PT domains located in different layers interact with each other, thus indirectly connecting BCCP domains that belong to different layers. Therefore this domain is in a strategic location to mediate communication among domains in a single monomer; as well as monomers from different layers. The cryo-EM density maps suggest a conformational change of the PT domains on both layers upon oxaloacetate addition. Comparison of the density maps from SaPC/CoA-A, SaPC/Oxa class 1 and class 2 indicates an approximate shift of 5 Å and 10 Å of the C-terminal region of the PT domain on the top and bottom layers respectively (Figure 8). The C-terminal region of PT domains connects to BCCP domains, and the observed shift might determine the location of BCCP domains within the oligomer. Additionally, the observed conformational change of the PT domains is also characterized by an increase of flexibility on the PT domain located on the bottom layer. Unlike the SaPC/CoA-A density map, the SaPC/Oxa density maps show that the density region of the PT domains was only well defined on the top layer and the electron density corresponding to the PT domains on the bottom layer become gradually weaker (Figure S6). As with the PT domains, the BCCP domains become increasingly more flexible on the bottom layer while becoming more stable on the top layer in SaPC/Oxa density maps. The strategic location of the PT domain together with the observed conformational change of the PT domain upon oxaloacetate binding suggests that this domain might indeed play a major role in communication within monomers (connecting BC and BCCP domains) and between monomers (connecting BCCP domains) that belong to different layers. Communication via interacting PT-PT and BC-BC interfaces might be responsible for the cooperativity mechanism between subunits (Figure 9).
Figure 8.
Movement of the PT domains upon addition of oxaloacetate. (A) Lateral view of the clipped electron density of SaPC/Oxa class 1 (σ = 2.48). (B) Lateral view of the clipped electron density of SaPC/CoA-A (σ = 3.44). (C) Lateral view of the clipped electron density of SaPC/Oxa class 1 (σ = 3.2). (D) Superposition of the electron density maps of SaPC/Oxa class 1 (purple, σ = 2.48) and SaPC/CoA-A (blue, σ = 3.44). (E-F) Close up showing the superposition of the electron density maps of SaPC/Oxa class 1 (purple) and SaPC/CoA-A (blue) on the PT domain located on the top layer and bottom layer respectively. Spheres correspond to the approximate position of the C-terminus of PT domains. (E) SaPC/Oxa class 1 σ = 4.17, SaPC/CoA-A σ = 3.44. (F) SaPC/Oxa class 1 σ = 2.48, SaPC/CoA-A σ = 3.44. (G) Superposition of the electron density maps of SaPC/Oxa class 2 (gold, σ = 3.2) and SaPC/CoA-A (blue, σ = 3.44). (H-I) Close up showing the superposition of the electron density maps of SaPC/Oxa class 2 (gold) and SaPC/CoA-A (blue) on the PT domain located on the top layer and bottom layer respectively. Spheres correspond to the approximate position of the corresponding C-terminal PT domain. (H) SaPC/Oxa class 2 σ = 4.05, SaPC/CoA-A σ = 3.44. (F) SaPC/Oxa class 2 σ = 2.65, SaPC/CoA-A σ = 3.44. See also Figure S6.
Figure 9.
Schema of the communication model between domains and layers in SaPC. The dashed arrows indicate the possible communication paths between domains.
Long-range communications between the active sites in the BC subunit dimer of E. coli acetyl-CoA carboxylase (ACC), a homolog of the BC domain dimer in PC, have been proposed (de Queiroz and Waldrop, 2007; Janiyani et al., 2001; Mochalkin et al., 2008; St Maurice et al., 2007). It is suggested that the enzyme may have half-of-the-sites reactivity or negative cooperativity according to which the different monomers do not catalyze the BC reaction simultaneously but consecutively. However, the crystal structure of wild-type E. coli BC in complex with substrates (biotin, bicarbonate, MgADP) is fully symmetrical (Chou et al., 2009), and monomeric BC subunit has only a three-fold loss in activity (Shen et al., 2006). Our cryo-EM results show noticeable structural differences between subunits from different layers. Furthermore, asymmetric reconstruction did not yield significant differences between monomers within the same layer, thus implying similar conformational states of monomers from a particular layer. (Figures S1-S4). These results suggest a coordination mechanism such that monomers in different layers catalyze the BC and CT reactions consecutively. These results are not in accordance with previous x-ray experiments on SaPC which reported symmetrical crystal structures with minor differences between layers and suggest that monomers located on different layers catalyze the BC and CT reactions simultaneously (Xiang and Tong, 2008; Yu et al., 2009). Hence, future work should be directed towards the elucidation of the coordination mechanism of this enzyme.
In summary, our cryo-EM analysis reports new structural data on SaPC upon addition of different ligands. All density maps obtained show noticeable structural differences between layers mainly regarding the conformational state and localization of BC and BCCP domains. The asymmetry observed between layers, in the presence of different substrates, may be indicative of a coordination mechanism where monomers from different layers catalyze the BC and CT reactions consecutively. Addition of oxaloacetate triggers the reverse CT reaction, which leads to a conformational change on both layers: while the BCCP seems to move away from the CT domain and becomes more flexible on the bottom layer; the BCCP localizes near the BC domain and becomes more stable on the top layer. The localization of the BCCP domain near the BC domain of its own monomer gives structural evidence that the BCCP domain couples the BC and CT active sites of opposite subunits. Furthermore, comparison of the obtained density maps suggests a new functional role for the PT domains in communication. A long-range communication path between domains and subunits, via interacting PT-PT and BC-BC domains, is postulated.
Experimental Procedures
Protein expression and purification
Full length wild-type S. aureus PC was subcloned into the pET28a vector (Novagen) and overexpressed with a compatible plasmid carrying the biotin ligase (birA) gene in E. coli BL21 Star (DE3) cells at 20°C. The expression construct introduced into the protein an N-terminal hexa-histidine tag. The cells were collected by centrifugation and lysed by sonication in a buffer containing 20 mM Tris (pH 7.5), 300 mM NaCl, 0.2 mM PMSF, and 10 mM β-mercaptoethanol. The resulting lysate was then incubated with Ni-NTA agarose beads for one hour at 4°C. The beads were then washed with buffer containing 20 mM Tris (pH 7.5), 300 mM NaCl, 10 mM β-mercaptoethanol, and 20 mM imidazole. Protein was eluted with a buffer containing 20 mM Tris (pH 7.5), 100 mM NaCl, 10 mM β-mercaptoethanol, and 200 mM imidazole. The elute was run through a Sephacryl S300 gel filtration column and the purified protein was concentrated to 20 mg/ml and finally flash frozen with liquid nitrogen in a buffer containing 20 mM Tris (pH 7.5), 200 mM NaCl, 2 mM dithiothreitol (DTT), and 5% (v/v) glycerol. Aliquots of the protein were stored at −80°C and thawed on ice when needed.
Sample preparation
All SaPC samples described below were prepared by using an enzyme concentration of 0.1 mg/ml in a buffer solution containing 20 mM Tris-HCl (pH 7.5), 2 mM NaCl, and 2 mM DTT. SaPC sample with 2 mM acetyl-CoA (SaPC/CoA) was incubated for 20 min. SaPC sample with 2 mM acetyl-CoA and 2 mM AMPPNP (SaPC/CoA-A) was incubated solely with acetyl-CoA for 5 min and then further incubated for 20 min after addition of AMPPNP. SaPC sample with 2 mM acetyl-CoA, 2 mM AMPPNP, 50 mM KHCO3 and 10 mM pyruvate (SaPC/Pyr) was prepared as SaPC/CoA-A sample together with an extra 25 min incubation after addition of pyruvate. SaPC sample with 2mM acetyl-CoA, 2 mM AMPPNP, 50 mM KHCO3 and 10 mM oxaloacetate (SaPC/Oxa) was prepared as SaPC/CoA-A sample together with an extra 25 min incubation after addition of oxaloacetate. All samples were incubated at room temperature.
Cryo-electron microscopy and image processing
Cryo-EM grids were prepared following standard procedures and vitrified samples were examined on a JEM-2200FS/CR transmission electron microscope (JEOL Europe, Croissy-sur-Seine, France) at an acceleration voltage of 200kV. Micrographs were taken on Kodak films under low-dose conditions at a magnification of 50,000× (SaPC/CoA, SaPC/CoA-A and SaPC/Pyr) and 40,000× (SaPC/Oxa). Digitalization of micrographs was carried out on a Z/I Photoscan (ZEIS) scanner obtaining final pixel sizes of 2.82Å for SaPC/CoA, SaPC/CoA-A and SaPC/Pyr and 1.75 Å for SaPC/Oxa.
Particles were selected using a semi-automated procedure in Spider/Spire (Baxter et al., 2007; Frank et al., 1996) from the digitized micrographs. Image processing followed reference-based matching procedure, and CTF was corrected in 3D maps coming from groups of individual images with similar defocus in Spider/Spire (Baxter et al., 2007; Frank et al., 1996). The initial reference model was constructed based on the crystallized SaPC structure (Xiang and Tong, 2008). Three dimensional reconstructions were carried out without imposing any symmetry (C1) and by imposing two-fold (C2) symmetry. Resolution of the cryo-EM density map was estimated using a cutoff of 0.5 σ (Bottcher et al., 1997) and 0.15 σ in the Fourier shell correlation (Rosenthal and Henderson, 2003). The selected images corresponding to SaPC/Oxa were classified using a non-supervised classification method based on maximum-likelihood from the Xmipp package (Scheres et al., 2008). Electron density maps have been deposited in the Electron Microscopy Data Bank (accession numbers EMD-1736, EMD-1737, EMD-1738, EMD-1741, EMD-1742, EMD-1743, and EMD-1744).
SaPC modeling and fitting
An initial model of the complete structure of SaPC was assembled based on the atomic information of the crystallized SaPC (PDB code: 3BG5). The B subdomain was modeled so two different conformations were taken into consideration during the initial rigid body fitting: i) the closed conformation based on SaPC and ii) the open conformation based on the open conformation of the biotin carboxylase (PDB code: 1DV1) (Thoden et al., 2000). Missing loops were modeled using Swiss-PDB viewer (Guex and Peitsch, 1997).
The initial model of the complete SaPC was rigidly fitted into the reconstructed cryo-EM map using Chimera (Pettersen et al., 2004). Molecular dynamics based flexible fitting of the initial atomic model (excluding the atomic coordinates for the BCCP domain) was carried out by Flex-EM (Topf et al., 2008). The atomic coordinates of the BCCP domains were manually fitted into the different density maps.
Highlights.
Conformational differences between layers mainly concerns BC and BCCP domains.
Monomers in different layers may catalyze the BC and CT reactions consecutively.
The BCCP domain localizes near the BC active site of its own monomer.
A conformational change of the PT domain suggests a new role in communication.
Supplementary Material
Acknowledgements
We thank Melisa Lázaro for assistance during cryo-EM image processing. This work was supported by the Etortek Research Programmes 2008/2010 (Department of Industry, Tourism and Trade of the Government of the Autonomous Community of the Basque Country) (M.V.), the Innovation Technology Department of the Bizkaia County (M.V.), the National Institutes of Health (DK067238 to L.T.), and Caja Navarra (16507). L.P.C.Y. is also supported by a training program in Cellular and Molecular Foundations of Biomedical Science from the NIH (GM008798).
Footnotes
Publisher's Disclaimer: This is a PDF file of an unedited manuscript that has been accepted for publication. As a service to our customers we are providing this early version of the manuscript. The manuscript will undergo copyediting, typesetting, and review of the resulting proof before it is published in its final citable form. Please note that during the production process errors may be discovered which could affect the content, and all legal disclaimers that apply to the journal pertain.
References
- Attwood PV. The structure and the mechanism of action of pyruvate carboxylase. Int. J. Biochem. Cell Biol. 1995;27:231–249. doi: 10.1016/1357-2725(94)00087-r. [DOI] [PubMed] [Google Scholar]
- Attwood PV, Cleland WW. Decarboxylation of oxalacetate by pyruvate carboxylase. Biochemistry. 1986;25:8191–8196. doi: 10.1021/bi00373a011. [DOI] [PubMed] [Google Scholar]
- Attwood PV, Johannssen W, Chapman-Smith A, Wallace JC. The existence of multiple tetrameric conformers of chicken liver pyruvate carboxylase and their roles in dilution inactivation. Biochem. J. 1993;290(Pt 2):583–590. doi: 10.1042/bj2900583. [DOI] [PMC free article] [PubMed] [Google Scholar]
- Baxter WT, Leith A, Frank J. SPIRE: the SPIDER reconstruction engine. J. Struct. Biol. 2007;157:56–63. doi: 10.1016/j.jsb.2006.07.019. [DOI] [PubMed] [Google Scholar]
- Bottcher B, Wynne SA, Crowther RA. Determination of the fold of the core protein of hepatitis B virus by electron cryomicroscopy. Nature. 1997;386:88–91. doi: 10.1038/386088a0. [DOI] [PubMed] [Google Scholar]
- Carbone MA, Applegarth DA, Robinson BH. Intron retention and frameshift mutations result in severe pyruvate carboxylase deficiency in two male siblings. Hum. Mutat. 2002;20:48–56. doi: 10.1002/humu.10093. [DOI] [PubMed] [Google Scholar]
- Carbone MA, MacKay N, Ling M, Cole DE, Douglas C, Rigat B, Feigenbaum A, Clarke JT, Haworth JC, Greenberg CR, et al. Amerindian pyruvate carboxylase deficiency is associated with two distinct missense mutations. Am. J. Hum. Genet. 1998;62:1312–1319. doi: 10.1086/301884. [DOI] [PMC free article] [PubMed] [Google Scholar]
- Carbone MA, Robinson BH. Expression and characterization of a human pyruvate carboxylase variant by retroviral gene transfer. Biochem. J. 2003;370:275–282. doi: 10.1042/BJ20021397. [DOI] [PMC free article] [PubMed] [Google Scholar]
- Chou CY, Yu LP, Tong L. Crystal structure of biotin carboxylase in complex with substrates and implications for its catalytic mechanism. J. Biol. Chem. 2009;284:11690–11697. doi: 10.1074/jbc.M805783200. [DOI] [PMC free article] [PubMed] [Google Scholar]
- de Queiroz MS, Waldrop GL. Modeling and numerical simulation of biotin carboxylase kinetics: implications for half-sites reactivity. J. Theor. Biol. 2007;246:167–175. doi: 10.1016/j.jtbi.2006.12.025. [DOI] [PubMed] [Google Scholar]
- Dunbrack RL., Jr. Rotamer libraries in the 21st century. Curr. Opin. Struct. Biol. 2002;12:431–440. doi: 10.1016/s0959-440x(02)00344-5. [DOI] [PubMed] [Google Scholar]
- Farfari S, Schulz V, Corkey B, Prentki M. Glucose-regulated anaplerosis and cataplerosis in pancreatic beta-cells: possible implication of a pyruvate/citrate shuttle in insulin secretion. Diabetes. 2000;49:718–726. doi: 10.2337/diabetes.49.5.718. [DOI] [PubMed] [Google Scholar]
- Frank J, Radermacher M, Penczek P, Zhu J, Li Y, Ladjadj M, Leith A. SPIDER and WEB: processing and visualization of images in 3D electron microscopy and related fields. J. Struct. Biol. 1996;116:190–199. doi: 10.1006/jsbi.1996.0030. [DOI] [PubMed] [Google Scholar]
- Guex N, Peitsch MC. SWISS-MODEL and the Swiss-PdbViewer: an environment for comparative protein modeling. Electrophoresis. 1997;18:2714–2723. doi: 10.1002/elps.1150181505. [DOI] [PubMed] [Google Scholar]
- Hamilton J, Rae MD, Logan RW, Robinson PH. A case of benign pyruvate carboxylase deficiency with normal development. J. Inherit. Metab. Dis. 1997;20:401–403. doi: 10.1023/a:1005350600278. [DOI] [PubMed] [Google Scholar]
- Hanson RW, Patel YM. Phosphoenolpyruvate carboxykinase (GTP): the gene and the enzyme. Adv. Enzymol. Relat. Areas Mol. Biol. 1994;69:203–281. doi: 10.1002/9780470123157.ch6. [DOI] [PubMed] [Google Scholar]
- Hasan NM, Longacre MJ, Stoker SW, Boonsaen T, Jitrapakdee S, Kendrick MA, Wallace JC, MacDonald MJ. Impaired anaplerosis and insulin secretion in insulinoma cells caused by small interfering RNA-mediated suppression of pyruvate carboxylase. J. Biol. Chem. 2008;283:28048–28059. doi: 10.1074/jbc.M804170200. [DOI] [PMC free article] [PubMed] [Google Scholar]
- Hertz L, Peng L, Dienel GA. Energy metabolism in astrocytes: high rate of oxidative metabolism and spatiotemporal dependence on glycolysis/glycogenolysis. J. Cereb. Blood Flow. Metab. 2007;27:219–249. doi: 10.1038/sj.jcbfm.9600343. [DOI] [PubMed] [Google Scholar]
- Janiyani K, Bordelon T, Waldrop GL, Cronan JE., Jr. Function of Escherichia coli biotin carboxylase requires catalytic activity of both subunits of the homodimer. J. Biol. Chem. 2001;276:29864–29870. doi: 10.1074/jbc.M104102200. [DOI] [PubMed] [Google Scholar]
- Jitrapakdee S, St Maurice M, Rayment I, Cleland WW, Wallace JC, Attwood PV. Structure, mechanism and regulation of pyruvate carboxylase. Biochem. J. 2008;413:369–387. doi: 10.1042/BJ20080709. [DOI] [PMC free article] [PubMed] [Google Scholar]
- Jitrapakdee S, Wallace JC. Structure, function and regulation of pyruvate carboxylase. Biochem. J. 1999;340(Pt 1):1–16. doi: 10.1042/bj3400001. [DOI] [PMC free article] [PubMed] [Google Scholar]
- Lynch CJ, McCall KM, Billingsley ML, Bohlen LM, Hreniuk SP, Martin LF, Witters LA, Vannucci SJ. Pyruvate carboxylase in genetic obesity. Am. J. Physiol. 1992;262:E608–618. doi: 10.1152/ajpendo.1992.262.5.E608. [DOI] [PubMed] [Google Scholar]
- MacDonald MJ. Feasibility of a mitochondrial pyruvate malate shuttle in pancreatic islets. Further implication of cytosolic NADPH in insulin secretion. J. Biol. Chem. 1995;270:20051–20058. [PubMed] [Google Scholar]
- MacDonald MJ, Longacre MJ, Langberg EC, Tibell A, Kendrick MA, Fukao T, Ostenson CG. Decreased levels of metabolic enzymes in pancreatic islets of patients with type 2 diabetes. Diabetologia. 2009;52:1087–1091. doi: 10.1007/s00125-009-1319-6. [DOI] [PMC free article] [PubMed] [Google Scholar]
- McClure WR, Lardy HA, Kneifel HP. Rat liver pyruvate carboxylase. I. Preparation, properties, and cation specificity. J. Biol. Chem. 1971;246:3569–3578. [PubMed] [Google Scholar]
- Mochalkin I, Miller JR, Evdokimov A, Lightle S, Yan C, Stover CK, Waldrop GL. Structural evidence for substrate-induced synergism and half-sites reactivity in biotin carboxylase. Protein Sci. 2008;17:1706–1718. doi: 10.1110/ps.035584.108. [DOI] [PMC free article] [PubMed] [Google Scholar]
- Pettersen EF, Goddard TD, Huang CC, Couch GS, Greenblatt DM, Meng EC, Ferrin TE. UCSF Chimera--a visualization system for exploratory research and analysis. J. Comput. Chem. 2004;25:1605–1612. doi: 10.1002/jcc.20084. [DOI] [PubMed] [Google Scholar]
- Reshef L, Olswang Y, Cassuto H, Blum B, Croniger CM, Kalhan SC, Tilghman SM, Hanson RW. Glyceroneogenesis and the triglyceride/fatty acid cycle. J. Biol. Chem. 2003;278:30413–30416. doi: 10.1074/jbc.R300017200. [DOI] [PubMed] [Google Scholar]
- Robinson BH. Transport of phosphoenolpyruvate by the tricarboxylate transporting system in mammalian mitochondria. FEBS Lett. 1971;14:309–312. doi: 10.1016/0014-5793(71)80287-9. [DOI] [PubMed] [Google Scholar]
- Robinson BH, Oei J, Saudubray JM, Marsac C, Bartlett K, Quan F, Gravel R. The French and North American phenotypes of pyruvate carboxylase deficiency, correlation with biotin containing protein by 3H-biotin incorporation, 35S-streptavidin labeling, and Northern blotting with a cloned cDNA probe. Am. J. Hum. Genet. 1987;40:50–59. [PMC free article] [PubMed] [Google Scholar]
- Robinson BH, Oei J, Sherwood WG, Applegarth D, Wong L, Haworth J, Goodyer P, Casey R, Zaleski LA. The molecular basis for the two different clinical presentations of classical pyruvate carboxylase deficiency. Am. J. Hum. Genet. 1984;36:283–294. [PMC free article] [PubMed] [Google Scholar]
- Robinson BH, Sherwood WG. Lactic acidaemia. J. Inherit. Metab. Dis. 1984;7(Suppl 1):69–73. doi: 10.1007/BF03047378. [DOI] [PubMed] [Google Scholar]
- Rosenthal PB, Henderson R. Optimal determination of particle orientation, absolute hand, and contrast loss in single-particle electron cryomicroscopy. J. Mol. Biol. 2003;333:721–745. doi: 10.1016/j.jmb.2003.07.013. [DOI] [PubMed] [Google Scholar]
- Scheres SH, Nunez-Ramirez R, Sorzano CO, Carazo JM, Marabini R. Image processing for electron microscopy single-particle analysis using XMIPP. Nat. Protoc. 2008;3:977–990. doi: 10.1038/nprot.2008.62. [DOI] [PMC free article] [PubMed] [Google Scholar]
- Shen Y, Chou CY, Chang GG, Tong L. Is dimerization required for the catalytic activity of bacterial biotin carboxylase? Mol. Cell. 2006;22:807–818. doi: 10.1016/j.molcel.2006.04.026. [DOI] [PubMed] [Google Scholar]
- St Maurice M, Reinhardt L, Surinya KH, Attwood PV, Wallace JC, Cleland WW, Rayment I. Domain architecture of pyruvate carboxylase, a biotin-dependent multifunctional enzyme. Science. 2007;317:1076–1079. doi: 10.1126/science.1144504. [DOI] [PubMed] [Google Scholar]
- Thoden JB, Blanchard CZ, Holden HM, Waldrop GL. Movement of the biotin carboxylase B-domain as a result of ATP binding. J. Biol. Chem. 2000;275:16183–16190. doi: 10.1074/jbc.275.21.16183. [DOI] [PubMed] [Google Scholar]
- Topf M, Lasker K, Webb B, Wolfson H, Chiu W, Sali A. Protein structure fitting and refinement guided by cryo-EM density. Structure. 2008;16:295–307. doi: 10.1016/j.str.2007.11.016. [DOI] [PMC free article] [PubMed] [Google Scholar]
- Utter MF, Keech DB. Formation of oxaloacetate from pyruvate and carbon dioxide. J. Biol. Chem. 1960;235:PC17–18. [PubMed] [Google Scholar]
- Van Coster RN, Fernhoff PM, De Vivo DC. Pyruvate carboxylase deficiency: a benign variant with normal development. Pediatr. Res. 1991;30:1–4. doi: 10.1203/00006450-199107000-00001. [DOI] [PubMed] [Google Scholar]
- Wallace JC, Phillips NB, Snoswell MA, Goodall GJ, Attwood PV, Keech DB. Pyruvate carboxylase: mechanisms of the partial reactions. Ann. N. Y. Acad. Sci. 1985;447:169–188. doi: 10.1111/j.1749-6632.1985.tb18436.x. [DOI] [PubMed] [Google Scholar]
- Xiang S, Tong L. Crystal structures of human and Staphylococcus aureus pyruvate carboxylase and molecular insights into the carboxyltransfer reaction. Nat. Struct. Mol. Biol. 2008;15:295–302. doi: 10.1038/nsmb.1393. [DOI] [PubMed] [Google Scholar]
- Xu J, Han J, Long YS, Epstein PN, Liu YQ. The role of pyruvate carboxylase in insulin secretion and proliferation in rat pancreatic beta cells. Diabetologia. 2008;51:2022–2030. doi: 10.1007/s00125-008-1130-9. [DOI] [PMC free article] [PubMed] [Google Scholar]
- Yu LP, Xiang S, Lasso G, Gil D, Valle M, Tong L. A symmetrical tetramer for S. aureus pyruvate carboxylase in complex with coenzyme A. Structure. 2009;17:823–832. doi: 10.1016/j.str.2009.04.008. [DOI] [PMC free article] [PubMed] [Google Scholar]
Associated Data
This section collects any data citations, data availability statements, or supplementary materials included in this article.


