

Abstract
Current far-field fluorescence nanoscopes provide subdiffraction resolution by exploiting a mechanism of fluorescence inhibition. This mechanism is implemented such that features closer than the diffraction limit emit separately when simultaneously exposed to excitation light. A basic mechanism for such transient fluorescence inhibition is the depletion of the fluorophore ground state by transferring it (via a triplet) in a dark state, a mechanism which is workable in most standard dyes. Here we show that microscopy based on ground state depletion followed by individual molecule return (GSDIM) can effectively provide multicolor diffraction-unlimited resolution imaging of immunolabeled fixed and SNAP-tag labeled living cells. Implemented with standard labeling techniques, GSDIM is demonstrated to separate up to four different conventional fluorophores using just two detection channels and a single laser line. The method can be expanded to even more colors by choosing optimized dichroic mirrors and selecting marker molecules with negligible inhomogeneous emission broadening.
Introduction
Conventional and confocal fluorescence microscopy cannot separate similar structures that are closer together than approximately half the wavelength of light (>200 nm) due to diffraction (1). In the last decade, the diffraction barrier has been overcome by judiciously exploiting the photophysical properties of the markers used to tag the structures of interest (2–4). More specifically, employing a molecular mechanism to inhibit the fluorescence emission of adjacent (groups of) markers enabled the separation of inseparable features by causing them to emit sequentially. For example, in stimulated emission depletion (STED) fluorescence microscopy, adjacent groups of molecules are separated by sequentially preventing their fluorescence through stimulated emission. Only a subset of the fluorophores exposed to the excitation light is thus allowed to fluoresce at a given point in time (2,3). This concept has been extended by replacing stimulated emission with other fluorescence inhibition mechanisms such as depleting the fluorophore ground state by transferring them in a dark or a nonexcitable fluorescent state (5,6), or by cis-trans photoisomerization (7).
In the early days of fluorescence nanoscopy or superresolution fluorescence imaging, this on-off principle of molecular separation has been implemented in a targeted way, such that the coordinates of molecular emission were predefined by a pattern of light. More recently, other approaches, turning on and off molecular emission stochastically, molecule by molecule, have been invented, implemented, and successfully applied (8–11). By using transitions between (metastable) on- and off-states, these methods called photoactivated localization microscopy (PALM) (8,10) or stochastic optical reconstruction microscopy (STORM) (9) or ground state depletion microscopy followed by individual molecule return (GSDIM) (12), or direct stochastic optical reconstruction microscopy (dSTORM) (13), etc., ensure that during each camera frame, statistically only a single marker molecule per diffraction area is in a state where it is able to emit fluorescence. The spatial position of the emitter can then be determined with subdiffraction precision and registered in a position histogram. On and off turning of many marker molecules allows the reconstruction of an image with subdiffraction spatial resolution.
Importantly, the elucidation of complex biological processes often requires the determination of the spatial organization of two or even more types of biomolecules on subdiffraction length scales (14). Before the advent of optical nanoscopy, colocalization on the nanometer scale (15–17) could only be investigated by Förster resonance energy transfer (18) or elaborate measurement techniques in very sparsely labeled samples (19–22). Fortunately, both the coordinate-targeted and the stochastic nanoscopy approaches are compatible with multicolor imaging. In fact, two-color STED (15,23,24) and two-color stochastic nanoscopes (16,17,25) have been successfully employed. In all cases, the different biomolecules are tagged with different markers and separation of their signals is accomplished through their spectral properties.
The separation of dyes can be achieved by detection in multiple channels monitoring different wavelength ranges and/or by excitation or activation of different dyes using different excitation wavelengths. Even though the use of several laser wavelengths and/or sequential image acquisition increase complexity and slow down the imaging process, these approaches have been widely used because it was hardly possible to avoid cross-talk when detecting simultaneously. Importantly, by combining single-molecule spectroscopy with single-molecule-based nanoscopy (26,27), this problem can be solved. Individual molecules can be classified based on their spectroscopic characteristics, such as the emission spectrum (26,27) or anisotropy (28). In bulk measurements, the number of detection channels has to match or even exceed that of the labeled species (14). In contrast, in single-molecule recordings, two detection channels monitoring different wavelength regions are enough to discriminate between several emission spectra. Because all photons emitted by a marker during a camera frame can be assigned to this marker, its emission spectrum leads to a characteristic photon count ratio between the two channels, thus identifying the type of marker (26,27).
Unfortunately, the full potential of this approach has yet to be exploited because the number of chromatically distinguishable photoswitchable probes is limited. When available, limitations often arise from lack of biocompatibility. Further, their labeling and switching performance under certain conditions may be insufficient or they may call for dedicated activation lasers. In cells, this approach has therefore been limited to nanoscale imaging of two different biomolecules (27,29), which may not be sufficient for some biological applications. Therefore, a single-molecule-based stochastic nanoscopy approach relying on standard fluorophores is highly interesting. In fact, it has been suggested to transiently turn off (conventional) fluorophores by switching them from their usual on- to a transient off-state (30), particularly by depleting their ground state and transiently transferring them in a dark (triplet) state. Contrary to PALM and the standard versions of STORM, this approach uses conventional fluorophores. These fluorophores are initially in their regular fluorescent state, but after continuous excitation are subsequently largely inactivated. As a consequence, only individual, isolated fluorophores are left in their active singlet system. This approach has been termed ground state depletion microscopy followed by individual molecule return (GSDIM) (12), and is also reported as direct stochastic optical reconstruction microscopy (dSTORM) (13,31) or blinking microscopy (32). All these approaches greatly benefit from appropriate engineering of their dark (triplet or redox) states. This may entail the use of an embedding medium with low oxygen mobility or the presence of reducing and/or oxidizing compounds (12,13,31–34). It has thus been shown that images of biological specimens with down to 10-nm resolution can be realized with a multitude of commercially available organic dyes (12,13,31–34) or fluorescent proteins (12,34,35) even in living cells (12,31,35). This greatly enlarges the pool of markers available for single-molecule-based multicolor nanoscopy under various imaging conditions.
By careful selection of the markers used and spectral splitting of fluorescence in the two detection channels, we were thus able to combine GSDIM and single-molecule spectroscopy to discriminate up to four molecular species at the nanoscale. Our nanoscope operates with a single laser line, with a single camera and with only two detection channels implemented in two distinct regions of the camera chip. The single-molecule approach enabled us to generate multicolor nanoscopy images of fixed and living mammalian cells using labels with emission spectra shifted <20 nm. Our results thus demonstrate that, owing to the wide range of fluorescent organic dyes and proteins, nanoscopy by GSDIM allows for great flexibility in biolabeling, under some conditions, even in living cells. At the same time they enable the design of true multicolor imaging applications. In fact, we present approaches that will allow, in the future, single-molecule-based stochastic nanoscopes to resolve even more than four species at once. Simple and yet most sensitive GSDIM multicolor imaging further extends the applicability of far-field nanoscopy and allows tackling many scientific tasks that, to our knowledge, have so far been out of reach.
Materials and Methods
Fixed cells—immunofluorescence
PtK2 cells were utilized in all of our experiments. These cells originate from the kidney epithelia cells of the marsupial Potorous tridactylus. For immunolabeling the cells were grown on coverslips to a confluence of ∼80%, fixed with 8% (w/v) formaldehyde in phosphate-buffered saline (PBS, 137 mM NaCl, 3 mM KCl, 8 mM Na2HPO4, 1.5 mM KH2PO4, pH 7) for 5 min at 37°C, extracted with 0.5% (v/v) Triton X-100 in PBS and blocked with 5% (w/v) bovine serum albumin in PBS. Immunolabeling of peroxisomes and clathrin was realized using polyclonal rabbit antibodies against Pmp70 (Abcam, Cambridge, UK) and clathrin (Abcam), respectively. For immunolabeling of tubulin rabbit antibodies against α-tubulin (Abcam) and of vimentin mouse monoclonal antibodies against vimentin (Sigma Aldrich, St. Louis, MO) were applied. The primary antibodies were detected with fluorescently labeled secondary antibodies: Alexa488-goat anti-mouse IgG, Alexa514-goat anti-rabbit IgG (Invitrogen, Carlsbad, CA), Cy3-goat anti-rabbit IgG (Jackson ImmunoResearch, West Grove, PA) and goat anti-rabbit IgG antibodies (Jackson ImmunoResearch) custom-labeled with Rhodamine 3C (36) or Atto532 (Atto-Tec, Siegen, Germany). We applied two sets of blocking antibodies, mouse anti-chicken/goat anti-mouse (FAB) and rabbit anti-chicken/goat anti-rabbit (FAB) (Jackson ImmunoResearch) to facilitate double immunolabeling with primary antibodies derived from the same species. Alexa488-phalloidin (Invitrogen, Carlsbad, CA) was applied for labeling F-actin filaments. After labeling, the samples were spincoated with poly-vinyl-alcohol (PVA, 1%, pH 8.4), and directly observed in the microscope.
Living cells
Living PtK2 cells were either labeled by an organic dye using the SNAP tag technology (Covalys Biosciences, Witterswil, Switzerland) (37,38) or by different fluorescent proteins. We tagged Caveolin 1 (Cav1) and Caveolin2 (Cav2) with hAGT at their C-termini, the microtubule-associated protein 2 (MAP2) with hAGT at its N-terminus, and β-actin with mCherry at its C-terminus. The respective plasmids were constructed by Gateway vector conversion (Invitrogen) from the donor vectors pDONR223-Cav1, pDONR223-Cav2, pDONR223-β-actin, and pDONR223-MAP2 and the empty destination vectors pMD-mCherry-N, pSEMS-SNAP26m-Gateway, and pSEMS-Gateway-SNAP26m (Covalys Biosciences). To target the fluorescent protein Citrine (39) to the lumen of the endoplasmic reticulum (ER), the coding sequence was amplified by polymerase-chain reaction (PCR) using the primers CTG CAG GTC GAC ATG GTG AGC AAG GGC GAG GA and TTC TGC GGC CGC CTT GTA CAG CTC GTC CAT GCC GCC GGT. The PCR fragments were digested with SalI and NotI and inserted into the vector pEF/myc/ER (Invitrogen). The resultant fusion proteins were directed to the ER and then retained in this organelle. For transfection, the PtK2 cells were grown overnight on glass coverslips. After reaching ∼80% confluence, the plasmids were introduced using the Nanofectin kit according to the manufacturer's instructions (PAA, Pasching, Austria). At 48–72 h after transfection, the cells were prepared for microscopy. For labeling SNAP-tagged proteins, cells transfected with the respective constructs were incubated for 15–30 min at 37°C in Dulbecco's Modified Eagle Medium (DMEM) containing 1 μM SNAP-Cell Tetra-Methyl-Rhodamine (TMR)-Star or SNAP-Cell Oregon Green (New England Biolabs, Ipswich, MA). Afterwards, they were washed for >30 min in DMEM without dye. Imaging was performed in DMEM (without phenol red) containing 10 mM HEPES.
Multicolor nanoscopy
Multicolor nanoscopic GSDIM imaging was performed on a home-built setup as described before (27) (Fig. 1 a). The nanoscope was equipped with a continuous-wave 488 nm laser line (Ar-Kr laser Innova 70C-5; Coherent, Santa Clara, CA) for fluorescence excitation, an oil immersion objective lens (HCX PL APO 100×/1.4 oil; Leica, Wetzlar, Germany), for creating an ∼(34 × 34) μm2 large excitation spot and for collection of fluorescence, and with a fast electron-multiplying charge-coupled device (EMCCD) camera (IXON-DU-897-CSO-BV; Andor Technology, Belfast, Northern Ireland) for detection of fluorescence in epi-direction. The use of an EMCCD camera at high gain ensured that the read-out noise was negligible. The frame rate of the camera was optimized to minimize the background (76 Hz in fixed and 100 Hz in living cells) (11,40). Two-color detection was realized by splitting up the detected fluorescence using a dichroic mirror (z550DCXR or z560DCXR; AHF Analysentechnik, Tübingen, Germany) and imaging onto two separate regions of the camera. The fluorescence was further cleaned by inserting a band-pass filter (532/75 and 576/80, respectively; AHF Analysentechnik) to minimize the out-of-band background in each channel.
Figure 1.
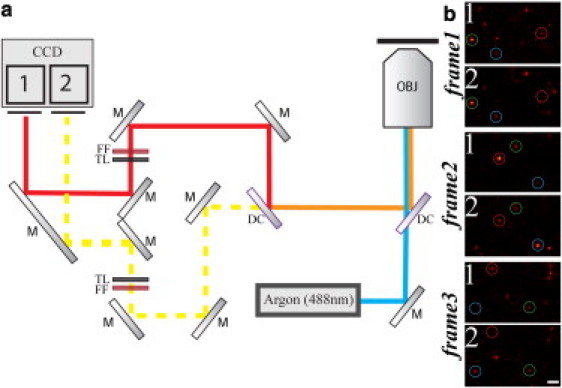
(a) Multicolor nanoscopy setup based on GSDIM, which is essentially a wide-field microscope equipped with a single continuous-wave laser source (Argon 488 nm) and a fast EMCCD camera. Fluorescence is collected by a microscope objective with high numerical aperture (OBJ), separated from the excitation light by a dichroic mirror (DC), split by another dichroic mirror (DC) into two wavelength ranges, and imaged onto two separate areas (area 1 and area 2) of the same EMCCD chip. Labels: (M) Mirror; (FF) fluorescence filter; (TL) tube lens. (b) Three consecutive exemplary camera frames of our GSDIM recordings of Fig. 2 showing on-off blinking of single isolated fluorophores with different ratios of signal counts in the area 1 (>550 nm) and area 2 (<550 nm) of the camera (blue circle, Alexa488 assignment; green circle, Atto532 assignment; red circle, Cy3 assignment). Scale bar 1 μm.
Image acquisition, localization, spectral assignment, image reconstruction, and simulations of two-dimensional histograms were performed as described in detail before (27). In most cases, image acquisition was started after dark-state transfer and prebleaching parts of the fluorophore ensemble until blinking of single emitters was observed. Appropriate thresholding of photon numbers ensured the minimization of multimolecular events (27). The unwanted presence of multiple molecule events can be detected by monitoring the brightness distribution of the events and, e.g., excluding parts of the sequence where the average brightness is above a certain threshold (27). We defined the average number of photons nfl detected per single emitter by the expectation value of the geometrical distribution of photon counts per spots detected over the whole image recording process. The cross-talk of spectral assignment was determined from the number of falsely allocated events of the GSDIM recordings of the single labeled samples. For the respective wide-field images, we simply added up the photons detected for all single-molecule events in the two channels, respectively. This gives the most direct comparison, because these images are established at the same time, with the same signal and with the same experimental parameters as the GSDIM images.
Results and Discussion
We realized multicolor nanoscopic GSDIM imaging on a conventional wide-field fluorescence microscope (Fig. 1 a) equipped with a single continuous-wave 488 nm laser line for excitation and a fast EMCCD camera for detection of single-molecule fluorescence, respectively. The illumination spot was ∼30 μm in diameter. GSDIM is based on transferring most of the fluorescent markers into a metastable dark state such as the triplet or redox states, so that only a single marker molecule within the diffraction area is able to emit fluorescence during a camera recording frame. This oftentimes requires specific engineering of the molecular environment to realize long dark-state lifetimes and short but bright fluorescence bursts (12,13,31–33). In our imaging of fixed cells we achieved such conditions by PVA embedding, and irradiating the fluorescently labeled cellular samples with a rather high laser intensity of ≈10 kW/cm2 (12) (Fig. 1 b). The fluorescence of those molecules residing in their fluorescent (bright) state was detected and their spatial coordinates were calculated from the diffraction limited spot on the camera. As molecules constantly convert to and return from the dark state, the positions of a large number of markers could be determined by analyzing a long series of camera frames recorded in sequence (12). To minimize background noise, we adjusted the camera frame time to 13 ms, thus approximately matching the on-time of the markers (11,40).
PVA is a commonly used mounting medium for fixed cells. Mounting in PVA usually results in a prolongation of the lifetime of the embedded fluorophores' dark triple state (due to, for example, a reduced mobility of molecular oxygen), or in the reinforcement of long-lived radical states (41). These dark states may open up very efficient photobleaching channels (42). This is, in principle, of minor importance for GSDIM, because a fluorophore may be allowed to photobleach after it has been registered, i.e., after it has been switched on once. Multiple imaging of the same sample region or an optimized image contrast, however, require a large number of on-off blinking events, i.e., a large photostability, which is sufficiently given for a number of dyes in PVA, including those used in our experiments (6,12).
The key to our multicolor detection scheme is the separation of the fluorescence signal into two channels, monitoring different wavelengths ranges (Fig. 1 a). Because we observe single molecules only, the number of colors to be separated may significantly exceed the number of detection channels (26). The fluorescence of a single emitter is automatically split into the two channels with a characteristic ratio depending on its emission spectrum (Fig. 1 b). This ratio uniquely identifies the molecular species and therefore allows the classification of each event (26,27). Because the procedure relies exclusively on differences in the emission spectrum, it avoids sequential recording of the various colors, and can be implemented using a single laser line only.
Fig. 2 a shows a three-color GSDIM nanoscopy image of F-actin, clathrin, and tubulin in fixed PtK2 cells. Labeling was performed with the commercially available organic dyes Alexa488, Atto532, and Cyanin 3 (Cy3), respectively. The three cellular structures could be separated with a spatial resolution far below that of the conventional fluorescence image. From the average number of photons detected per single emitter (nfl ≈ 700–800), we estimated a localization accuracy of d = d0/√(nfl/2) ≈ 15 nm (where d0 ≈ 270 nm is the diameter of the point-spread-function of the classical wide-field microscope) (27). The actual spatial resolution of our GSDIM images may be slightly elevated due to, among others, sample drifts over the ∼20-min-long recording time. The three different dyes were readily distinguished due to their slightly different emission characteristics. Fig. 2 b depicts the fluorescence emission spectra, which are shifted by only ∼30–40 nm between the different markers. Further, the dye-characteristic two-dimensional intensity histograms are shown (Fig. 2 c), highlighting the number of events registered for each combination of photon counts in the two detection channels. These histograms are the gauge measurements performed on single-stained samples before each experiment, to account for possible variations of the emission spectra with changing labeling or imaging conditions. When normalized, they give the probability distribution of detecting certain photon count pairs for each molecular species based on which unknown events can be assigned to one of the marker species. Here we used the common strategy of assigning each event to the species which produces the registered photon count pair with the highest probability (27). In a sample where all species occur with the same probability, this approach minimizes false assignments. Fig. 2 d shows the probability of a correct assignment for each possible photon count pair. The black regions are excluded due to insufficient calibration data (27). Despite the use of a single excitation laser and a shift of <40 nm of the emission maxima of the different markers, the probability of false classification was <10%. We determined this cross-talk value from the nanoscopy images performed on single-stained samples (Fig. 2 e). Note that, in addition to its limited spatial resolution, the conventional wide-field image did not allow a straightforward color assignment (inset, Fig. 2 a), because more than just two detection channels and linear-unmixing algorithms would be necessary to accurately distinguish three or more colors (14).
Figure 2.
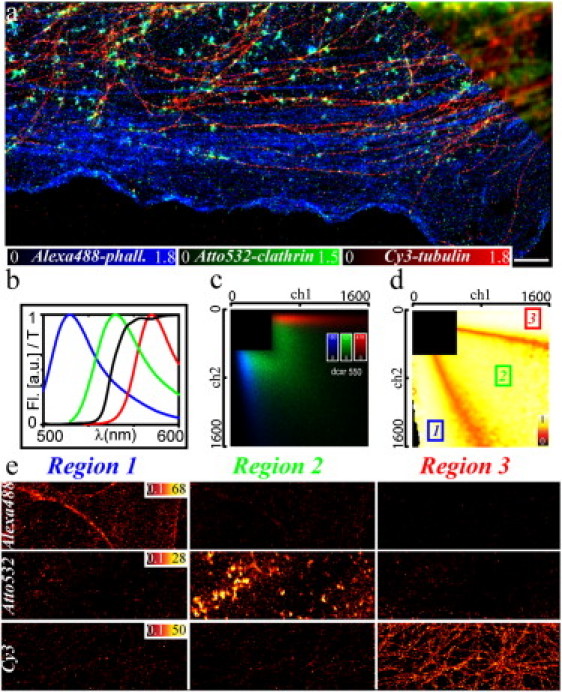
Three-color GSDIM of fixed cells. (a) Nanoscopy and conventional wide-field (upper right corner) image of three different structures in fixed PtK2 cells: Alexa488-phalloidin labeled F-actin (blue), Atto532-marked clathrin (green), and Cy3-labeled tubulin (red). (b) Fluorescence emission spectra (Fl) of Alexa488 (blue), Atto532 (green), and Cy3 (red) and transmission characteristic (T) of the dichroic mirror (black). (c) Two-dimensional histogram of photon pairs simultaneously registered in the two detection channels from the control experiments on single-stained samples; colors and structures as in panel a. (d) Two-dimensional photon pair assignment distribution constructed from panel c. Photon pairs of region 1 are assigned to Alexa488, of region 2 to Atto532 and of region 3 to Cy3. The color table encodes the confidence of assignment, i.e., the probability of a correct assignment if all marker species are assumed to occur with the same frequency. It drops to ∼50% in regions where the distributions in panel b strongly overlap but events are less probable. Black regions are excluded due to photon thresholds or insufficient calibration data. The assignment cross-talk could be further reduced at the cost of dynamic range by excluding regions where the confidence is below a certain threshold. (e) Nanoscopy images of the single-stained samples (upper panels, Alexa488-f-actin; middle panels, Atto532-clathrin; lower panels, Cy3-tubulin) for each assigned color (left panels, Alexa488 assignment, region 1 of panel d; middle panels, Atto532 assignment, region 2 of panel d; right panels, Cy3 assignment, region 3 of panel d). The probability of false classification or the assignment cross-talk is <10%. I = 10 kW/cm2, 90,000 camera frames, frame time 13 ms, scale bar 2 μm.
We note that the single-molecule approach allows further reduction of cross-talk by simply discarding events in regions where the confidence of assignment is low, i.e., where the values in Fig. 2 d are below a certain threshold (27). In fact, depending on the problem at hand, the assignment procedure can be tailored even further by changing the strategy. For example, false positives of a species can be reduced by trading-off dynamic range in this channel. Obviously, our analysis approach cannot identify or compensate the minor cross-talk problem common to all multicolor immunolabeling, i.e., a possible cross-reactivity of the utilized antibodies. We minimized such cross-reactivity by using antibodies derived from different host species or by blocking of free binding sites.
Importantly, our nanoscope performs well with almost any organic dye and we can thus choose from a large range of potential markers (12). With Alexa488, Alexa514, and Rhodamine 3c (36), the nanoscopy image shown in Fig. 3 a exemplifies another marker combination, realizing an equally accurate color separation while again applying a single excitation laser. So far, we have used a dichroic mirror centered at 550 nm to separate the fluorescence emission onto the two channels. Shifting this separation wavelength to 560 nm resulted in a marked tilt of the two-dimensional photon distributions (Fig. 3 b). This shift left potential space for an additional color at the expense of a slightly increased assignment cross-talk when not discarding any events (∼20%). Thus, while hardly compromising the quality of the nanoscopic multicolor image (Fig. 3 b), this additional freedom allowed us to record a four-color image applying Alexa488, Alexa514, Rhodamine 3c, and Cy3 as markers for F-actin, peroxisomes, tubulin, and clathrin, respectively (Fig. 3 c). Note that, in this case, the fluorescence emission maxima of the markers were separated by 20 nm only.
Figure 3.
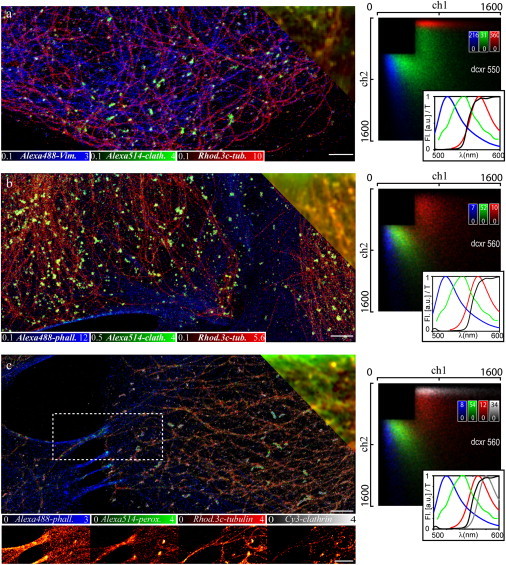
Multicolor GSDIM nanoscopy and conventional wide-field (upper right corner) images of different structures in fixed PtK2 cells. (a) Alexa488-labeled vimentin (blue), Alexa514-labeled clathrin (green), and Rhodamine 3c-labeled tubulin (red) recorded with a dichroic mirror centered at 550 nm. (b) Alexa488-labeled F-actin (blue), Alexa514-labeled clathrin (green), and Rhodamine 3c-labeled tubulin (red) recorded with a dichroic mirror centered at 560 nm. (c) Alexa488-labeled F-actin (blue), Alexa514-labeled peroxisomes (green), Rhodamine 3c-labeled tubulin (red), and Cy3-labeled clathrin (white). (Lower images) Contribution of each color for the section marked by the dotted white box. (Right panels) Corresponding two-dimensional photon pair histograms from control experiments on single-stained samples and (inset) fluorescence emission spectra (Fl) of the employed dyes (colors as in the images) and transmission characteristic (T) of the dichroic mirror (black). I = 10 kW/cm2, 90,000 (a and b) and 180,000 (c) camera frames, frame time 13 ms, scale bar 2 μm.
Comparing the histograms in Fig. 3, a and b, highlights the importance of choosing the right dichroic mirror for spectral separation. Its transmission characteristic determines the splitting ratios for the dyes and has thus a major impact on the quality of assignment in our experiments. To this extent, we investigated toward an optimized experimental setup, where either cross-talk is minimized or where the potential number of simultaneously recorded markers is maximized. Fig. 4 shows simulated two-dimensional photon histograms of the four dyes Alexa488, Alexa514, Rhodamine 3c, and Cy3 for different transmission curves of the dichroic mirror. The histograms were simulated by calculating the expected splitting ratio from the emission spectra (27). Broadened only by shot noise, the simulated histograms are considerably narrower than in the experimental gauge measurements. This is mainly due to inhomogeneous broadening in the experimental case, i.e., the fact that while each dye species has a characteristic average splitting ratio, its value may vary from molecule to molecule. Possible reasons for this fact are spectral shifts due to the heterogeneous cellular environment, solvent interaction, and—importantly—the fact that the transmission of the dichroic mirror depends on the polarization of the emitted fluorescence, and hence the orientation of the dye molecule. The resulting broadening is the main limiting factor when extending multicolor nanoscopy to >4–5 colors (27). It may be overcome by applying less environment-sensitive markers and by optimizing dichroic mirrors to eliminate the dependence of the splitting ratio on the dye orientation. At the same time, it is important to choose dichroic mirrors that are specifically designed to separate the distributions of the dyes used in an experiment. For example, using a dichroic mirror with a more flattened, ramplike transmission characteristic moves the distributions closer to the bisecting line, allowing for additional blue and red dyes. On the other hand, for our limited number of four dyes, the use of a dichroic with a perfect step in its transmission spectrum decreases cross-talk from ∼7% for the experimental dichroic mirror to <6% (Fig. 4).
Figure 4.

(a) Exemplary fluorescence emission spectra of four different dyes (1, Alexa488; 2, Alexa514; 3, Rhodamine 3c; and 4, Cy3) and different transmission curves of the dichroic mirror (black; Dichroic, dichroic mirror as employed in the experiments; Step, theoretical; and Ramp, theoretical) used to split the fluorescence light into the two detection channels. (b) Corresponding simulated two-dimensional photon pair distributions.
Our multicolor nanoscopy approach can also be applied to living cells. It has been shown that on-off blinking of conventional fluorescent markers in living cells may be facilitated by intrinsic dark states as for, for example, fluorescent proteins (12,35,43) or by reducing agents such as glutathione that are naturally present in the cellular cytoplasm (31). Fig. 5 shows nanoscopy images of different structures in living PtK2 cells, labeled either with the organic dye TMR via a SNAP tag (37,38) or with the fluorescent protein Citrine (39). Both the SNAP tag and the Citrine-fused proteins were expressed by the cell. The membrane-permeable, functionalized organic dye TMR binds specifically to the SNAP tag fusion protein. In this way, we could visualize structural details of the distribution of the microtubule-associated protein 2 (MAP2), the endoplasmatic reticulum (ER), or of Caveolin 1 (Cav1) and Caveolin 2 (Cav2) with nanometer spatial resolution. Again, we determined a localization accuracy of d ≈ 15 nm from the average number of photons nfl ≈ 650–700 detected per single emitter. In the case of Citrine-ER, the quality of the nanoscopic images is somehow poorer than those of the ER recorded previously with the photoswitchable protein rsCherryRev (44) or by STED nanoscopy with conventional organic dyes (45). The number of blinking events before irreversible photobleaching, i.e., the maximum number of on-off cycles, is likely to be lower for Citrine than for photoswitchable fluorescent proteins such as rsCherryRev, resulting in a reduced contrast of the reconstructed GSDIM image (12). The different emission characteristics of TMR and Citrine (Fig. 5, d and e) allowed multicolor nanoscopy imaging in living cells (Fig. 5 c). Other markers such as the membrane-permeable organic dye Oregon Green or the fluorescent protein mCherry (46) were equally well applicable in living cells and may complement our multicolor experiments.
Figure 5.
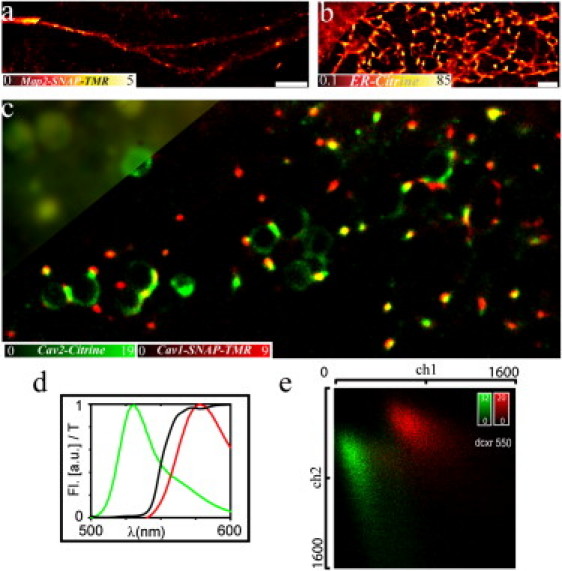
Multicolor live-cell GSDIM. Nanoscopic and conventional wide-field (upper left corner) images of different structures in living PtK2 cells. (a) Microtubule-associated protein 2 fused with a SNAP-tag and labeled with the organic dye TMR, (b) Citrine targeted to the endoplasmatic reticulum (ER), and (c) Caveolin 1 (red) and Caveolin 2 (green) labeled with TMR via SNAP tag and Citrine, respectively. (d) Fluorescence emission spectra (Fl) of TMR (red) and Citrine (green) and transmission characteristic (T) of the dichroic mirror. (e) Two-dimensional photon pair histogram from control experiments on single-stained samples of panels a and b. I = 2 kW/cm2, 1000 camera frames, frame time 10 ms, scale bar 2 μm.
Conclusions
We present multicolor far-field GSDIM nanoscopy based on depletion of the molecular fluorescent state followed by stochastic on- and off- transitions of single emitters. On-off blinking is based on transferring the fluorescent markers into a transient dark state and is realized with conventional and commercially available fluorescent markers, facilitating a flexible choice of bright and biocompatible fluorophores. This flexibility allowed us to record images of cellular structures with nanoscale resolution and to simultaneously separate up to four differently labeled features. Our approach only requires a single laser line and two detection channels on a single camera. The fluorescence maxima of the employed markers were separated by <20 nm. Modern tagging technologies such as SNAP tag and fluorescent protein fusion enabled simple access to live-cell multicolor nanoscopy.
The images featured cross-talk of generally <10%, which is sufficiently low for visualizing structures which are either spatially separated or have similar densities of detected markers (equaling brightness in the position histogram). In some applications, this is not readily achieved, and a certain marker species may be much more abundant than another. In such cases, the assignment strategy may be altered to avoid cross-talk from the bright channel to the darker channels to increase their precision at the cost of further reducing their dynamic range. This problem can be overcome by optimizing the wavelength separation of the fluorescence detection, the transmission spectrum of the dichroic mirror, or by reducing the inhomogeneous broadening of fluorescence emission in the cellular environment. At the same time these measures may well allow multicolor GSDIM nanoscopy with more than four colors.
A general problem of the stochastic single-molecule readout is that dynamic range is reduced because some switching events are missed, due to the necessary photon thresholding or the prebleaching of parts of the fluorescence ensemble until single-molecule signatures are detected. Specific engineering of the on- and off-rates of the markers can be used to optimize the density of switched-on markers and the brightness distribution of the events, thus increasing the part of switching events that contribute to the final image. For example, optimization of the dark state population has been realized by addition of certain reducing and oxidizing agents (31,32,47,48) or by additional laser light (12,49). We also note that colocalization investigations may be affected by a bias in orientation of the transition dipole of molecules that are not able to freely rotate in space.
Our wide-field approach lacks resolution by optical sectioning along the axial direction. Most events from outside the focal plane are neglected due to the photon threshold, thus limiting the depth of field and minimizing potential blurring from such contributions. We note, however, that multicolor GSDIM nanoscopy is readily extended to three-dimensional nanoscale imaging by using established techniques such as optical astigmatism (50), multiple-plane detection (51), a double-helix point spread function (52), or a 4Pi detection scheme (53,54). The depth of field remains limited in these approaches but can always be increased by sequentially recording different sample planes.
For the stochastic single-molecule readout, the observation of cellular dynamics tends to be limited due to somewhat longer acquisition time. However, with efficient analysis algorithms in hand (55,56), the observation of (slow) dynamics should be straightforward (57,58).
In summary, by significantly expanding its multicolor capabilities, the approach presented in this work should further improve the power and versatility of far-field fluorescence nanoscopy to characterize cellular substructures and their function.
Acknowledgments
We thank Dr. V. Belov for providing the fluorophore Rhodamine 3c and B. Hein for help with the SNAP construct. We also acknowledge S. Löbermann, R. Schmitz-Salue, and T. Gilat for excellent technical assistance.
This work has been supported by a Gottfried Wilhelm Leibniz research prize of the Deutsche Forschungsgemeinschaft to S.W.H.
Contributor Information
Stefan W. Hell, Email: shell@gwdg.de.
Christian Eggeling, Email: ceggeli@gwdg.de.
References
- 1.Abbe E. Contributions to the theory of the microscope and microscopic perception [Beiträge zur Theorie des Mikroskops und der mikroskopischen Wahrnehmung] Archiv für Mikroskopische Anatomie. 1873;9:413–468. [Google Scholar]
- 2.Hell S.W., Wichmann J. Breaking the diffraction resolution limit by stimulated emission: stimulated-emission-depletion fluorescence microscopy. Opt. Lett. 1994;19:780–782. doi: 10.1364/ol.19.000780. [DOI] [PubMed] [Google Scholar]
- 3.Hell S.W., Jakobs S., Kastrup L. Imaging and writing at the nanoscale with focused visible light through saturable optical transitions. Appl. Phys., A Mater. Sci. Process. 2003;77:859–860. [Google Scholar]
- 4.Hell S.W. Far-field optical nanoscopy. Science. 2007;316:1153–1158. doi: 10.1126/science.1137395. [DOI] [PubMed] [Google Scholar]
- 5.Hell S.W., Kroug M. Ground-state depletion fluorescence microscopy, a concept for breaking the diffraction resolution limit. Appl. Phys. B. 1995;60:495–497. [Google Scholar]
- 6.Bretschneider S., Eggeling C., Hell S.W. Breaking the diffraction barrier in fluorescence microscopy by optical shelving. Phys. Rev. Lett. 2007;98:218103. doi: 10.1103/PhysRevLett.98.218103. [DOI] [PubMed] [Google Scholar]
- 7.Hofmann M., Eggeling C., Hell S.W. Breaking the diffraction barrier in fluorescence microscopy at low light intensities by using reversibly photoswitchable proteins. Proc. Natl. Acad. Sci. USA. 2005;102:17565–17569. doi: 10.1073/pnas.0506010102. [DOI] [PMC free article] [PubMed] [Google Scholar]
- 8.Betzig E., Patterson G.H., Hess H.F. Imaging intracellular fluorescent proteins at nanometer resolution. Science. 2006;313:1642–1645. doi: 10.1126/science.1127344. [DOI] [PubMed] [Google Scholar]
- 9.Rust M.J., Bates M., Zhuang X.W. Sub-diffraction-limit imaging by stochastic optical reconstruction microscopy (STORM) Nat. Methods. 2006;3:793–795. doi: 10.1038/nmeth929. [DOI] [PMC free article] [PubMed] [Google Scholar]
- 10.Hess S.T., Girirajan T.P.K., Mason M.D. Ultra-high resolution imaging by fluorescence photoactivation localization microscopy. Biophys. J. 2006;91:4258–4272. doi: 10.1529/biophysj.106.091116. [DOI] [PMC free article] [PubMed] [Google Scholar]
- 11.Egner A., Geisler C., Hell S.W. Fluorescence nanoscopy in whole cells by asynchronous localization of photoswitching emitters. Biophys. J. 2007;93:3285–3290. doi: 10.1529/biophysj.107.112201. [DOI] [PMC free article] [PubMed] [Google Scholar]
- 12.Fölling J., Bossi M., Hell S.W. Fluorescence nanoscopy by ground-state depletion and single-molecule return. Nat. Methods. 2008;5:943–945. doi: 10.1038/nmeth.1257. [DOI] [PubMed] [Google Scholar]
- 13.Heilemann M., van de Linde S., Sauer M. Subdiffraction-resolution fluorescence imaging with conventional fluorescent probes. Angew. Chem. Int. Ed. Engl. 2008;47:6172–6176. doi: 10.1002/anie.200802376. [DOI] [PubMed] [Google Scholar]
- 14.Neher R., Neher E. Optimizing imaging parameters for the separation of multiple labels in a fluorescence image. J. Microsc. 2004;213:46–62. doi: 10.1111/j.1365-2818.2004.01262.x. [DOI] [PubMed] [Google Scholar]
- 15.Donnert G., Keller J., Hell S.W. Two-color far-field fluorescence nanoscopy. Biophys. J. 2007;92:L67–L69. doi: 10.1529/biophysj.107.104497. [DOI] [PMC free article] [PubMed] [Google Scholar]
- 16.Bock H., Geisler C., Eggeling C. Two-color far-field fluorescence nanoscopy based on photoswitchable emitters. Appl. Phys. B. 2007;88:161–165. [Google Scholar]
- 17.Bates M., Huang B., Zhuang X. Multicolor super-resolution imaging with photo-switchable fluorescent probes. Science. 2007;317:1749–1753. doi: 10.1126/science.1146598. [DOI] [PMC free article] [PubMed] [Google Scholar]
- 18.Jares-Erijman E.A., Jovin T.M. FRET imaging. Nat. Biotechnol. 2003;21:1387–1395. doi: 10.1038/nbt896. [DOI] [PubMed] [Google Scholar]
- 19.Schmidt M., Nagorni M., Hell S.W. Subresolution axial distance measurements in far-field fluorescence microscopy with precision of 1 nanometer. Rev. Sci. Instrum. 2000;71:2742–2745. [Google Scholar]
- 20.Esa A., Edelmann P., Cremer C. Three-dimensional spectral precision distance microscopy of chromatin nanostructures after triple-color DNA labeling: a study of the BCR region on chromosome 22 and the Philadelphia chromosome. J. Microsc. 2000;199:96–105. doi: 10.1046/j.1365-2818.2000.00707.x. [DOI] [PubMed] [Google Scholar]
- 21.Heilemann M., Herten D.P., Sauer M. High-resolution colocalization of single dye molecules by fluorescence lifetime imaging microscopy. Anal. Chem. 2002;74:3511–3517. doi: 10.1021/ac025576g. [DOI] [PubMed] [Google Scholar]
- 22.Gordon M.P., Ha T., Selvin P.R. Single-molecule high-resolution imaging with photobleaching. Proc. Natl. Acad. Sci. USA. 2004;101:6462–6465. doi: 10.1073/pnas.0401638101. [DOI] [PMC free article] [PubMed] [Google Scholar]
- 23.Meyer L., Wildanger D., Hell S.W. Dual-color STED microscopy at 30-nm focal-plane resolution. Small. 2008;4:1095–1100. doi: 10.1002/smll.200800055. [DOI] [PubMed] [Google Scholar]
- 24.Schmidt R., Wurm C.A., Hell S.W. Spherical nanosized focal spot unravels the interior of cells. Nat. Methods. 2008;5:539–544. doi: 10.1038/nmeth.1214. [DOI] [PubMed] [Google Scholar]
- 25.Shroff H., Galbraith C.G., Betzig E. Dual-color superresolution imaging of genetically expressed probes within individual adhesion complexes. Proc. Natl. Acad. Sci. USA. 2007;104:20308–20313. doi: 10.1073/pnas.0710517105. [DOI] [PMC free article] [PubMed] [Google Scholar]
- 26.Schönle A., Hell S.W. Fluorescence nanoscopy goes multicolor. Nat. Biotechnol. 2007;25:1234–1235. doi: 10.1038/nbt1107-1234. [DOI] [PubMed] [Google Scholar]
- 27.Bossi M., Fölling J., Hell S.W. Multicolor far-field fluorescence nanoscopy through isolated detection of distinct molecular species. Nano Lett. 2008;8:2463–2468. doi: 10.1021/nl801471d. [DOI] [PubMed] [Google Scholar]
- 28.Testa I., Schönle A., Egner A. Nanoscale separation of molecular species based on their rotational mobility. Opt. Express. 2008;16:21093–21104. doi: 10.1364/oe.16.021093. [DOI] [PubMed] [Google Scholar]
- 29.Andresen M., Stiel A.C., Jakobs S. Photoswitchable fluorescent proteins enable monochromatic multilabel imaging and dual color fluorescence nanoscopy. Nat. Biotechnol. 2008;26:1035–1040. doi: 10.1038/nbt.1493. [DOI] [PubMed] [Google Scholar]
- 30.Hell, S. W. 2006. German Patent No. DE102006021317B3.
- 31.Heilemann M., van de Linde S., Sauer M. Super-resolution imaging with small organic fluorophores. Angew. Chem. Int. Ed. Engl. 2009;48:6903–6908. doi: 10.1002/anie.200902073. [DOI] [PubMed] [Google Scholar]
- 32.Steinhauer C., Forthmann C., Tinnefeld P. Superresolution microscopy on the basis of engineered dark states. J. Am. Chem. Soc. 2008;130:16840–16841. doi: 10.1021/ja806590m. [DOI] [PubMed] [Google Scholar]
- 33.Flors C., Ravarani C.N., Dryden D.T.F. Super-resolution imaging of DNA labeled with intercalating dyes. ChemPhysChem. 2009;10:2201–2204. doi: 10.1002/cphc.200900384. [DOI] [PubMed] [Google Scholar]
- 34.Lemmer P., Gunkel M., Cremer C. Using conventional fluorescent markers for far-field fluorescence localization nanoscopy allows resolution in the 10-nm range. J. Microsc. 2009;235:163–171. doi: 10.1111/j.1365-2818.2009.03196.x. [DOI] [PubMed] [Google Scholar]
- 35.Biteen J.S., Thompson M.A., Moerner W.E. Super-resolution imaging in live Caulobacter crescentus cells using photoswitchable EYFP. Nat. Methods. 2008;5:947–949. doi: 10.1038/NMETH.1258. [DOI] [PMC free article] [PubMed] [Google Scholar]
- 36.Boyarskiy V.P., Belov V.N., Hell S.W. Photostable, amino reactive and water-soluble fluorescent labels based on sulfonated rhodamine with a rigidized xanthene fragment. Chemistry. 2008;14:1784–1792. doi: 10.1002/chem.200701058. [DOI] [PubMed] [Google Scholar]
- 37.Keppler A., Gendreizig S., Johnsson K. A general method for the covalent labeling of fusion proteins with small molecules in vivo. Nat. Biotechnol. 2003;21:86–89. doi: 10.1038/nbt765. [DOI] [PubMed] [Google Scholar]
- 38.Hein B., Willig K.I., Hell S.W. Stimulated emission depletion nanoscopy of living cells using SNAP-tag fusion proteins. Biophys. J. 2010;98:158–163. doi: 10.1016/j.bpj.2009.09.053. [DOI] [PMC free article] [PubMed] [Google Scholar]
- 39.Griesbeck O., Baird G.S., Tsien R.Y. Reducing the environmental sensitivity of yellow fluorescent protein. Mechanism and applications. J. Biol. Chem. 2001;276:29188–29194. doi: 10.1074/jbc.M102815200. [DOI] [PubMed] [Google Scholar]
- 40.Geisler C., Schoenle A., Hell S.W. Resolution of l/10 in fluorescence microscopy using fast single molecule photo-switching. Appl. Phys., A Mater. Sci. Process. 2007;88:223–226. [Google Scholar]
- 41.Zondervan R., Kulzer F., Orrit M. Photoblinking of rhodamine 6G in poly(vinyl alcohol): radical dark state formed through the triplet. J. Phys. Chem. A. 2003;107:6770–6776. [Google Scholar]
- 42.Donnert G., Eggeling C., Hell S.W. Major signal increase in fluorescence microscopy through dark-state relaxation. Nat. Methods. 2007;4:81–86. doi: 10.1038/nmeth986. [DOI] [PubMed] [Google Scholar]
- 43.Dickson R.M., Cubitt A.B., Moerner W.E. On/off blinking and switching behavior of single molecules of green fluorescent protein. Nature. 1997;388:355–358. doi: 10.1038/41048. [DOI] [PubMed] [Google Scholar]
- 44.Stiel A.C., Andresen M., Jakobs S. Generation of monomeric reversibly switchable red fluorescent proteins for far-field fluorescence nanoscopy. Biophys. J. 2008;95:2989–2997. doi: 10.1529/biophysj.108.130146. [DOI] [PMC free article] [PubMed] [Google Scholar]
- 45.Hein B., Willig K.I., Hell S.W. Stimulated emission depletion (STED) nanoscopy of a fluorescent protein-labeled organelle inside a living cell. Proc. Natl. Acad. Sci. USA. 2008;105:14271–14276. doi: 10.1073/pnas.0807705105. [DOI] [PMC free article] [PubMed] [Google Scholar]
- 46.Shaner N.C., Campbell R.E., Tsien R.Y. Improved monomeric red, orange and yellow fluorescent proteins derived from Discosoma sp. red fluorescent protein. Nat. Biotechnol. 2004;22:1567–1572. doi: 10.1038/nbt1037. [DOI] [PubMed] [Google Scholar]
- 47.Vogelsang J., Kasper R., Tinnefeld P. A reducing and oxidizing system minimizes photobleaching and blinking of fluorescent dyes. Angew. Chem. Int. Ed. Engl. 2008;47:5465–5469. doi: 10.1002/anie.200801518. [DOI] [PubMed] [Google Scholar]
- 48.Vogelsang J., Cordes T., Tinnefeld P. Controlling the fluorescence of ordinary oxazine dyes for single-molecule switching and superresolution microscopy. Proc. Natl. Acad. Sci. USA. 2009;106:8107–8112. doi: 10.1073/pnas.0811875106. [DOI] [PMC free article] [PubMed] [Google Scholar]
- 49.Ringemann C., Schönle A., Eggeling C. Enhancing fluorescence brightness: effect of reverse intersystem crossing studied by fluorescence fluctuation spectroscopy. ChemPhysChem. 2008;9:612–624. doi: 10.1002/cphc.200700596. [DOI] [PubMed] [Google Scholar]
- 50.Huang B., Wang W.Q., Zhuang X. Three-dimensional super-resolution imaging by stochastic optical reconstruction microscopy. Science. 2008;319:810–813. doi: 10.1126/science.1153529. [DOI] [PMC free article] [PubMed] [Google Scholar]
- 51.Juette M.F., Gould T.J., Bewersdorf J. Three-dimensional sub-100 nm resolution fluorescence microscopy of thick samples. Nat. Methods. 2008;5:527–529. doi: 10.1038/nmeth.1211. [DOI] [PubMed] [Google Scholar]
- 52.Pavani S.R.P., Thompson M.A., Moerner W.E. Three-dimensional, single-molecule fluorescence imaging beyond the diffraction limit by using a double-helix point spread function. Proc. Natl. Acad. Sci. USA. 2009;106:2995–2999. doi: 10.1073/pnas.0900245106. [DOI] [PMC free article] [PubMed] [Google Scholar]
- 53.von Middendorff C., Egner A., Schönle A. Isotropic 3D nanoscopy based on single emitter switching. Opt. Express. 2008;16:20774–20788. doi: 10.1364/oe.16.020774. [DOI] [PubMed] [Google Scholar]
- 54.Shtengel G., Galbraith J.A., Hess H.F. Interferometric fluorescent super-resolution microscopy resolves 3D cellular ultrastructure. Proc. Natl. Acad. Sci. USA. 2009;106:3125–3130. doi: 10.1073/pnas.0813131106. [DOI] [PMC free article] [PubMed] [Google Scholar]
- 55.Hedde P.N., Fuchs J., Nienhaus G.U. Online image analysis software for photoactivation localization microscopy. Nat. Methods. 2009;6:689–690. doi: 10.1038/nmeth1009-689. [DOI] [PubMed] [Google Scholar]
- 56.Wolter S., Schüttpelz M., Sauer M. Real-time computation of subdiffraction-resolution fluorescence images. J. Microsc. 2010;237:12–22. doi: 10.1111/j.1365-2818.2009.03287.x. [DOI] [PubMed] [Google Scholar]
- 57.Hess S.T., Gould T.J., Zimmerberg J. Dynamic clustered distribution of hemagglutinin resolved at 40 nm in living cell membranes discriminates between raft theories. Proc. Natl. Acad. Sci. USA. 2007;104:17370–17375. doi: 10.1073/pnas.0708066104. [DOI] [PMC free article] [PubMed] [Google Scholar]
- 58.Endesfelder U., van de Linde S., Heilemann M. Subdiffraction-resolution fluorescence microscopy of myosin-actin motility. ChemPhysChem. 2010;11:836–840. doi: 10.1002/cphc.200900944. [DOI] [PubMed] [Google Scholar]