Abstract
Background/Aims
This study evaluated the relationship between hyperuricemia and nonalcoholic fatty liver disease (NAFLD) by comparing the incidence rates of NAFLD in relation to serum uric acid levels in apparently healthy subjects during a 5-year period.
Methods
Among 15,638 healthy Korean subjects who participated in a health-screening program in 2003 and 2008, respectively, 4954 subjects without other risk factors were enrolled in this study. We compared the incidence rates of NAFLD in 2008 with respect to baseline uric acid levels.
Results
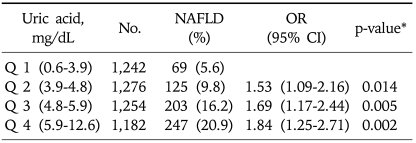
In 2003, serum uric acid levels were categorized into the following quartiles: 0.6-3.9, 3.9-4.8, 4.8-5.9, and 5.9-12.6 mg/dL. The incidence of NAFLD in 2008 increased with the level of baseline uric acid (5.6%, 9.8%, 16.2%, and 20.9%, respectively; p<0.05). Multiple logistic regression analysis demonstrated that hyperuricemia was associated with the development of NAFLD. When compared to the subjects in quartile 1, the odds ratio (OR) for the incidence of NAFLD for quartiles 2, 3, and 4 were 1.53 (95% confidence interval [CI], 1.09-2.16; p=0.014], 1.69 (95% CI, 1.17-2.44; p=0.005), and 1.84 (95% CI, 1.25-2.71; p=0.002), respectively.
Conclusions
High serum uric acid levels appear to be associated with an increased risk of the development of NAFLD.
Keywords: Non-alcoholic fatty liver disease, Uric acid, Metabolic syndrome
INTRODUCTION
Non-alcoholic fatty liver disease (NAFLD) is a state of intrahepatic fat accumulation, not due to excessive alcohol intake, which can cause cirrhosis and is contributing to an increasing mortality related to the rising prevalence of obesity and diabetes. The prevalence of NAFLD is known to be 20-30% among the Western population and it shows an increasing trend recently.1 The prevalence is increas among obese or diabetic patients and has been reported to be as high as 70-90%.2,3
NAFLD is now considered a part of the metabolic syndrome, a clustering of cardiovascular disease risk factors closely associated with insulin resistance and many endocrine derangements including glucose homeostasis and central obesitiy.4-7 It has been reported that hyperuricemia is related to insulin resistance and associated conditions,8-10 but its relationship with NAFLD is not well known. One recent study suggested that hyperuricemia was significantly associated with NAFLD, but the limitation of its cross-sectional study design did not permit a conclusive evaluation for its causal relationship.11 The mechanism which is involved in the association of NAFLD and hyperuricemia was also uncertain. Insulin resistance and hyperuricemia occur frequently in patients with NAFLD. So Insulin resistance and prooxidant or antioxidant character of uric acid was suspected to be the one of causes of NAFLD.12-15
Therefore, we planned a retrospective cohort study to evaluate the temporal relationship between hyperuricemia and the development of NAFLD. We have examined the relationship between incidence rates of NAFLD after 5 years with baseline serum uric acid concentrations.
MATERIALS AND METHODS
1. Populations
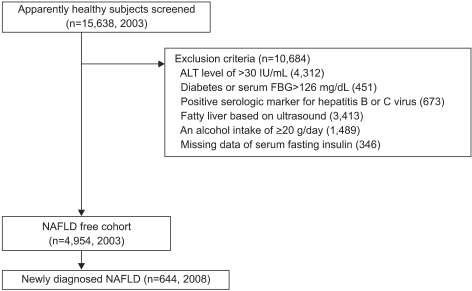
A total of 15,638 individuals underwent health screening at Kangbuk Samsung Hospital, Sungkyunkwan University School of Medicine, Seoul, Korea in 2003 and 2008. The participants generally underwent health status examination every 1 or 2 years as company employee himself or his spouse. In Korea, employees are required to participate in annual or biennial health screenings by the Industrial Safety and Health Law. Among these, 10,684 subjects were excluded due to the following reasons; 4,312 subjects had elevated alanine aminotransferase (ALT) above 30 IU/mL, 451 subjects had a fasting blood glucose above 126 mg/dL or a history of diabetes mellitus, 673 subjects had positive serologic marker for hepatitis B or C virus, 3,413 subjects had a ultrasonographic findings of fatty liver, 1,489 subjects had an daily alcohol intake of 20 g/day more, 346 subjects had missing laboratory data. Subjects who were taking hypouricemic, antihypertensive, antidiabetic and lipid lowering medication were not included in the study (Fig. 1).
Fig. 1.
Subject flow diagram. A total of 15,638 subjects underwent health screening in 2003 and 2008, of which 10,684 were excluded due to following reasons: elevated alanine aminotransferase and fasting serum glucose levels, history of diabetes mellitus and positive serologic marker for hepatitis B or C, ultrasonographic findings of fatty liver, a daily alcohol intake of 20 g or more, or loss of laboratory data. Consequently, 4,954 subjects were observed for incident NAFLD after 5 years. Subjects who were taking hypouricemic, antihypertensive, antidiabetic, and lipid-lowering medication were excluded from the study population.
NAFLD, nonalcoholic fatty liver disease; FBG, fasting blood glucose.
Consequently, a total of 4,954 (2,502 males, 2,452 females) who were free of liver disease in 2003 comprised the cohort for this study and this population was observed for the development of NAFLD after 5 years.
This study was approved by the Institutional Review Board at Kangbuk Samsung Hospital.
2. Questionnaire
The questionnaire for the initial health examinations in 2003 included a medical history, physical examination, questionnaire on health-related behavior. The medical history, alcohol intake and drug use were assessed by physicians. All participants were asked to fill out a questionnaire on health-related behavior including alcohol intake, smoking status and physical activities. The questions on alcohol intake included the frequency of alcohol consumption per week and the usual amount that was consumed. The participants were asked about their weekly frequency of physical activity such as jogging, bicycling, and swimming. Their educational background was also asked in the questionnaire.
3. Blood sampling
After a 12 hour of fasting, a venous blood sample was obtained from each subject for measurement of serum uric acid, fasting blood glucose, total cholesterol, serum triglyceride, and high- and low-density lipoprotein cholesterol (HDL-C, LDL-C) concentrations using an automatic analyzer (Advia 1650; Bayer, Fernwald, Germany). The serum uric acid concentrations was measured using the Uricase EMST method, and fasting blood glucose was measured by the hexokinase method (Hitachi 747 automatic analyzer; Hitachi, Tokyo, Japan). The fasting insulin concentration was measured using an immunoradiometric assay (Biosource, Fleurus, Belgium; intra- and inter-assay coefficient of 2.1-4.5% and 4.7-12.2%, respectively).
4. Ultrasonography
The diagnosis of NAFLD was based on the findings of abdominal US with a 3.5-MHz transducer (Logic Q700 MR; GE, Milwaukee, WI, USA). The ultrasonography was carried out by 3 experienced radiologists who were blinded to the intention of this study. They were also blinded to the laboratory values of the examinees. Of the 4 known criteria (hepatorenal echo contrast, liver brightness, deep attenuation, and vascular blurring), it was required to have hepatorenal contrast and liver brightness to be diagnosed with fatty liver. Vascular blurring (hepatic vein blurring) and deep attenuation (attenuations of the echo level in the deep region of the liver) were also present in many cases, but their absence did not exclude the diagnosis of fatty liver.16
5. Statistical analysis
Statistical analysis was performed with SPSS version 16.0 (SPSS Inc., Chicago, IL, USA). The chi-square test was used to compare categorical variables between groups. For continuous variables, parameters that followed normal distribution were analyzed with t-test or ANOVA and described as mean±SD.
To assess the relationship between serum uric acid level and the development of NAFLD, the study population was divided into four quartiles based on their serum uric acid level at baseline. The group values were compared by one-way ANOVA, and odds ratios (OR) were determined by ANOVA test and chi-square test. Multiple logistic regression analysis was done to evaluate the risk for newly developed NAFLD. p<0.05 was considered as statistically significant.
RESULTS
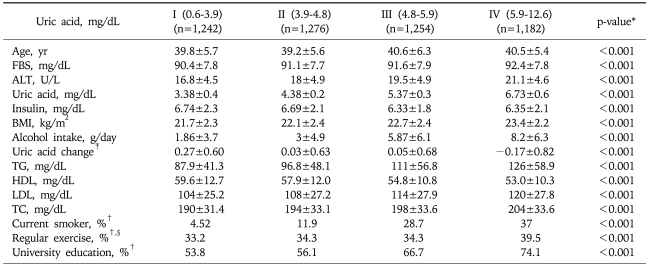
A total of 4,954 (2,502 males, 2,452 females) subjects among the total of 15,638 examinees, comprised the study cohort with the average age of 40.0±5.9 years. The cohort was divided into four quartiles on the baseline (2003) serum uric acid levels. The baseline characteristics are shown in Table 1. The ranges of serum uric acid levels for each quartile and its number of subjects are as follows; quartile 1, 0.6-3.9 mg/dL (n=1,242); quartile 2, 3.9-4.8 mg/dL (n=1,276), quartile 3, 4.8-5.9 mg/dL (n=1,254), and quartile 4, 5.9-12.6 mg/dL (n=1,182). The group with higher serum concentrations of uric acid showed significantly higher serum concentrations of: glucose, ALT, triglyceride, total cholesterol and LDL-C; as well as body mass index (BMI) and alcohol intake when compared to those with lower serum uric acid levels. However, the level of HDL-C showed an inverse relationship with serum uric acid concentration.
Table 1.
Baseline Characteristics of Study Subjects according to the Quartiles of Serum Uric Acid Level
Data are expressed as mean±SD when appropriate (95% CI).
FBS, fasting blood sugar; TC, total cholesterol; BMI, body mass index.
*Continous variables were analyzed by unpaired t-test; †Ratios of each group; ‡Uric acid change: difference between 2003 and 2008 uric acid level (2003-2008); §Regular exercise: more than 3 times exercise a week.
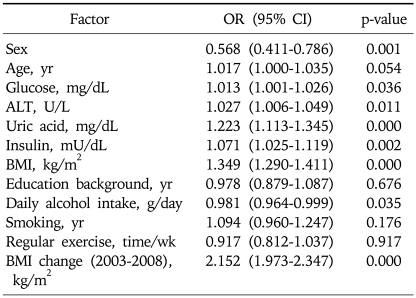
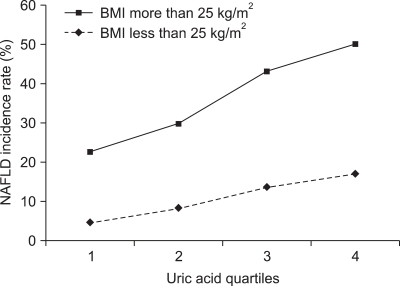
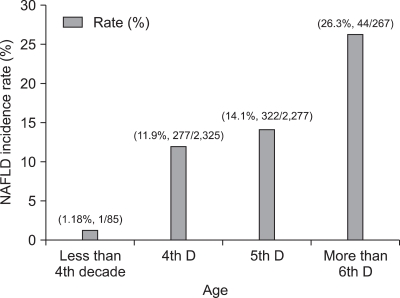
Multiple logistic regression analysis showed that sex, fasting glucose, ALT, fasting insulin, BMI, daily alcohol intake, and BMI change were associated with NAFLD significantly in addition to uric acid (Table 2). Table 3 shows a positive relationship between the baseline serum uric acid concentration and the incidence of NAFLD. The highest baseline serum uric acid quartile was associated with the highest incidence rate of NAFLD in 2008: 20.9%. This relationship was especially more apparent among the obese population as shown in Fig. 2. The positive relationship between the incidence of NAFLD and the level of serum uric acid was also significant in both genders (data are not shown in the paper). In 2008, we observed 644 cases of newly developed NAFLD with the overall incidence of 13% (644/4,954). The incidence rate peaked in more than 6th decade of age (26.3%, 44/267) (Fig. 3).
Table 2.
Multivariate Relationship between Baseline Risk Factors and the Incidence of NAFLD
NAFLD, non alcoholic fatty liver disease; OR, odds ratio; CI, confidence interval; BMI, body mass index.
Table 3.
NAFLD Incidence Rate after 5 Years and Multivariate Analysis for the Incidence of NAFLD in Relation to the Serum Uric Acid Level
Date are adjusted for age, sex, fasting glucose, ALT, fasting insulin, BMI, daily alcohol intake, smoking, regular exercise, educational background and BMI change (between 2003 and 2008).
NAFLD, non alcoholic fatty liver disease; OR, odds ratio; CI, confidence interval.
*Chi-square test.
Fig. 2.
Comparison of percentage incidences of NAFLD between the normal and obese groups according to quartiles of uric acid levels. The highest baseline serum uric acid quartile was associated with the highest incidence of NAFLD in 2008: 20.9%. This relationship was particularly apparent among the obese population (BMI>25 kg/m2).
NAFLD, nonalcoholic fatty liver disease; BMI, body mass index.
Fig. 3.
Incidence of nonalcoholic fatty liver disease (NAFLD) according to age during the 5-year period. The incidence of NAFLD peaked in patients older than 69 years.
Multivariate analysis for incident NAFLD also showed that the positive relationship between the level of serum uric acid and the development of NAFLD still remained even after adjustment for age, sex, fasting glucose, ALT, fasting insulin, BMI, daily alcohol intake, smoking, regular exercise and educational background. The risk of the development of NAFLD increased with the rise of baseline serum uric acid concentration. The OR with the reference to quartile 1 (lowest level of serum uric acid) were 1.53 (95% confidence interval [CI], 1.09-2.16; p=0.014), 1.69 (95% CI, 1.17-2.44; p=0.005), and 1.84 (95% CI, 1.25-2.71; p=0.002) for the quartile 2, 3, and 4 (Table 3).
DISCUSSION
This study showed a temporal relationship between hyperuricemia and the development of NAFLD. The group with higher serum uric acid concentration at baseline showed higher incidence rate of NAFLD after 5 years, and this relationship was more apparent in the obese group with a BMI≥25 kg/m2. Multivariate analysis showed that the high baseline serum uric acid concentration was independently related to the development of NAFLD.
Hyperuricemia is known to be related with the components of metabolic syndrome; including obesity, hyperlipidemia and diabetes.8,17-19 Although steatosis alone is thought to be a benign condition, the development of nonalcoholic steatohepatitis (NASH) can lead to liver cirrhosis or hepatoma. Therefore it is important to diagnose NAFLD early in its development. We have attempted to delineate the relationship between serum uric acid levels and NAFLD, as a possible marker of the development of NAFLD.
Uric acid is known to remove free radicals in a body and acts as an antioxidant in cardiovascular system.20,21 One study reported that the injection of uric acid to ob/ob mice, an animal model for obesity, resulted in an almost complete cure of fatty liver, which suggested that increased concentration in serum uric acid inhibited oxidation process which might be related to the pathogenesis of NAFLD.22 However, other study reported that high level of serum uric acid accompanied by metabolic syndrome causing strong oxidation reaction, leading into atherosclerosis.23 These study results imply that uric acid can act as either antioxidant or prooxidant depending on its circumstances, especially on the availability of lipid hydroperoxides.12,15 In our study, we observed a higher incidence of NAFLD in obese group (Fig. 2), which can suggest that the role of uric acid as either antioxidant or prooxidant depends on the presence of metabolic components which related to the development of NAFLD. The insulin resistance is also known as one of the risk factors for NAFLD.13,14 The close relationship between insulin resistance and hyperuricemia18,24 suggests that hyperuricemia can contribute to the development of NAFLD via insulin resistance.25
One of the strengths of this study is its cohort design which allowed evaluating a temporal relationship between the level of serum uric acid and the development of NAFLD. This study results can provide an evidence that hyperuricemia can be a predictive factor for NAFLD.
However, this study was not without limitations. Firstly, the diagnosis of NAFLD was not a histologically confirmed one but solely made by ultrasonography with an alleged sensitivity of 67-89% and specificity of 77-89%26,27 Secondly, the amount of alcohol intake and exercise was measured by a questionnaire so that it is likely that this method introduced a measurement bias. Thirdly, most of the subjects were 40-60 years old (92.89%). Whether the findings observed from these subjects also hold true for the general population remains uncertain.
In conclusion, this study showed the role of hyperuricemia as a predictive and risk factor for the development of NAFLD, which was independent of various factors which could affect the insulin resistance.
References
- 1.Neuschwander-Tetri BA, Caldwell SH. Nonalcoholic steatohepatitis: summary of an AASLD Single Topic Conference. Hepatology. 2003;37:1202–1219. doi: 10.1053/jhep.2003.50193. [DOI] [PubMed] [Google Scholar]
- 2.Adams LA, Angulo P. Recent concepts in non-alcoholic fatty liver disease. Diabet Med. 2005;22:1129–1133. doi: 10.1111/j.1464-5491.2005.01748.x. [DOI] [PubMed] [Google Scholar]
- 3.McCullough AJ. The clinical features, diagnosis and natural history of nonalcoholic fatty liver disease. Clin Liver Dis. 2004;8:521–533. doi: 10.1016/j.cld.2004.04.004. viii. [DOI] [PubMed] [Google Scholar]
- 4.Hamaguchi M, Kojima T, Takeda N, et al. The metabolic syndrome as a predictor of nonalcoholic fatty liver disease. Ann Intern Med. 2005;143:722–728. doi: 10.7326/0003-4819-143-10-200511150-00009. [DOI] [PubMed] [Google Scholar]
- 5.Sung KC, Ryan MC, Kim BS, Cho YK, Kim BI, Reaven GM. Relationships between estimates of adiposity, insulin resistance, and nonalcoholic fatty liver disease in a large group of nondiabetic Korean adults. Diabetes Care. 2007;30:2113–2118. doi: 10.2337/dc07-0512. [DOI] [PubMed] [Google Scholar]
- 6.Sung KC, Ryan MC, Wilson AM. The severity of nonalcoholic fatty liver disease is associated with increased cardiovascular risk in a large cohort of non-obese Asian subjects. Atherosclerosis. 2009;203:581–586. doi: 10.1016/j.atherosclerosis.2008.07.024. [DOI] [PubMed] [Google Scholar]
- 7.Lonardo A, Carani C, Carulli N, Loria P. Endocrine NAFLD' a hormonocentric perspective of nonalcoholic fatty liver disease pathogenesis. J Hepatol. 2006;44:1196–1207. doi: 10.1016/j.jhep.2006.03.005. [DOI] [PubMed] [Google Scholar]
- 8.Yoo TW, Sung KC, Shin HS, et al. Relationship between serum uric acid concentration and insulin resistance and metabolic syndrome. Circ J. 2005;69:928–933. doi: 10.1253/circj.69.928. [DOI] [PubMed] [Google Scholar]
- 9.Conen D, Wietlisbach V, Bovet P, et al. Prevalence of hyperuricemia and relation of serum uric acid with cardiovascular risk factors in a developing country. BMC Public Health. 2004;4:9. doi: 10.1186/1471-2458-4-9. [DOI] [PMC free article] [PubMed] [Google Scholar]
- 10.Jossa F, Farinaro E, Panico S, et al. Serum uric acid and hypertension: the Olivetti Heart Study. J Hum Hypertens. 1994;8:677–681. [PubMed] [Google Scholar]
- 11.Li Y, Xu C, Yu C, Xu L, Miao M. Association of serum uric acid level with non-alcoholic fatty liver disease: a cross-sectional study. J Hepatol. 2009;50:1029–1034. doi: 10.1016/j.jhep.2008.11.021. [DOI] [PubMed] [Google Scholar]
- 12.Abuja PM. Ascorbate prevents prooxidant effects of urate in oxidation of human low density lipoprotein. FEBS Lett. 1999;446:305–308. doi: 10.1016/s0014-5793(99)00231-8. [DOI] [PubMed] [Google Scholar]
- 13.Chitturi S, Abeygunasekera S, Farrell GC, et al. NASH and insulin resistance: insulin hypersecretion and specific association with the insulin resistance syndrome. Hepatology. 2002;35:373–379. doi: 10.1053/jhep.2002.30692. [DOI] [PubMed] [Google Scholar]
- 14.Pagano G, Pacini G, Musso G, et al. Nonalcoholic steatohepatitis, insulin resistance, and metabolic syndrome: further evidence for an etiologic association. Hepatology. 2002;35:367–372. doi: 10.1053/jhep.2002.30690. [DOI] [PubMed] [Google Scholar]
- 15.Patterson RA, Horsley ET, Leake DS, et al. Prooxidant and antioxidant properties of human serum ultrafiltrates toward LDL: important role of uric acid. J Lipid Res. 2003;44:512–521. doi: 10.1194/jlr.M200407-JLR200. [DOI] [PubMed] [Google Scholar]
- 16.Kojima S, Watanabe N, Numata M, Ogawa T, Matsuzaki S. Increase in the prevalence of fatty liver in Japan over the past 12 years: analysis of clinical background. J Gastroenterol. 2003;38:954–961. doi: 10.1007/s00535-003-1178-8. [DOI] [PubMed] [Google Scholar]
- 17.Cigolini M, Targher G, Tonoli M, Manara F, Muggeo M, De Sandre G. Hyperuricaemia: relationships to body fat distribution and other components of the insulin resistance syndrome in 38-year-old healthy men and women. Int J Obes Relat Metab Disord. 1995;19:92–96. [PubMed] [Google Scholar]
- 18.Vuorinen-Markkola H, Yki-Järvinen H. Hyperuricemia and insulin resistance. J Clin Endocrinol Metab. 1994;78:25–29. doi: 10.1210/jcem.78.1.8288709. [DOI] [PubMed] [Google Scholar]
- 19.Zavaroni I, Mazza S, Fantuzzi M, et al. Changes in insulin and lipid metabolism in males with asymptomatic hyperuricaemia. J Intern Med. 1993;234:25–30. doi: 10.1111/j.1365-2796.1993.tb00700.x. [DOI] [PubMed] [Google Scholar]
- 20.Waring WS, Webb DJ, Maxwell SR. Systemic uric acid administration increases serum antioxidant capacity in healthy volunteers. J Cardiovasc Pharmacol. 2001;38:365–371. doi: 10.1097/00005344-200109000-00005. [DOI] [PubMed] [Google Scholar]
- 21.Waring WS, Convery A, Mishra V, Shenkin A, Webb DJ, Maxwell SR. Uric acid reduces exercise-induced oxidative stress in healthy adults. Clin Sci (Lond) 2003;105:425–430. doi: 10.1042/CS20030149. [DOI] [PubMed] [Google Scholar]
- 22.García-Ruiz I, Rodríguez-Juan C, Díaz-Sanjuan T, et al. Uric acid and anti-TNF antibody improve mitochondrial dysfunction in ob/ob mice. Hepatology. 2006;44:581–591. doi: 10.1002/hep.21313. [DOI] [PubMed] [Google Scholar]
- 23.Hayden MR, Tyagi SC. Uric acid: a new look at an old risk marker for cardiovascular disease, metabolic syndrome, and type 2 diabetes mellitus: the urate redox shuttle. Nutr Metab (Lond) 2004;1:10. doi: 10.1186/1743-7075-1-10. [DOI] [PMC free article] [PubMed] [Google Scholar]
- 24.Reaven GM. Banting lecture 1988. Role of insulin resistance in human disease. Diabetes. 1988;37:1595–1607. doi: 10.2337/diab.37.12.1595. [DOI] [PubMed] [Google Scholar]
- 25.Modan M, Halkin H, Karasik A, Lusky A. Elevated serum uric acid--a facet of hyperinsulinaemia. Diabetologia. 1987;30:713–718. doi: 10.1007/BF00296994. [DOI] [PubMed] [Google Scholar]
- 26.Joy D, Thava VR, Scott BB. Diagnosis of fatty liver disease: is biopsy necessary? Eur J Gastroenterol Hepatol. 2003;15:539–543. doi: 10.1097/01.meg.0000059112.41030.2e. [DOI] [PubMed] [Google Scholar]
- 27.Saadeh S, Younossi ZM, Remer EM, et al. The utility of radiological imaging in nonalcoholic fatty liver disease. Gastroenterology. 2002;123:745–750. doi: 10.1053/gast.2002.35354. [DOI] [PubMed] [Google Scholar]


