

Abstract
The effects of the dietary antioxidant N-acetylcysteine (NAC) on alcoholic liver damage were examined in a total enteral nutrition (TEN) model of ethanol toxicity in which liver pathology occurs in the absence of endotoxemia. Ethanol treatment resulted in steatosis, inflammatory infiltrates, occasional foci of necrosis, and elevated ALT in the absence of increased expression of the endotoxin receptor CD14, a marker of Kupffer cell activation by LPS. In addition, ethanol treatment induced CYP2E1 and increased TNFα and TGFβ mRNA expression accompanied by suppressed hepatic IL-4 mRNA expression. Ethanol treatment also resulted in the hepatic accumulation of malondialdehyde (MDA) and hydroxynonenal (HNE) protein adducts, decreased antioxidant capacity, and increased antibody titers toward serum hydroxyethyl radical (HER), MDA, and HNE adducts. NAC treatment increased cytosolic antioxidant capacity, abolished ethanol-induced lipid peroxidation, and inhibited the formation of antibodies toward HNE and HER adducts without interfering with CYP2E1 induction. NAC also decreased ethanol-induced ALT release and inflammation and prevented significant loss of hepatic GSH content. However, the improvement in necrosis score and reduction of TNFα mRNA elevation did not reach statistical significance. Although a direct correlation was observed among hepatic MDA and HNE adduct content and TNFα mRNA expression, inflammation, and necrosis scores, no correlation was observed between oxidative stress markers or TNFα and steatosis score. These data suggest that ethanol-induced oxidative stress can contribute to inflammation and liver injury even in the absence of Kupffer cell activation by endotoxemia.
Keywords: N-Acetylcysteine, Adducts, Cytokines, Alcohol, Hepatotoxicity, Lipid peroxidation
Introduction
In the recent years a growing body of experimental evidence indicates that inflammatory reactions and oxidative stress play a major role in alcohol hepatotoxicity [1-4]. Nonetheless the relative contributions of these factors in the processes leading to alcohol-induced liver damage (ALD) remain in dispute. One reason is that the various rodent models of ALD differ significantly with regard to animal age, nutritional status, growth rate, and the development of endotoxemia preceding pathological alterations [1,4-7]. Increased lipid peroxidation, impaired antioxidant status, the appearance of free radical adducts derived from fatty acid breakdown and CYP2E1-dependent ethanol metabolism to the 1-hydroxyethyl radical have all been shown to correlate with the development of pathology [3,8-10]. Antioxidant treatment in vitro has been demonstrated to protect hepatocytes overexpressing CYP2E1 from the synergistic toxicity of polyunsaturated fats such as arachidonic acid and iron [11]. Similarly, in vivo, feeding with the glutathione precursor l-oxothioazolidine-4-carboxylic acid and with dietary antioxidant extracts from cocoa and green tea, as well as gene therapy resulting in hepatic overexpression of either Cu/Zn or Mn superoxide dismutase has been shown to be protective against ALD [4,12-16]. It is noteworthy that these later observations were performed in rat intragastric ethanol-infusion models such as that originally developed by Tsukamoto et al. [5] where pathology is accompanied by endotoxemia and Kupffer cell activation as measured by increased production of oxidants via NADPH oxidase and increased expression of the endotoxin receptor CD14 [4,12-18]. We have developed a total enteral nutrition (TEN) model in which ethanol is also infused intragastrically, but in which ethanol substitututes for carbohydrate as part of an isocaloric diet. In this model, development of ALD (steatohepatitis accompanied by focal necrosis) above and beyond simple steatosis is dependent upon low dietary carbohydrate content (≤5% total calories) and high polyunsaturated dietary fatty acids (PUFA) (high PUFA/carbohydrate ratio) [19,20]. Moreover, in this later model, ALD develops without significant elevations in endotoxin [21,22]. Since Kupffer cell activation by endotoxins might represent a major source of free radical species, in the current study, we have used the dietary antioxidant N-acetylcysteine (NAC) to determine whether oxidative stress might also be responsible for ethanol toxicity in the absence of the proinflammatory stimulation by endotoxins. NAC is a dietary antioxidant and glutathione precursor widely utilized in the treatment of acute oxidative liver injury by acetaminophen overdose [23,24] and which has been suggested to be a possible dietary therapy for ALD clinically [25].
Materials and methods
Animals and experimental design
All the animal studies described below were approved by the Institutional Animal Care and Use Committee at the University of Arkansas for Medical Sciences. All animals received humane care according to the criteria outlined in the Guide for the Care and Use of Laboratory Animals at an AAALAC approved animal facility at ACHRI. Groups of N = 6–13 male Sprague-Dawley rats, 300 g, were fitted with an intragastric cannula and infused with liquid diets using TEN as described previously [21,22]. Controls were infused at the NRC recommended caloric intake of 187 kcal/kg.75/day allowing growth at comparable rates to ad libitum chow-fed animals [21,22,26]. Control diets contained 16% protein (whey peptides), 41% carbohydrate (dextrose and maltodextrin), and 43% fat (corn oil) together with NRC recommended levels of vitamins and minerals [26,27]. In the ethanol-treated (EtOH) groups, ethanol was used to substitute isocalorically for carbohydrate calories at a dose of 10 g/kg/day. Thereafter, fat calories were reduced as the ethanol infusion was increased to a final level of 13 g/kg/day to produce a final diet composition of 16% protein, 5% carbohydrate, 43% fat, and 36% ethanol calories and to maintain a constant level of 5% carbohydrates throughout the study as described previously [21,22]. In addition, control and ethanol groups were treated with NAC at 1.2 g/kg/day added to the diets. Urine ethanol concentrations (UEC) were measured daily using an Analox Instuments GL5 analyzer. All rats were sacrificed after 45 days of infusion.
Biochemical analysis
Blood ethanol concentration (BEC) at sacrifice was measured by Analox and serum ALT levels were assessed as a measure of liver damage using the Infinity ALT liquid stable reagent (Thermo Electron Corp., Waltham, MA) according to manufacturer’s protocols. Liver microsomes were prepared by differential ultracentrifugation and p-nitrophenol hydroxylation was measured as described previously [19]. Carbon tetrachloride-dependent lipid peroxidation was measured as described by Johansson and Ingelman-Sundberg [28]. CYP2E1 apoprotein expression was measured by Western blot as described previously [19] using a rabbit polyclonal antibody raised against purified rat CYP2E1. Intracellular soluble antioxidant capacity was measured in protein-precipitated liver cytosol using the oxygen radical absorbance capacity (ORAC) assay [29,30]. Briefly, the assays were carried out on a FLUOstar Galaxy plate reader, which was equipped with an incubator and two injection pumps. The temperature of the incubator was set to 37°C. The procedures were based on the modified ORACFL method [30]. 2,2′-Azobis(2-amidinopropane) dihydrochloride (AAPH) was used as a peroxyl radical generator and Trolox as a standard. Forty microliters of sample or blank (phosphate buffer), and Trolox calibration solutions (in phosphate buffer), was transferred to 48-well microplates in duplicate based upon a set layout. The plate reader was programmed to record the fluorescence of fluorescein (FL) every cycle. In cycle 1, the instrument reads the fluorescence in each of the wells. In cycle 2, the computer was programmed to pipette 400 μL FL from pump 1 into the respective wells to give a final FL concentration of 14 μM followed by reading the fluorescence. During cycle 3, the instrument read the fluorescence of all wells in the plate. During cycle 4, pump 1 was not used, and pump 2 was programmed to inject 100 μL AAPH to the respective wells to give a final AAPH concentration of 117.5 mM or 6.3 μmol/well. The plate contents were mixed by shaking for 20 s following each injection and/or reading. Major parameters of assay for the microplate reader were: cycle number, 35; cycle time, 210 s with 8 s orbital shaking (4 mm shake width) before each cycle; position delay, 0.3 s; injection speed of 420 μL/s for both pump 1 and pump 2. The final ORAC values were calculated using a linear regression equation (y = a + bx) between the concentration of Trolox standards (y) and the net area under the FL decay curve for the standards (x). ORACFL values were expressed as micromoles of Trolox equivalent (TE). The data were analyzed using Microsoft Excel (Microsoft, Roselle, IL).
Histopathology, immunostaining, and imaging
Liver samples were processed and paraffin-embedded sections were stained with hematoxylin and eosin (H&E). H&E-stained liver sections were scored for macro-and microsteatosis, inflammation (macrophage infiltration), and necrosis by a board-certified pathologist (S.K.) with no prior knowledge of the treatment groups. Scoring was based on a scale encompassing 1 (baseline) to 4 (most extensive) as described elsewhere [19]. Steatosis was scored as the percentage of parenchymal cells containing fat (micro-or macrosteatosis) as <25% = 1, 25–50% = 2; 50–75% = 3; >75% = 4. The presence of inflammation based on infiltration by polymorphonuclear cells, leukocytes, and mononuclear cells was evaluated using a scale where no inflammation = 1; occasional foci of inflammatory cells = 2; frequently occurring small foci of inflammatory cells = 3; frequently occurring large foci of inflammatory cells = 4. Necrosis was assessed using a scale where occasional (<1%) necrotic hepatocytes = 1; frequent (5–10%) necrotic hepatocytes = 2; small foci of necrosis (clusters of >10 necrotic cells) = 3 and extensive areas of necrosis (>25% of the lobular unit) = 4. Total pathology score was determined by summing the scores for steatosis, inflammation, and necrosis. Therefore, the total pathology score for a normal liver = 3. Immunostaining for proteins adducted with the lipid peroxidation products malondialdehyde (MDA) and 4-hydroxynonenal (HNE) was performed with protein G-purified polyclonal antibodies specific for MDA and HNE adducts as described in detail previously by Sampey et al. [31]. Quantitation of immunostained sections was carried out using Image-Pro image acquisition software (Media Cybernetics, Silver Spring, MD) as described previously [31].
Autoantibodies against MDA, HNE, and hydroxyethyl radical (HER) protein adducts
Bovine serum albumin adducts with MDA, HNE, and HER were prepared as described by Mottaran et al. [32]. Antibodies to adducted proteins in rat serum were measured in microwell plates coated with modified or native BSA as described previously [21,22,32].
Cytokine analysis
Expression of mRNAs coding for the cytokines interleukin (IL)1β, IL-4, IL-6, tumor necrosis factor (TNF)α, and tumor growth factor (TGF)β were quantified by real-time RT-PCR as follows. Total RNA was isolated from tissue using SV total RNA Isolation System (Promega, Madison, WI) according to the manufacturer’s protocol. The integrity of the RNA was confirmed by denaturing gel electrophoresis. RNA samples were quantified using the RiboGreen quantitation assay, after DNase digestion, according to procedures developed by the manufacturer (Molecular Probes, Eugene, OR). Reverse-transcription reaction was performed with 0.5 μg of total RNA in a final volume of 10 μl, using M-MLV Reverse Transcriptase (Invitrogen. Stockholm, Sweden) essentially according to procedures developed by the manufacturer. Each PCR contained 2–10 μl of cDNA template, 1X Buffer, 1.25 to 1.5mM MgCl2, 0.2 mM dNTPs, 0.25 μM of each primer, and 0.625 units Taq DNA Polymerase (ABGene, Epsom, UK). For primer sequences, see Table 1. Each PCR consisted of 95°C for 1 min followed by 25–40 cycles of 95°C for 15 s, 52 or 60°C for 20 s, and 72°C for 1 min. PCR products were separated on ethidium bromide-containing agarose gels. Identity of PCR products was verified by DNA sequencing, using the BigDye Terminator cycle sequencing ready reaction kit (Applied Biosystems) according to the manufacturers instructions. Real-time PCR was performed using 5 μl of diluted cDNA template in a 25-μl reaction containing 0.25 μM of each primer and 12.5 μl SybrGreen real-time PCR MasterMix (Applied Biosystems). Each run consisted of 50°C for 2 min and 95°C for 10 min followed by 40 cycles of 95°C for 15 s, 60°C for 20 s, and 72°C for 60s and was followed by a melt curve analysis, and separation on ethylene bromide-containing agarose gels. PCR was performed using the Applied Biosystems ABI PRISM 7700 sequence detection system. For primer sequences see Table 1. All samples were run blind and reactions were performed in at least duplicates from separate cDNA reactions. All primers were designed to span at least one intron.
Table 1.
Real-time RT-PCR probes for cytokines
| Primer name | Sequence 5′–3′ | Product size, bp |
|---|---|---|
| IL1β forward | TGA CCC ATG TGA GCT GAA AG | 241 |
| IL1β reverse | GAA GAC AAA CCG CTT TTC CA | 241 |
| IL 4 forward | GCA ACA AGG AAC ACC ACG G | 91 |
| IL 4 reverse | AAG CAC GGA GGT ACA TCA CGT | 91 |
| IL 6 forward | TGA TGG ATG CTT CCA AAC TG | 230 |
| IL 6 reverse | GAG CAT TGG AAG TTG GGG TA | 230 |
| TNFα forward | ACT GAA CTT CGG GGT GAT TG | 153 |
| TNFα reverse | GCT TGG TGG TTT GCT ACG AC | 153 |
| TGFβ forward | CTT CAG CTC CAC AGA GAA GAA CTG C | 298 |
| TGFβ reverse | CAC GAT CAT GTT GGA CAA CTG CTC C | 298 |
| Cyclophilin A forward | GCA TAC AGG TCC TGG CAT CT | 192 |
| Cyclophilin A reverse | TTC TTG CTG GTC TTG CCA TT | 192 |
CD14 expression analysis
Liver expression of mRNA for the endotoxin receptor CD14 was quantified by real-time RT-PCR as described previously [33] using the following primer sequences: forward, 5′-ACACACGTTGAAACCGGGTCAA-3′; reverse, 5′-CCCAACTCAGGGTTGTCAGACA-3′. As for the cytokines, mRNA expression data were normalized to expression of the housekeeping gene cyclophilin.
Measurement of liver GSH concentrations
GSH levels were quantified in livers from control and ethanol-treated rats using a commercially available kit (703002) from Cayman Chemical Co. (Ann Arbor, MI). The kit is based on enzymic recycling of GSH using GSH reductase followed by reaction of GSH with Ellman’s reagent. The colored product is measured at 405 nm and quantified using a standard curve.
Statistics
Data are expressed as means ± standard error. In most cases, groups were compared statistically by two-way analysis of variance (ANOVA) followed by Student’s Neuman-Keuls post hoc analysis for specific comparisons between means using SigmaStat for Windows (Jandal Scientific Software). In the case of the liver pathology scores which were not normally distributed, median values were compared by two-way ANOVA of Ranks followed by Dunn’s test. Pearson’s r values were used for the estimation of correlations. The specific statistical comparisons between means and medians were as follows: within each diet between rats fed ethanol and controls and within controls or ethanol-treated groups for the effects of the antioxidant supplementation.
Results
Weight gain data are presented in Table 2. TEN controls gained 3.3 g/day, a rate comparable with the ~3 g/day weight gain of male rats of the same age and weight fed chow ad libitum. Body weight gains were higher (P < 0.05) in the NAC-supplemented control group. Ethanol treatment reduced weight gain in the NAC-supplemented group (P < 0.05). Urine ethanol concentrations presented in Fig. 1 reveal that ethanol-treated rats demonstrated a characteristic pulsatile pattern of peaks around 300–400 mg/dl and nadirs below 50 mg/dl as previously observed by ourselves and other investigators, even though the same dose of ethanol was infused continuously throughout the study [17,22,31,34]. Supplementation with NAC had no effect on UEC profiles: average UEC 171 ± 13 mg/dl vs 178 ± 15 mg/dl in the NAC + EtOH vs EtOH groups (Fig. 1). Similar lack of effects of NAC were observed on BEC values at sacrifice (Table 2) as would be expected since ethanol equilibrates with body water and UECs are known to accurately track BEC values [34]. UECs/BECs represent the small fraction of infused ethanol which escapes first pass and systemic metabolism.
Table 2.
Effects of chronic ethanol and antioxidants on growth and liver pathology
| Treatment | Body wt gain1 | Liver wt2 | BEC3 | ALT4 | Steatosis5 | Inflammation5 | Necrosis5 | Total pathology6 |
|---|---|---|---|---|---|---|---|---|
| Control | 3.3 ± 0.13 | 12.4 ± 0.8 (2.8) | – | 112 ± 10 | 1.0 ± 0.01 | 1.2 ± 0.17 | 1.0 ± 0.01 | 3.2 ± 0.17 |
| Control + NAC | 4.2 ± 0.13a | 13.5 ± 0.6 (2.8) | – | 126 ± 18 | 1.0 ± 0.01 | 1.2 ± 0.17 | 1.0 ± 0.01 | 3.2 ± 0.17 |
| EtOH | 3.1 ± 0.08 | 20.5 ± 0.7 (4.8)b | 106 ± 37 | 267 ± 38b | 4.0 ± 0.25b | 3.0 ± 0.23b | 2.6 ± 0.22b | 9.4 ± 0.67b |
| EtOH + NAC | 2.1 ± 0.04c,d | 18.6 ± 0.7 (4.7)c | 109 ± 23 | 172 ± 23c,d | 3.5 ± 0.27c | 2.1 ± 0.25c,d | 1.9 ± 0.27c | 7.4 ± 0.51c |
Data are presented as means ± SE for N = 8 –13 rats/group.
Statistical significance as indicated by superscripts a–d (P < 0.05) was determined by two-way ANOVA followed by Student’s Neuman-Keuls post hoc analysis except for the pathology scores where statistical significance was determined by two-way ANOVA of Ranks followed by Dunn’s test.
control + NAC vs control.
EtOH vs control.
EtOH + NAC vs control + NAC.
EtOH + NAC vs EtOH.
g/day.
g (% body weight).
BEC at sacrifice, mg/dl.
SF units/ml.
Pathology score as defined under Materials and methods, normal pathology = 1.
Total pathology score as defined under Materials and methods, normal pathology = 3.
Fig. 1.
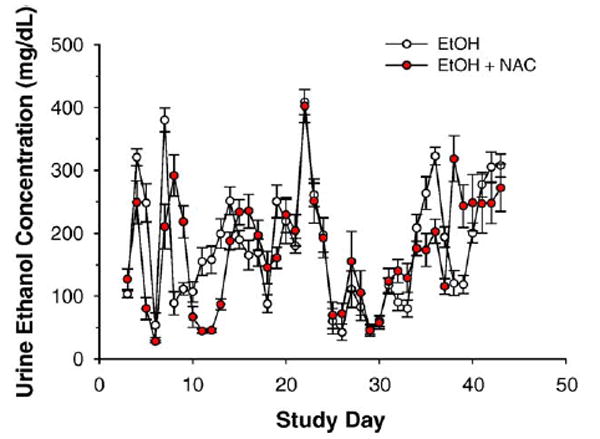
Urine ethanol concentration profiles for ethanol-infused rats on TEN diets with and without NAC. Data are means ± SE for N = 8 – 13 rats/group.
Dietary supplementation with NAC partly protects against liver injury by ethanol
Liver pathology and serum ALT values are presented in Fig. 2 and Table 2. As described previously, rats infused ethanol as part of low carbohydrate TEN diets developed micro-and macrovesicular steatosis, inflammatory infiltrates, and occasional foci of necrosis and this was accompanied by 2-to 3-fold increases in serum ALT [19-22,31]. Dietary supplementation with NAC provided partial protection against ALT release which was decreased (P < 0.05) in the NAC + EtOH compared to the EtOH group. However, in the EtOH + NAC group ALT values were still significantly elevated relative to diet controls. Liver steatosis was not influenced by dietary supplementation with NAC. The pathology score for inflammation was significantly (P < 0.05) lower in the NAC + EtOH compared to the EtOH group. Necrosis scores were also 30% lower in the liver of rats receiving NAC + EtOH, but the mean values did not reach statistical significance.
Fig. 2.
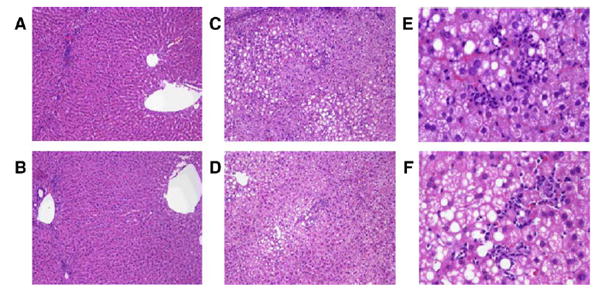
Representative liver pathology produced by ethanol treatment in the presence or absence of dietary supplementation with NAC demonstrating the presence of macro- and microvesicular steatosis, inflammatory infiltrates, and focal necrosis. (A and B) Control diets (×10 magnification); (A) control, (B) control + NAC, (C–F) ethanol diets (C and D ×10 magnification; E and F ×40 magnification); (C and E) EtOH; (D and F) EtOH + NAC.
Dietary NAC enhances liver antioxidant status, maintains hepatic GSH concentrations after ethanol treatment, and abolishes ethanol-induced MDA and HNE adducts
Dietary supplementation with NAC in rats fed control TEN diets increased soluble antioxidant capacity (P < 0.05) in liver cytosol as measured by the ORAC assay (Fig. 3). Ethanol treatment lowered antioxidant capacity by the same amount in both the EtOH and the EtOH + NAC groups (P < 0.05), but since the EtOH + NAC group started with a higher level, ORAC values for EtOH + NAC rats were statistically identical to TEN controls. EtOH treatment also decreased liver GSH concentrations (P < 0.05) and this was prevented by NAC supplementation (Fig. 4). Oxidative stress was monitored by the immunohistochemical detection of MDA and HNE adducted to liver proteins [31]. As shown in Figs. 5 and 6, ethanol infusion as part of a low carbohydrate liquid diet significantly increased protein adduct formation by both products of lipid peroxidation. Dietary supplementation with NAC effectively abolished ethanol-induced formation of protein MDA and HNE adducts (Figs. 5 and 6). Correlational analysis revealed a positive correlation between MDA and HNE adduct immunostaining and the pathological scores for both inflammation and necrosis (r values ranging from 0.71 to 0.91; P between 0.01 and 0.0001).
Fig. 3.
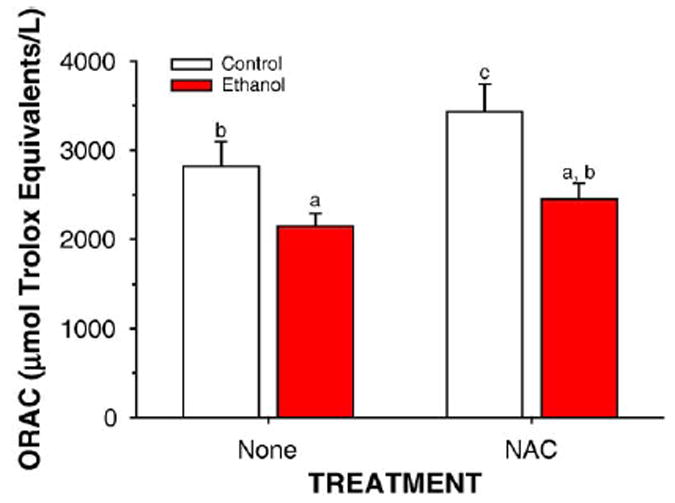
Effects of ethanol and antioxidants on liver cytosolic antioxidant status as determined by the ORAC assay. Data are mean ± SE for N = 8–13 rats/group. Means with different superscripts differ significantly (P < 0.05) by two-way ANOVA followed by Student’s Neuman-Keuls post hoc analysis.
Fig. 4.
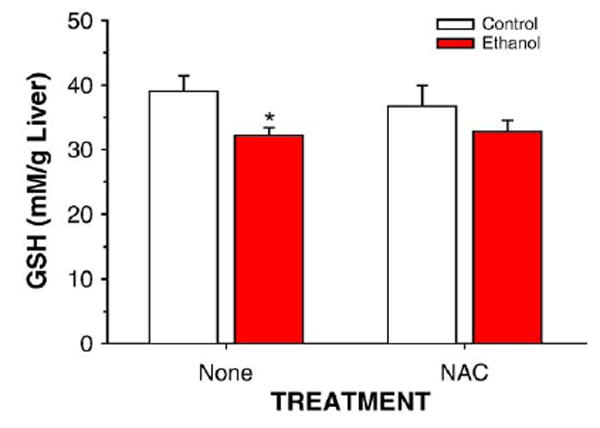
Quantitation of GSH concentrations in liver homogenates from rats fed control or ethanol diets in the presence or absence of dietary supplementation with NAC. Data are means ± SEM for N = 8 – 13 rats/group. *Significantly different from control (P < 0.05) by two-way ANOVA followed by Student’s Neuman-Keuls post hoc analysis.
Fig. 5.
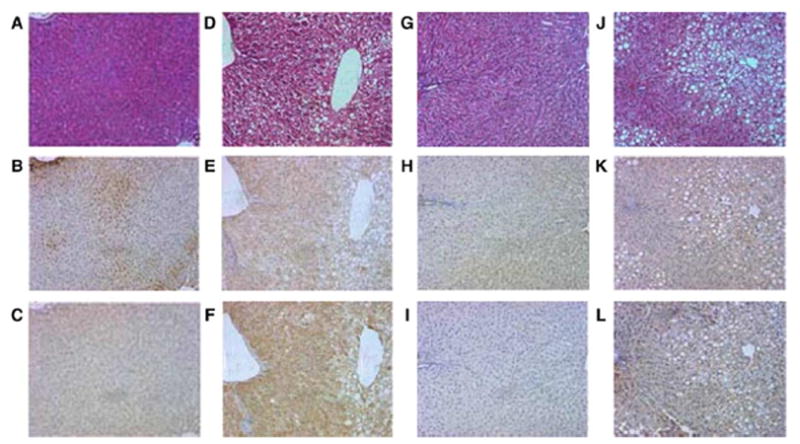
Representative H&E and immunohistochemical staining of serial slides of livers from rats treated with ethanol in the presence or absence of dietary supplementation with NAC using antibodies against protein adducts of the lipid peroxidation products 4-HNE and MDA. (A–C) Control; (D–F) EtOH; (G–I) control + NAC; (J –L) EtOH + NAC. Top panels (A,D,G,J), Hemotoxylin & Eosin; middle panels (B,E,H,K); anti-4-HNE; bottom panels (C,F,I,L), anti-MDA.
Fig. 6.
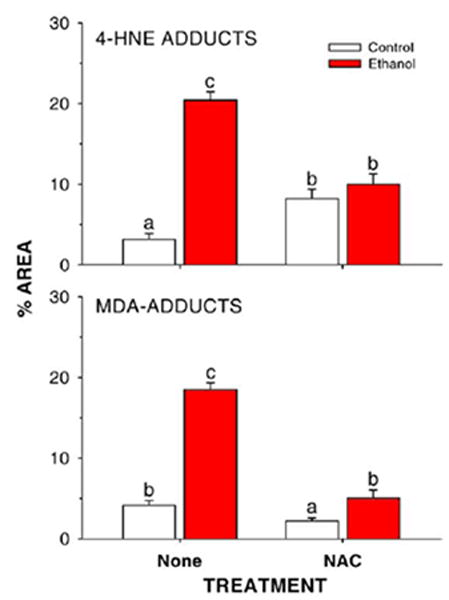
Quantitation of lipid peroxidation product-protein adducts in liver slices from rats fed control or ethanol-containing diets in the presence or absence of dietary supplementation with the antioxidant NAC. Data are presented as means ± SE for N = 8– 13 rats/group. Means with different superscripts differ significantly (P < 0.05) by two-way ANOVA followed by Student’s Neuman-Keuls post hoc analysis.
NAC treatment has no effect on ethanol induction of CYP2E1
Data for CYP2E1 apoprotein expression in hepatic microsomes and for the CYP2E1-dependent monooxygenase activities p-nitrophenol hydroxylation and microsomal carbon tetrachloride-dependent lipid peroxidation are shown in Figs. 7 and 8. As shown previously, ethanol treatment as part of a low carbohydrate liquid diet resulted in a large induction of CYP2E1 apoprotein and activity (P < 0.05). This was not significantly affected by supplementation of the diet with NAC.
Fig. 7.
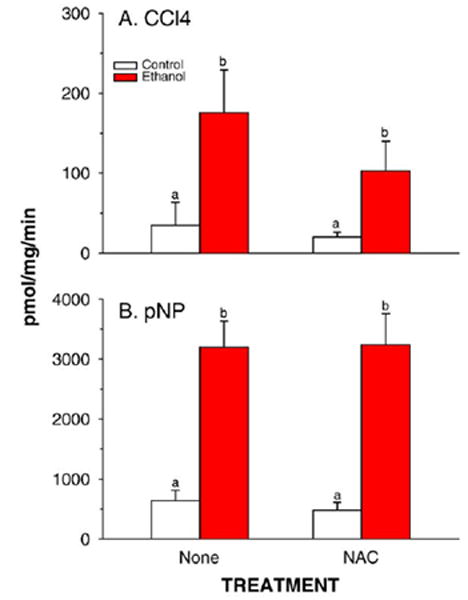
CYP2E1-mediated carbon tetrachloride-dependent lipid peroxidation (CCl4) and p-nitrophenol hydroxylation (pNP) in liver microsomes prepared from rats fed control or ethanol-containing diets using the TEN system in the presence or absence of the dietary antioxidant NAC. Data are means ± SE for N = 8 –13 rats/group. Means with different superscripts differ significantly (P < 0.05) by two-way ANOVA followed by Student’s Neuman-Keuls post hoc analysis.
Fig. 8.
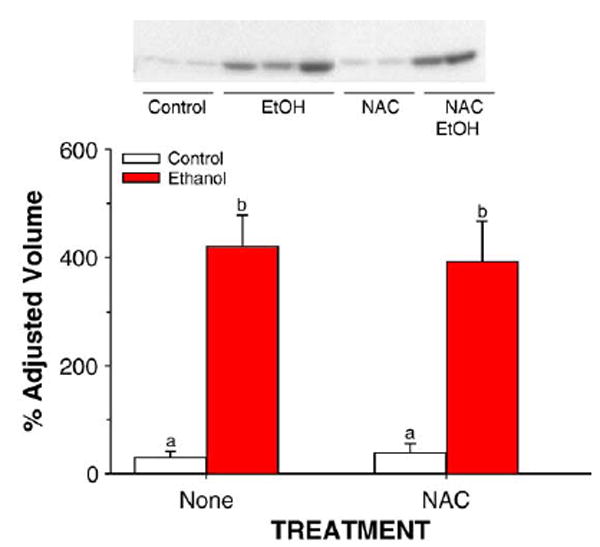
Western blot analysis and immunoquantitation of CYP2E1 peroxidation in liver microsomes prepared from rats fed control or ethanol-containing diets using the TEN system in the presence or absence of the dietary antioxidant NAC. Data are means ± SE for N = 8– 13 rats/group. Means with different superscripts differ significantly (P < 0.05) by two way ANOVA followed by Student’s Neuman-Keuls post hoc analysis. C, control; E, ethanol-treated.
Dietary NAC suppresses immune responses to ethanol-induced protein adducts
Titers of antibodies directed against proteins adducted to the hydroxyethyl (HER) radical and against proteins adducted to the lipid peroxidation products MDA and HNE are shown in Fig. 9. Ethanol treatment increased titers of antibodies toward all three adducts (P < 0.05). The ethanol effect on antibodies to HNE adducts was abolished (P < 0.05) and the effect on antibodies to HER and MDA adducts was reduced by supplementation with NAC.
Fig. 9.
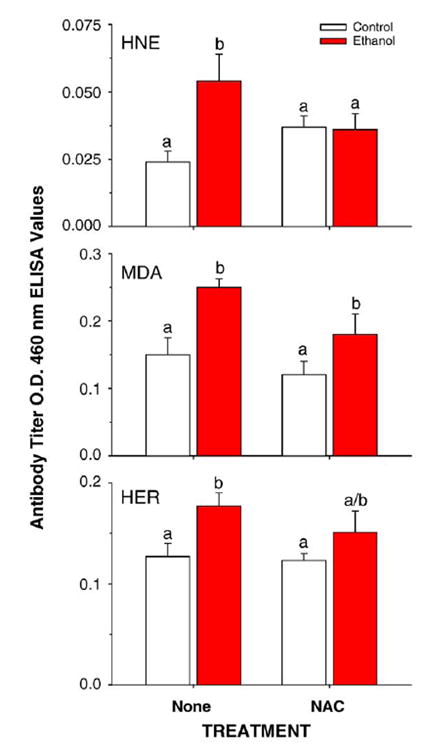
Effects of ethanol-treatment in the presence or absence of the dietary antioxidant NAC on antibody titers toward HNE-, MDA-, or HER-adducted proteins. Data are means ± SE for N = 8– 10 rats/group. Means with different superscripts differ significantly (P < 0.05) by two-way ANOVA followed by Student’s Neuman-Keuls post hoc analysis from TEN and NAC + TEN groups.
Ethanol treatment in the TEN model does not induce expression of endotoxin receptor CD14 mRNA in rat liver
Real-time RT-PCR quantification of hepatic CD14 mRNA is shown in Fig. 10. Neither ethanol treatment nor NAC supplementation had a significant effect on CD14 gene expression.
Fig. 10.
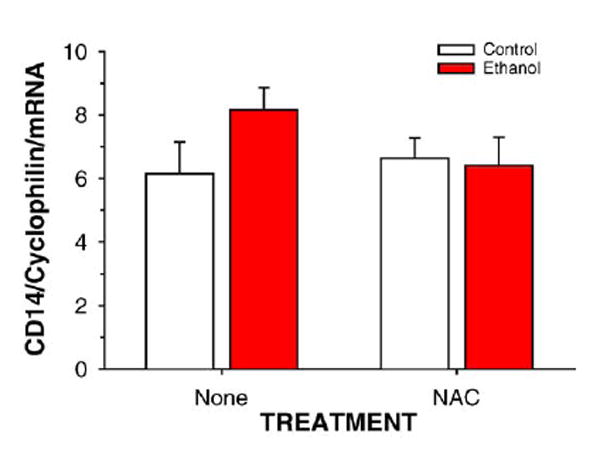
Effects of ethanol-treatment in the presence or absence of the dietary antioxidant NAC on hepatic expression of mRNA to the endotoxin receptor CD14. Data are means ± SE for N = 8 – 10 rats/group of CD14/cyclophilin mRNA ratios determined by real-time RT-PCR.
Effects of dietary NAC on ethanol-induced alterations in cytokine profile
The expression of hepatic mRNAs coding for the cytokines TNFα, TGFβ, IL-1β, IL-4, and IL-6 is shown in Table 3. NAC supplementation of control diets produced a greater than 50% decrease in IL-6 mRNA (P < 0.05) and a nonsignificant decrease in IL-4 mRNA expression. Ethanol infusion increased liver TNFα and TGFβ mRNA expression (P < 0.05), while expression of IL-1β and IL-6 mRNAs was not affected. As previously observed [21,22] IL-4 mRNA was lower in ethanol-treated rat groups (P < 0.05). The liver mRNA content of TGFβ, IL-4, and IL-6 was not different between the EtOH and the NAC + EtOH groups. However, NAC decreased the mean TNFα expression in ethanol-treated rats by 44%. Because of large intraindividual variations, this difference did not reach statistical significance. Nonetheless, liver TNFα expression showed a direct correlation with both MDA (r = 0.77; P = 0.004) and HNE (r = 0.66; P = 0.018) immunostaining. A significant (P < 0.0001) correlation was also evident between TNFα mRNA and the pathological scores for both inflammation and necrosis (r = 0 0.69 and 0.63, respectively).
Table 3.
Effect of ethanol and antioxidants on cytokine mRNA profiles
| Treatment | TNF α | TGF β | IL-1 β | IL-4 | Il-6 |
|---|---|---|---|---|---|
| Control | 0.8 ± 0.2 | 0.3 ± 0.1 | 1.2 ± 0.1 | 0.59 ± 0.14 | 10 ± 2 |
| Control + NAC | 0.8 ± 0.2 | 0.3 ± 0.1 | 1.3 ± 0.2 | 0.42 ± 0.16 | 4 ± 1# |
| EtOH | 4.3 ± 1.3* | 1.2 ± 0.2* | 1.4 ± 0.2 | 0.20 ± 0.02* | 10 ± 1 |
| EtOH + NAC | 2.4 ± 0.3* | 1.0 ± 0.2* | 1.4 ± 0.3 | 0.15 ± 0.03* | 8 ± 2 |
Data are presented as means ± SE for mRNA transcript expression normalized to expression of the housekeeping gene cyclophilin for N = 8 –13 rats/group.
Statistically significant P < 0.05 EtOH vs respective controls.
Statistically significant P < 0.05 vs control by two-way ANOVA followed by Student’s Neuman-Keuls post hoc analysis.
Discussion
Whereas the species of prooxidants involved, and their source, remains the subject of considerable dispute, ethanol-induced oxidative stress and its role in the development of ALD has been the subject of many studies [3,4]. Superoxide anions (O2•−) derived primarily from NADPH oxidase in endotoxin-activated Kupffer cells have been implicated in ethanol-induced inflammation and development of ALD in the gastric infusion model developed by the late Dr. Ron Thurman and colleagues at UNC [4-7]. Evidence in favor of this includes the NADPH-oxidase-dependent induction of the endotoxin receptor CD14 in liver from ethanol-treated rats [17,18]. Similar induction of CD14 is observed in other models of increased gut permeability and endotoxemia such as thermal injury and estriol treatment [35,36] and in all cases can be reversed by antibiotic treatment [17,35,36]. In addition, protection against alcoholic liver pathology and elevation of TNFα has been demonstrated in p47phox knockout mice [37] and gene therapy resulting in overexpression of either Cu/Zn or Mn superoxide dismutase (SOD) is also protective against development of pathology in this model [15,16]. However, we have previously demonstrated that in the rat TEN model of ALD utilized in the current study, no significant increases in plasma endotoxin occur following ethanol treatment [21,22]. Data from the current study demonstrating a lack of significant induction of hepatic CD14 mRNA expression following ethanol treatment are consistent with a lack of Kupffer cell activation in this model. Since (O2•−) is not a potent oxidant, it has also been suggested that more potent oxidant radicals are formed by subsequent catalytic pathways including hydroxyl radicals via SOD-derived H2O2 and subsequent Fenton reactions with transition metals, H2O2 reaction with Cl− derived from myeloperoxidase in neutrophils to form hypochlorous acid (HOCl−), and reaction of O2•− with nitric oxide synthase-derived NO• to form peroxynitrite (ONOO−) [4]. In addition, it has been suggested that hydroxyethyl radicals derived from CYP2E1-dependent ethanol metabolism also contribute to ethanol-induced oxidative stress, cytokine production, and ALD [3,38-42]. Regardless of the source of ROS and other short-lived radical species, reaction with membrane lipids has been shown to result in production of lipid-derived radicals, lipid peroxidation, and depletion of antioxidant defenses in the liver following ethanol treatment [3,4,20,31]. Diets high in polyunsaturated fats which result in liver membranes most susceptible to free radical attack and lipid peroxidation, also result in the greatest degree of experimental alcoholic liver injury and protection by dietary saturated fats is associated with reductions or reversal of hepatic oxidative stress [20,43,44]. Lipid peroxidation products such as MDA and HNE and the hydroxyethyl radical form adducts with proteins which may alter their normal function. These adducts have also been shown to display cytotoxic effects in several cell types [45,46], interfere with intracellular proteolysis [47], and may alter intracellular signaling pathways [31]. In addition, adducted proteins also stimulate the host immune response and result in an autoimmune-like disease. Antibodies to MDA-, HNE-, and HER-adducted proteins have been demonstrated in plasma from both animal models of ALD and human alcoholics [21,22]. Oxidative stress has also been suggested to be involved in the activation of a number of signaling cascades associated with the redox modification of thiols including the transcription factor nuclear factor κB (NFκB), stress-activated protein kinases (e.g., p38, JNK), apoptosis modulators such as Bcl-2, and calcium signaling which have been associated with ALD [4]. In particular it has been suggested that activation of NFκB in Kupffer cells is involved in the up-regulation of cytokines such as TNFα and is a key mediator of ethanol-induced hepatic inflammatory responses [4,48].
The data presented above confirm that ethanol treatment produces substantial oxidative stress even in a rat model where endotoxin is not elevated and Kupffer cell activation is minimal. Moreover, we have shown that dietary NAC is an effective hepatic antioxidant that abolishes ethanol-induced lipid peroxidation after chronic exposure. The increased antioxidant capacity observed in liver cytosol following NAC supplementation of TEN control diets using the ORAC assay in Fig. 3 probably reflects increases in the hepatic NAC pool since hepatic GSH concentrations were unaffected in control rats supplemented with dietary NAC and NAC is itself an effective antioxidant. Ethanol treatment reduced antioxidant capacity in both control and NAC-supplemented rats; however, since NAC treatment resulted in higher capacity to begin with, there was no depletion in antioxidant capacity in NAC + EtOH rats compared to TEN controls. Moreover, although ethanol treatment significantly lowered hepatic GSH concentrations, consistent with previous studies in the TEN model [20], NAC supplementation prevented this loss. Thus, increased GSH synthesis from the NAC precursor appears to be stimulated in response to ethanol-induced oxidative stress. In addition, NAC treatment effectively prevented ethanol-induced formation of protein adducts derived from lipid peroxidation products and blocked ethanol-associated immune responses. In particular, NAC abolished the ethanol-induced increase in antibody production toward HNE adducts and reduced antibody production toward hydroxyethyl free radical adducts. This latter effect is likely related to the capacity of –SH groups to scavenge HER [49], since NAC does not interfere with HER formation consequent to CYP2E1 induction. Inhibition of ethanol-induced oxidative stress by dietary NAC supplementation resulted in partial protection against the development of liver injury. Specifically, ALT values and the inflammation score were significantly lower relative to the ethanol-treated group and the mean necrosis score was also decreased. Although ALT values in control rats in this study were slightly higher than the 40–60 SFU/ml we have generally observed in the TEN model [19], this was not associated with any pathological change. Clinically, ALT values are only poorly correlated with ethanol-induced liver injury and are only increased 2-to 8- fold in human ALD similar to the increase observed in the current study [50].
NAC treatment alone decreased IL-6 expression, but it is unclear if this is an effect specific to NAC or also occurs with other thiol-like antioxidants. TNFα mRNA expression was decreased in the EtOH + NAC group 30–45% relative to the EtOH group and a good correlation was observed between reduction in oxidative stress markers, TNFα mRNA expression, inflammation, and necrosis scores. In contrast, little effect of NAC treatment was observed on steatosis score and changes in TGFβ and IL-4 mRNA expression for the EtOH + NAC group were identical to those of animals infused ethanol alone. One possible explanation for the partial protection against ALD afforded by NAC in the current study compared to the other studies showing more potent reversal of liver pathology by antioxidants may reflect differences in the animal models used by different research groups. One area of general agreement between investigators studying mechanisms of ALD is that hepatosteatosis is necessary a prerequisite for any further damage. Dietary protection against development of ALD by saturated fats reported in our laboratory and others does coincide with reduced oxidative stress indices [20,43]. However, in this case, increased fatty acid degradation and reversal of ethanol effects on triglyceride packaging and transport also result in reduced steatosis. A significant role for oxidative stress in the elevation of TNFα following ethanol consumption and a central role for TNFα in the development of necrosis in alcoholic livers have been proposed by several investigators [4,51-54]. However, it has also been proposed that elevation of TNFα plays a role in the development of alcoholic steatosis [4]. This hypothesis is based largely on the report of Yin et al. [51] demonstrating that liver damage and steatosis were completely prevented in ethanol-infused TNFR1 knockout mice and a recent report from Zhou et al. [52] that NAC reverses oxidative stress, TNFα, and steatosis following acute ethanol administration to 129/Sv mice. However, our current data with chronic ethanol administration in rats showed no correlation between TNFα expression and steatosis score and suggests that TNFα plays little or no role in the development of alcoholic steatosis. Our data are in better agreement with a recent study by Ji et al. [54] in ethanol-infused TNFR1 knockout mice which also demonstrated significantly reduced ALT levels and necroinflammatory changes in liver compared to wild-type mice but which showed less than a 20% reduction in steatosis score. Previous studies demonstrating that administration of the nonglucocorticoid 21-aminosteroid, tirilazad mesylate to intragastric alcohol-fed rats greatly reduced MDA and 8-isoprostane formation and completely prevented the development of necro-inflammatory changes, without affecting liver steatosis, also suggest that lipid peroxidation is unrelated to development of fatty liver [55].
The majority of data showing protective effects of chemical antioxidants and knockout/transgenic effects have been reported in the intragastric model of Thurman and colleagues. [1,4]. This model is characterized by significant endotoxemia and LPS-dependent Kupffer cell activation [1] that further enhances oxidative stress. In contrast, little or no endotoxemia has been reported in the TEN model studied in our laboratory [21,22] and the lack of CD14 induction in the current study is consistent with a lack of Kupffer cell activation. Nonetheless the observation that, in the TEN model, there is an association between the lipid peroxidation and both TNF-α mRNA expression and the extent of inflammatory infiltrates indicates that, in the absence of endotoxiemia and Kupffer cell activation, oxidative stress contributes to the stimulation of inflammatory reactions associated with ethanol toxicity. At the moment, the mechanism by with ethanol-induced oxidative stress contributes to maintain chronic inflammation is unclear. However, the observation that NAC reduces the immune response triggered by HER and lipid peroxidation products suggests that immune mechanisms might be involved. This hypothesis is consistent with the observations in humans showing that elevated titers of circulating IgG toward MDA, 4-HNE, and oxidized arachidonic acid adducts are also detectable in a large fraction (55–70%) of patients with biopsy-proven advanced alcoholic liver disease (alcoholic hepatitis and/or cirrhosis), but only in few (8–13%) subjects with fatty liver only, irrespective of the magnitude and the duration of alcohol intake [32]. These antibodies are also higher in patients with severe cirrhosis (Child’s Grade B and C) as compared to those with milder disease (Child’s Grade A) [32]. The possibility that an immune response triggered by oxidative stress might have a role in the progression of alcohol liver damage is further strengthened by the association between high titers of anti-MDA antibodies and the presence of a T-lymphocyte response toward the same antigens [56] and the capacity of anti-HER IgG to activate antibody-dependent cell-mediated cytotoxicity (ADCC) [57].
In conclusion, in the current study, using NAC in combination with the TEN model, we have demonstrated that ethanol-induced oxidative stress contributes to promote inflammatory reactions and liver injury even in the absence of endotoxin-mediated Kupffer cell activation. Thus, it appears that oxidative stress not only may exacerbate some aspects of ethanol-induced injury, but potentially by promoting an immune response, has a role in maintaining chronic inflammation that is important for the development of fibrosis.
Acknowledgments
This work was supported in part by R01 AA08645; R21 AA12931 (T.M.B.) and R01 AA09300 (D.R.P.). The authors thank Terry Fletcher, Matt Ferguson, Shanda Ferguson, Cindy Mercado, Kim Hale, Drew Holder, Jamie Badeaux, Pam Treadaway, James M. Robinette, Michele Perry, Elisa Mottaran, Maria Grazia Moretti, Gunilla Ronnholm, and Anna Uno for technical assistance on this project.
Abbreviations
- ALD
alcohol-induced liver damage
- TEN
total enteral nutrition
- PUFA
polyunsaturated dietary fatty acids
- NAC
N-acetylcysteine
- UEC
urine ethanol concentrations
- BEC
blood ethanol concentration
- ORAC
oxygen radical absorbance capacity
- AAPH
2,2′-azobis(2-amidinopropane) dihydrochloride
- FL
fluorescein
- MDA
malondialdehyde
- HNE
4-hydroxynonenal
- IL
interleukin
- TNF
tumor necrosis factor
- TGF
tumor growth factor
- HER
hydroxyethyl
- SOD
superoxide dismutase
- NFκB
nuclear factor κB
References
- 1.Thurman RG. Alcoholic liver injury involves activation of Kupffer cells by endotoxins. Am J Physiol. 1998;275:G605–G611. doi: 10.1152/ajpgi.1998.275.4.G605. [DOI] [PubMed] [Google Scholar]
- 2.Tilg H, Diehl AM. N Engl J Med. 2000;343:1467–1476. doi: 10.1056/NEJM200011163432007. [DOI] [PubMed] [Google Scholar]
- 3.Albano E. In: Ethanol and the Liver. Sherman CDIN, Preedy VR, Watson RR, editors. London: Taylor & Francis; 2002. pp. 153–190. [Google Scholar]
- 4.Arteel GE. Oxidants and antioxidants in alcohol-induced liver disease. Gastroenterology. 2003;124:778–790. doi: 10.1053/gast.2003.50087. [DOI] [PubMed] [Google Scholar]
- 5.Tsukamoto H, Towner SJ, Ciofalo LM, French SW. Ethanol-induced liver fibrosis in rats fed high fat diets. Hepatology. 1986;6:814–822. doi: 10.1002/hep.1840060503. [DOI] [PubMed] [Google Scholar]
- 6.Nanji AA, Khetty U, Sadrzadeh SM, Yamanaka T. Severity of liver injury in experimental alcoholic liver disease: correlation with plasma endotoxin, prostaglandin E2, leukotriene B4 and thromboxane. Am J Pathol. 1993;142:367–373. [PMC free article] [PubMed] [Google Scholar]
- 7.Lindros KO, Jarvelainen HA. A new oral low-carbohydrate alcohol liquid diet producing liver lesions: a preliminary account. Alcohol Alcoholism. 1998;33:347–353. doi: 10.1093/oxfordjournals.alcalc.a008403. [DOI] [PubMed] [Google Scholar]
- 8.Paradis V, Kollinger M, Fabre M, Holstege A, Poynard T, Bedossa P. In situ detection of lipid peroxidation of lipid peroxidation by-products in chronic liver diseases. Hepatology. 1997;26:135–142. doi: 10.1053/jhep.1997.v26.pm0009214462. [DOI] [PubMed] [Google Scholar]
- 9.Knecht KT, Bradford BU, Mason RP, Thurman RG. In vivo formation of a free radical metabolite of ethanol. Mol Pharmacol. 1990;38:26–30. [PubMed] [Google Scholar]
- 10.Albano E, Clot P, Morimoto M, Tomasi A, Ingelman-Sundberg M, French SW. Role of cytochrome P4502E1-dependent formation of hydroxyethyl free radical in the development of liver damage in rats intragastrically fed with ethanol. Hepatology. 1996;23:155–163. doi: 10.1002/hep.510230121. [DOI] [PubMed] [Google Scholar]
- 11.Caro AA, Cederbaum AI. Synergistic toxicity of iron and arachidonic acid in HepG2 cells overexpressing CYP2E1. Mol Pharmacol. 2001;60:742–752. [PubMed] [Google Scholar]
- 12.Iimuro Y, Bradford BU, Yamashina S, Rusyn I, Nakagami M, Enomoto N, Kono H, Frey W, Forman D, Brenner D, Thurman RG. The glutathione precursor l-2-oxothiazolidine-4-carboxylic acid protects against liver injury due to chronic enteral ethanol exposure in the rat. Hepatology. 2000;31:391–398. doi: 10.1002/hep.510310219. [DOI] [PubMed] [Google Scholar]
- 13.McKim S, Konno A, Gabele E, Uesugi T, Froh M, Sies H, Thurman RG, Arteel G. Cocoa extract protects against early alcohol-induced liver injury in the rat. Arch Biochem Biophys. 2002;406:40–46. doi: 10.1016/s0003-9861(02)00425-3. [DOI] [PubMed] [Google Scholar]
- 14.Arteel GE, Uesugi T, Bevan LN, Gabele E, Wheeler MD, McKim SE, Thurman RG. Green tea extract protects against early alcohol-induced liver injury in rats. Biol Chem. 2002;383:663–670. doi: 10.1515/BC.2002.068. [DOI] [PubMed] [Google Scholar]
- 15.Wheeler MD, Knon H, Yin M, Rusyn I, Froh M, Connor HD, Mason RP, Samulski RJ, Thurman RG. Delivery of Cu/Zn-superoxide dismutase gene with adenovirus reduces early alcohol-induced liver injury in rats. Gastroenterology. 2001;120:1241–1250. doi: 10.1053/gast.2001.23253. [DOI] [PubMed] [Google Scholar]
- 16.Wheeler MD, Nakagami M, Bradford BU, Uesugi T, Mason RP, Connor HD, Dikalova A, Kadiiska M, Thurman RG. Overexpression of manganese superoxide dismutase prevents alcohol-induced liver injury in the rat. J Biol Chem. 2001;276:36664–36672. doi: 10.1074/jbc.M105352200. [DOI] [PubMed] [Google Scholar]
- 17.Enomoto N, Ikejima K, Bradford B, Rivera C, Kono H, Brenner DA, Thurman RG. Alcohol causes both tolerance and sensitization of rat Kupffer cells via mechanisms dependent on endotoxin. Gastroenterology. 1998;115:443–451. doi: 10.1016/s0016-5085(98)70211-2. [DOI] [PubMed] [Google Scholar]
- 18.Wheeler MD, Thurman RG. Up-regulation of CD14 in liver caused by acute ethanol involves oxidant-dependent AP-1 pathway. J Biol Chem. 2003;278:8435–8441. doi: 10.1074/jbc.M212076200. [DOI] [PubMed] [Google Scholar]
- 19.Korourian S, Hakkak R, Ronis MJJ, Shelnutt SR, Waldran J, Ingelman-Sundberg M, Badger TM. Diet and risk of ethanol-induced hepatotoxicity: carbohydrate-fat relationships in rats. Toxicol Sci. 1999;47:110–117. doi: 10.1093/toxsci/47.1.110. [DOI] [PubMed] [Google Scholar]
- 20.Ronis MJJ, Korourian S, Zipperman M, Hakkak R, Badger TM. Dietary saturated fat reduces alcoholic hepatotoxicity in rats by altering fatty acid metabolism and membrane composition. J Nutr. 2004;134:904–912. doi: 10.1093/jn/134.4.904. [DOI] [PubMed] [Google Scholar]
- 21.Ronis MJJ, Hakkak R, Korourian S, Albano E, Yoon S, Ingelman-Sundberg M, Lindros KO, Badger TM. Alcoholic liver disease in rats fed ethanol as part of oral or intragastric low-carbohydrate diets. Exp Biol Med. 2004;229:351–360. doi: 10.1177/153537020422900410. [DOI] [PubMed] [Google Scholar]
- 22.Ronis MJJ, Korourian S, Yoon S, Ingelman-Sundberg M, Albano E, Lindros KO, Badger TM. Lack of sexual dimorphism in alcohol-induced liver damage (ALD) in rats treated chronically with ethanol-containing low carbohydrate diets: The role of ethanol metabolism and endotoxin. Life Sci. 2004;75:469–483. doi: 10.1016/j.lfs.2004.01.012. [DOI] [PubMed] [Google Scholar]
- 23.Ioannedes C, Hall DE, Mulder DE, Steele CM, Spickett J, Delaforge M, Parke DV. A comparison of the protective effects of N-acetyl cysteine and S-carboxymethylcysteine against paracetamol-induced hepatotoxicity. Toxicology. 1983;28:313–321. doi: 10.1016/0300-483x(83)90005-7. [DOI] [PubMed] [Google Scholar]
- 24.Buckley NA, Whyte IM, O’Connell DL, Dawson AH. Oral or intravenous N-acetylcysteine: which is the treatment of choice for acetaminophen (paracetamol) poisoning? J Toxicol. 1999;37:759–767. doi: 10.1081/clt-100102453. [DOI] [PubMed] [Google Scholar]
- 25.Lieber CS. Role of oxidative stress and antioxidant therapy in alcoholic and nonalcoholic liver diseases. Adv Pharmacol. 1997;38:601–628. doi: 10.1016/s1054-3589(08)61001-7. [DOI] [PubMed] [Google Scholar]
- 26.Badger TM, Ronis MJJ, Lumpkin CK, Jr, Valentine CK, Shahare M, Irby D, Huang J, Mercado C, Thomas PE, Ingelman-Sundberg M, Crouch J. Effects of chronic ethanol on growth hormone secretion and hepatic P450 isozymes of the rat. J Pharmacol Exp Ther. 1993;264:438–447. [PubMed] [Google Scholar]
- 27.Ronis MJJ, Crouch J, Mercado C, Irby D, Valentine CR, Lumpkin CK, Jr, Ingelman-Sundberg M, Badger TM. Cytochrome P450 CYP 2E1 Induction during chronic alcohol exposure occurs by a two step mechanism associated with blood alcohol concentrations in rats. J Pharmacol Exp Ther. 1993;264:944–950. [PubMed] [Google Scholar]
- 28.Johansson I, Ingelman-Sundberg M. Carbon tetrachloride-induced lipid peroxidation dependent on an ethanol-inducible form of rabbit liver microsomal cytochrome P450. FEBS Lett. 1985;183:2467–2471. doi: 10.1016/0014-5793(85)80790-0. [DOI] [PubMed] [Google Scholar]
- 29.Cao G, Prior RL. Measurement of oxygen radical absorbance capacity in biological samples. Methods Enzymol. 1992;99:50–62. doi: 10.1016/s0076-6879(99)99008-0. [DOI] [PubMed] [Google Scholar]
- 30.Prior RL, Hoang H, Gu L, Wu X, Bacchiocca M, Howard L, Hampsch-Woodill M, Huang D, Ou B, Jacob R. Assays for hydrophilic and lipophilic antioxidant capacity (oxygen radical absorbance capacity (ORACFL)) of plasma and other biological and food samples. J Agric Food Chem. 2003;51:3273–3279. doi: 10.1021/jf0262256. [DOI] [PubMed] [Google Scholar]
- 31.Sampey BP, Korourian S, Ronis MJJ, Badger TM, Petersen DR. Immunohistochemical characterization of hepatic malondialdehyde and 4-hydroxynonenal modified proteins during early stages of ethanol-induced liver injury. Alcohol Clin Exp Res. 2003;27:1015–1022. doi: 10.1097/01.ALC.0000071928.16732.26. [DOI] [PMC free article] [PubMed] [Google Scholar]
- 32.Mottaran E, Stewart SF, Rolla R, Vay D, Cipriani V, Moretti MG, Vidali M, Sartori M, Rigamonti C, Day CP, Albano E. Lipid peroxidation contributes to immune reactions associated with alcoholic liver disease. Free Radic Biol Med. 2002;32:38–45. doi: 10.1016/s0891-5849(01)00757-2. [DOI] [PubMed] [Google Scholar]
- 33.Shankar K, Hidestrand M, Yarberri B, Xiao R, Simmen FA, Badger TM, Ronis MJJ. Microarray-based analysis of nutrition ethanol interactions during gestation. The Toxicologist. 2005;84:57. [Google Scholar]
- 34.Badger TM, Crouch J, Irby D, Hakkak R, Shahare M. Episodic excretion of ethanol during chronic intragastric ethanol infusion in rats. J Pharmacol Exp Ther. 1993;264:938–943. [PubMed] [Google Scholar]
- 35.Fang W-H, Yao Y-M, Shi Z-G, Yu Y, Wu Y, Lu L-R, Sheng Z-Y. Effect of recombinant bactericidal/permeability-increasing protein on endotoxin translocation and lipopolysaccharide-binding protein/CD14 expression in rats after thermal injury. Crit Care Med. 2001;29:1452–1459. doi: 10.1097/00003246-200107000-00025. [DOI] [PubMed] [Google Scholar]
- 36.Enomoto N, Yamashina S, Schemmer P, Rivera CA, Bradford BU, Enomoto A, Brenner DA, Thurman RG. Estriol sensitizes rat Kupffer cells via gut-derived endotoxin. Am J Physiol. 1999;277:G671–G677. doi: 10.1152/ajpgi.1999.277.3.G671. [DOI] [PubMed] [Google Scholar]
- 37.Kono H, Rusyn I, Yin M, Gabele E, Yamashina S, Dikalova A, Kadiska MB, Connor HD, Mason RP, Segal BH, Bradford BU, Holland SM, Thurman RG. NADPH oxidase-derived free radicals are key oxidants in alcohol-induced liver disease. J Clin Invest. 2000;106:867–872. doi: 10.1172/JCI9020. [DOI] [PMC free article] [PubMed] [Google Scholar]
- 38.Ronis MJJ, Lindros KO, Ingelman-Sundberg M. The CYP2E1 subfamily. In: Ioannides C, editor. Cytochromes P450: metabolic and toxicological aspects. Boca Raton, FL: CRC Press; 2002. pp. 211–239. [Google Scholar]
- 39.Caro AA, Cederbaum AI. Oxidative stress, toxicology and pharmacology of CYP2E1. Annu Rev Pharmacol Toxicol. 2004;44:27–42. doi: 10.1146/annurev.pharmtox.44.101802.121704. [DOI] [PubMed] [Google Scholar]
- 40.Morimoto M, Hagbjork A-L, Wan YJ, Fu PC, Clot P, Albano E, Ingelman-Sundberg M, French SW. Modulation of experimental alcohol-induced liver disease by cytochrome P450 2E1 inhibitors. Hepatology. 1995;21:1610–1617. [PubMed] [Google Scholar]
- 41.Fang C, Lindros KO, Badger TM, Ronis MJJ, Ingelman-Sundberg M. Zonated expression of cytokines in rat liver. Effect of chronic ethanol and the cytochrome P450 2E1 inhibitor chlorme-thiazole. Hepatology. 1998;27:1304–1310. doi: 10.1002/hep.510270516. [DOI] [PubMed] [Google Scholar]
- 42.Poli G. Pathogenesis of liver fibrosis: role of oxidative stress. Mol Aspects Med. 2000;21:49–98. doi: 10.1016/s0098-2997(00)00004-2. [DOI] [PubMed] [Google Scholar]
- 43.Nanji AA, Zhao S, Sadrzaheh SMH, Waxman DJ. Markedly enhanced P450 2E1 induction and lipid peroxidation is associated with severe liver in fish-oil-ethanol-fed rats. Alcohol Clin Exp Res. 1994;18:1280–1285. doi: 10.1111/j.1530-0277.1994.tb00119.x. [DOI] [PubMed] [Google Scholar]
- 44.Nanji AA, Jokelainen K, Tipoe GL, Rehemtulla A, Dannenberg AJ. Dietary saturated fatty acids reverse inflammatory changes in rat liver despite continued ethanol administration. J Pharmacol Exp Ther. 2001;299:638–644. [PubMed] [Google Scholar]
- 45.Schauer RJ, Zollner H, Esterbauer H. Biological effects of aldehydes with particular attention to 4-hydroxynonenal and malondialdehyde. In: Vigo-Pelfrey C, editor. Membrane Lipid Peroxidation. Vol. 3. CRC Press; Boca Raton, FL: 1990. pp. 141–163. [Google Scholar]
- 46.Poli G, Schauer RJ. 4-Hydroxynonenal in the pathomehanisms of oxidative stress. IUBMB Life. 2000;50:315–321. doi: 10.1080/713803726. [DOI] [PubMed] [Google Scholar]
- 47.Okada K, Wangpoengtrakul C, Osawa T, Toyokuni S, Tanaka K, Uchida K. 4-Hydroxy-2-nonenal-mediated impairment of intracellular proteolysis during oxidative stress: indentification of proteosomes as target molecules. J Biol Chem. 1999;274:23787–23793. doi: 10.1074/jbc.274.34.23787. [DOI] [PubMed] [Google Scholar]
- 48.Nagy LE. Molecular aspects of alcohol metabolism: Transcription factors involved in early ethanol-induced liver injury. Annu Rev Nutr. 2004;24:55–678. doi: 10.1146/annurev.nutr.24.012003.132258. [DOI] [PubMed] [Google Scholar]
- 49.Stoyanovsky DA, Wu D, Cederbaum AI. Interaction of 1-hydroxyethyl radical with glutathione, ascorbic acid and alphatocopherol. Free Radic Biol Med. 1998;24:132–138. doi: 10.1016/s0891-5849(97)00205-0. [DOI] [PubMed] [Google Scholar]
- 50.Dufour DR, Lott JA, Nolte FS, Gretch DR, Koff RS, Seef LB. Diagnosis and monitoring of hepatic injury: II. Recommendations for use of laboratory tests in screening diagnosis and monitoring. Clin Chem. 2000;46:2050–2068. doi: 10.1093/clinchem/46.12.2050. [DOI] [PMC free article] [PubMed] [Google Scholar]
- 51.Yin M, Wheeler MD, Kono H, Bradford BU, Gallucci RM, Luster MI, Thurman RG. Essential role of tumor necrosis factor α in alcohol-induced liver injury. Gastroenterology. 1999;117:942–952. doi: 10.1016/s0016-5085(99)70354-9. [DOI] [PubMed] [Google Scholar]
- 52.Zhou Z, Wang L, Song Z, Lambert JC, McClain CJ, Kang YJ. A critical involvement of oxidative stress in acute alcohol-induced hepatic TNFα production. Am J Pathol. 2003;163:1137–1146. doi: 10.1016/s0002-9440(10)63473-6. [DOI] [PMC free article] [PubMed] [Google Scholar]
- 53.McClain CJ, Barve S, Deaciuc I, Kugelmas M, Hill D. Tumor necrosis factor and alcoholic liver disease. Semin Liver Dis. 1999;19:205–219. doi: 10.1055/s-2007-1007110. [DOI] [PubMed] [Google Scholar]
- 54.Ji C, Deng Q, Kaplowitz N. Role of TNFα in ethanol-induced hyperhomocysteinemia and murine alcoholic liver injury. Hepatology. 2004;40:442–451. doi: 10.1002/hep.20309. [DOI] [PubMed] [Google Scholar]
- 55.Sadrzadeh SMH, Nanji AA. The 21-aminosterolid 16-desmethyl-tirilazad mesylate prevents necroinflammatory changes in experimental alcoholic liver disease. J Pharmacol Exp Ther. 1998;284:406–412. [PubMed] [Google Scholar]
- 56.Stewart SF, Vidali M, Day CP, Albano E, Jones DEJ. Oxidative stress as a trigger for cellular immune response in patients with alcoholic liver disease. Hepatology. 2004;39:197–203. doi: 10.1002/hep.20021. [DOI] [PubMed] [Google Scholar]
- 57.Clot P, Parola M, Bellomo G, Dianzani U, Carini R, Tabone M, Aricò S, Ingelman-Sundberg M, Albano E. Plasma membrane hydroxyethyl radical adducts cause antibody-dependent cytotoxicity in rat hepatocytes exposed to alcohol. Gastroenterology. 1997;113:265–276. doi: 10.1016/s0016-5085(97)70104-5. [DOI] [PubMed] [Google Scholar]