

Abstract
Autosomal dominant polycystic kidney disease (ADPKD) is a highly prevalent genetic disease that results in cyst formation in kidney and liver. Cytokines and growth factors secreted by the cyst lining epithelia are positioned to initiate autocrine/paracrine signaling and promote cyst growth. Comparative analyses of human kidney and liver cyst fluids revealed disparate cytokine/growth factor profiles. CXCR2 agonists, including interleukin-8 (IL-8), epithelial neutrophil activating peptide (ENA78), growth related oncogne alpha (GROα), are potent proliferative agents that were found at high levels in liver but not kidney cyst fluids. Liver cysts are lined by epithelial cells derived from the intrahepatic bile duct (i.e. cholangiocytes). In polarized pkd2(WS25/−) mouse liver cyst epithelial monolayers, CXCR2 agonists were released both apically and basally, indicating they may act both on the endothelial and epithelial cells within or lining the cyst wall. IL-8 and human liver cyst fluid induced cell proliferation of HMEC-1 cells, a human microvascular endothelial cell line, and Mz-ChA1 cells, a human cholangiocyte cell model. IL-8 expression can be regulated by specific stresses. Hypoxia and mechanical stretch, two likely stressors acting on the liver cyst epithelia, significantly increased IL-8 secretion and promoter activity. AP-1, c/EBP and NFκB were required but not sufficient to drive the stress-induced increase in IL-8 transcription. An upstream element between −272 and −1,481 bp allowed for the stress-induced increase in IL-8 transcription. These studies support the hypothesis that CXCR2 signaling promotes ADPKD liver cyst growth.
Keywords: Animals; Cell Hypoxia; Cell Line; Cell Line, Tumor; Cell Polarity; Cell Proliferation; drug effects; Cell Shape; Cells, Cultured; Chemokine CXCL1; metabolism; Chemokine CXCL5; metabolism; Cyst Fluid; metabolism; Cysts; metabolism; pathology; Endothelial Cells; metabolism; pathology; Epithelial Cells; metabolism; pathology; Humans; Interleukin-8; genetics; metabolism; pharmacology; Kidney; metabolism; pathology; Liver; drug effects; metabolism; pathology; Liver Diseases; etiology; metabolism; pathology; Mice; Mice, Inbred C57BL; Mice, Knockout; Polycystic Kidney, Autosomal Dominant; complications; metabolism; pathology; Polymorphism, Single Nucleotide; Promoter Regions, Genetic; Receptors, Interleukin-8B; agonists; metabolism; Signal Transduction; Stress, Mechanical; TRPP Cation Channels; metabolism; Transcription, Genetic; Transfection
Keywords: interleukin-8, cholangiocytes, endothelium, cytokines, growth factors
INTRODUCTION
Autosomal dominant polycystic kidney disease (ADPKD) is a highly prevalent genetic disease, occurring in 1 in 800 individuals. The most prominent clinical feature of ADPKD is the development of numerous, fluid-filled cysts within the kidneys and liver. The clinical features of ADPKD generally emerge after the third decade of life and account for ~5% of all end-stage renal disease in the United States (39). ADPKD liver cysts occur in 94% of 35–46 year old ADPKD subjects (6), can grow to over five times the size of a normal liver (42) and account for up to 10% of ADPKD morbidity and mortality. The clinical complications from the liver cysts arise from the compression of adjacent tissues, organs and vessels by the enlarged livers. Inhibition of cyst growth is predicted to ameliorate the clinical presentation of ADPKD liver cyst disease.
While cystogenesis is clearly linked to the PKD1 or PKD2 mutations, the growth of liver cysts is impacted by extragenetic factors (39). It is hypothesized that autocrine/paracrine signaling by factors secreted by the cyst lining epithelial cells controls the growth rate of kidney and liver cysts. A number of studies have implicated or demonstrated the presence of cytokines and growth factors in kidney cyst fluids. Likewise, cytokine array analysis documented the presence of a number of specific cytokines and growth factors within human liver cyst fluid. The present study directly compared and contrasted the cytokine/growth factor profiles in liver and kidney cyst fluids and found the profiles were markedly different. Among the factors that were specifically elevated within human liver cyst fluids were agonists for CXCR2 receptors, including IL-8, ENA78 and GROα. CXCR2 agonists were of specific interest since they cannot only attract inflammatory cells into diseased tissues (28) but can also promote angiogenesis in the absence of preceding inflammation (1) and induce proliferation of epithelial cells (44). Angiogenesis and proliferation of the cyst-lining epithelial cells are considered essential elements for cyst growth. Consequently, the present studies evaluated the potential for CXCR2 agonists within liver cyst fluid to directly promote the proliferation of both endothelial and epithelial cells.
Finally, the expression of cytokines and growth factors, including IL-8, is generally low under basal conditions and increased in response to specific stresses experienced by cells. Hypoxia and cell stretching are two stressors that are likely to be imposed onto the liver cyst epithelial cells. The lining epithelial cells in human ADPKD liver cyst wall display morphologic features of ischemia (10, 30) and ischemia induces the expression of a number of cytokines and growth factors, including IL-8 (36). In vivo human studies show ADPKD liver cyst-lining epithelial cells retain a strong, regulated secretory capacity that increases intralumenal cyst pressure and, by inference, increase cell stretching (12). In pulmonary epithelial cells, cell stretching induced an increase in IL-8 (41). Further, secretion-induced stretching of epithelial cysts in three dimensional matrices increased the rate of cell proliferation (38). Consequently, the impact of hypoxia and cell stretching on IL-8 expression was evaluated. In total, the present in vitro studies demostrate the potential for CXCR2 agonists to contribute to the in vivo growth of ADPKD liver cysts and highlights the CXCR2 signaling pathway as a potential therapeutic target for the treatment of ADPKD liver cyst disease.
MATERIALS AND METHODS
Reagents
Unless otherwise noted, all cell culture media and reagents were purchased from Gibco-Invitrogen (Grand Island, NY). Fetal Bovine Serum (FBS) was purchased from Hyclone-QB Perbio (Logan, UT). All tissue culture plastic materials were purchased from Beckton Dickinson (Lincoln Park, NJ). Mouse monoclonal anti-PCNA antibody was purchased from BD-Pharmingen (San Jose, CA) and anti-human actin was from Sigma Chemicals (St. Louis, MO). SB225002 (CXCR2 inhibitor) was purchased from Calbiochem (La Jolla, CA).
ADPKD liver and kidney cyst fluids
The collection of all fluids and tissues from human patients was done in accordance with a protocol reviewed and approved by the Colorado Multiple Institution Review Board. All patients were fully informed and consented to participate in these studies. Fluids from liver and kidney cysts were obtained by laparoscopic fenestration procedures and needle aspiration. Fluids from 7 to 20 individual cysts per liver were collected from 10 patients; fluids from 3 to 18 individual cysts per kidney were collected from 11 patients. In some cases cyst fluids from the same patient were pooled. All cyst fluid samples were stored at −80°C until assayed. Removal of information that would permit identification of the donor of the cyst fluid samples has disallowed the demographic data on the liver and kidney cyst fluids to be compared and contrasted.
Pkd2(WS25/−) mice
C57BL/6 pkd2(WS25/−) mice were developed by Stefan Somlo (Yale University) and pkd2(+/−) and pkd2(WS25/+) breeding pairs were provided for this project. Pkd2(WS25/−) mice closely model the human condition by having one copy of pkd2 knocked out and having a second, recombinant-sensitive allele (i.e. WS25) that undergoes high rates of recombination to yield knock outs of the second copy of the gene in somatic cells during the life span of the animals. By four months of age, all pkd2(WS25/−) mice develop discernible kidney and liver cysts (45). Over the subsequent four to eight months, these cysts grow and emerge from the tissues. Mice were genotyped by Southern blotting as previously reported (4).
Cell culture protocols
Three different cell culture models were employed in these studies. Primary cultures of pkd2(WS25/−) mouse liver cyst epithelial cells were used to evaluate the polarity of cytokine release. HMEC-1 cells, a human microvascular endothelial cell line (2), were used to model the proliferative responses of liver cyst wall endothelial cells. Mz-ChA1 cells, a human cholangiocarcinoma cell line, were used to model the ‘cystic’ cholangiocytes that line the liver cyst wall.
pkd2(WS25/−) liver cyst epithelial cells
Liver cyst epithelial cells were isolated from pkd2(WS25/−) mice as previously described (11). Briefly, liver cyst wall tissue was finely minced, suspended in Growth Media (DMEM-F12; 5% fetal bovine serum (FBS; Hyclone; Logan, UT), 2 mM glutamine, 1% non-essential amino acids, 1% lipid concentrate, 1% vitamin solution, 393 ng/ml dexamethasone (Sigma; St. Louis, MO), 25 ng/ml epidermal growth factor (Upstate Biologics, Lake Placid, NY), 30 μg/ml bovine pituitary extract (Upstate Biologics, Lake Placid, NY), 3.4 μg/ml triiodothyrodine, 1% insulin-transferrin-Se, 0.4 μg/ml forskolin (Sigma; St. Louis, MO), 50 μg/ml soybean trypsin inhibitor; pH 7.5), placed above a 2 mm slab of rat tail collagen and the epithelial cells allowed to grow out onto the slab. Cells were passaged by digesting the collagen slab (1 mg/ml collagenase (Sigma; St. Louis, MO), 2 mg/ml dispase; 60 min at 37 °C), disrupting the monolayer into small epithelial ‘islands’ and reseeding with these ‘islands’ onto fresh collage slabs. Cells were maintained at 37°C under a humidified atmosphere with 5% CO2.
HMEC-1 cells
Human HMEC-1 cells (a kind gift from Dr. Sean Colgan, UCDHSC) were cultured in MCDB-131 (Invitrogen) supplemented with 10% FBS, L-glutamine, 10ng/ml epidermal growth factor (EGF; Upstate Biotechnology; Lake Placid, NY), and 1ug/ml hydrocortisone (Sigma; St. Louis, MO). Cells were harvested with 0.25 % trypsin-EDTA and passaged once a week. Cells were maintained at 37 °C under a humidified atmosphere with 5% CO2.
Mz-ChA1 cells
Human Mz-ChA1 cells were cultured in CMRL Medium-1066 supplemented with 2 mM L-glutamine, 100U/ml penicillin, 100μg/ml streptomycin and 10% FBS. Cells were harvested with 0.25% trypsin-EDTA and passaged once a week. Cells were maintained at 37 °C under a humidified atmosphere with 5% CO2.
Cytokine array and specific ELISA analysis
The comparative presence of a 120 distinct cytokines and growth factors in human liver and kidney cyst fluids was evaluated by cytokine array analysis, as described by the manufacturer (Transignal Mouse Cytokine Antibody Arrays, RayBio, Redwood City, CA). Briefly, 1.5 ml human cyst fluid was incubated with Human Cytokine Antibody Arrays VI and VII supports, the captured factors labeled with a biotinylated antibody cocktail and detected by chemiluminescence using an UVP Photodocumentation System (Upland, CA). Densitometry of each signal was quantified using NIH Image software; values were normalized to internal controls present on each blot. The pattern of growth factors and cytokines that accumulated in mouse liver cyst fluids or were secreted in culture by pkd2(WS25/−) liver cyst epithelial cells was similarly evaluated using the mouse cytokine array 2 (RayBio; Redwood City, CA). Quantitation of human IL-8 and EGF and mouse KC was performed by ELISA, as described by the manufacturers (R&D biosystems; Minneapolis, MN and ElisaTech, Aurora, CO). Absorbance (405 nm) was measured using a microplate reader (Dynatech Laboratories; Chantilly, VA) and cytokine levels were correlated to internal standards included in each plate.
Cell proliferation assays
The proliferation rates of the human cell culture models were measured by Alamar Blue assay, as described by the manufacturer (Biosource/Invitrogen; Carlsbad, CA). Briefly, cells were seeded at subconfluent density into 6-well plates, allowed to attach overnight in their respective growth media. Cells were then incubated for 24 hours in serum-free media. Cells maintained in serum free media served as a baseline (0%) control and media containing 10% fetal bovine serum (Hyclone; Logan, UT) served as a positive (100%) control. In experimental groups, cells grown in serum-free media were treated with experimental agents for 24 hours and the comparative levels of proliferation measured. These agents included 0.01 to 1,000 ng/ml recombinant human IL-8 (R&D Biosystems), 10% human liver cyst fluid or 10% human renal cyst fluid. Subsequently, serum-free media containing 10% Alamar Blue was added to the cells for 2 hours, the media evaluated for absorbance at 540 nm and 600 nm and the reduction of Alamar Blue calculated. The proliferative effect of liver cyst fluid was also confirmed by Western blotting for PCNA (BD-Pharmingen; Palo Alto, CA) and actin (Sigma; St. Louis, MO) with actin serving as a loading control. Cell proteins were solubilized in 5xPAGE buffer (5% sodium dodecyl sulfate, 25% sucrose, 50mM Tris, 5mM ethylenediamine tetraacetic acid, 0.2% dithiothreitol, complete protease inhibitor II Amersham, pH 8.0). The proteins were separated by gel electrophoresis, transferred onto nitrocellulose and probed by Western blotting. PCNA and actin bands were capatured digitally using a UVP Photodocumentation System (Upland, CA). Densitometric analysis was performed using NIH Image.
Modeling of cellular stressors
Evidence indicates liver cyst epithelial cells experience both hypoxic conditions and undergo cell stretching. To model the effect of these stressors on IL-8 production, Mz-ChA1 cells were subjected to either hypoxia or cell stretching and IL-8 secretion and IL-8 promoter activity were measured. In IL-8 promoter activity studies, cells were first co-transfected with IL-8-luciferase chimeric and renilla-luciferase constructs. The effects of epithelial cell stretching was performed by mechanical deformation of cells on 6-well silicone elastomer-bottom culture plates using a Flexercel Stress Unit (Flexcell Corp., McKeesport, PA). Mz-ChA1 cells (2×10⁵ cells/well in a 6-well plate) were seeded onto the elastomer plates, allowed to attach overnight and then subjected to a stretching protocol. This protocol subjected cells to specific elongation over a 25 hour time period. This included 5%, 7.5%, 10%, 15% to 20% stretch with each increasing step taken after 5 hours. The cells experienced stretching at 20 cyles/minute. Previously shown to induce hypoxic gene response (15, 19), cellular hypoxia was achieved by incubation of cells (1×10⁵/well in 12 well plates) in a 1% O2 and 5% CO2 environment for 8 hrs. Following the experimental period, the media was collected and IL-8 secretion was measured by ELISA (see above). Cell proliferation was measured by Alamar Blue assay (see above). IL-8 promoter activity was measured as described below.
IL-8 promoter activity assays
Chimeric constructs of the 5′ region of the IL-8 promoter were previously ligated to a firefly luciferase reporter and used to evaluate IL-8 promoter activity (14). The constructs included a full length construct (−1,482 b.p. to +44 b.p.), a series of 5′ truncations (−272/+44, −98/+44, −50/+44) and an empty vector control (EVC). In addition, constructs with mutations in the known AP-1, c/EBP and NF-κB sites that disrupt binding were employed (14). Finally, a single base (A/T) substitution in the -251 bp was generated using Quick Change Mutagenesis Kit, as directed by the manufacturer (Clontech, Palo Alto, CA). Plasmids were transfected into Mz-ChA1 cells using Lipofectamine 2000 (Life Technologies/Invitrogen; Gaithersburg, MD), as directed by the manufacturer. As a control for transfection efficiency, a plasmid containing a renilla luciferase reporter gene under the TK promoter was co-transfected into the cells (5). Following transfection, cells were seeded either in 12 well plates at 1×10⁵ cells/well for hypoxia experiments or in collagen-coated, elastomer-based 6 well plates at 2×10⁵ cells/well for stretch experiments. After 18–24 h, media was changed to serum-free media and cells were incubated for an additional 24 hrs. Subsequently, cells were subjected to stress as indicated and cell extracts were then prepared in 500 μl of Luciferase Passive Lysis Buffer (Promega; Madison, WI). Both firefly and renilla luciferase activities were assayed in 60 μl lysate aliquots using the Dual Luciferase Kit (Promega; Madison, WI) and detected in a 96 well-plate luminometer (Luminoskan Ascent, Thermo Electron Corporation; Franklin, MA). Firefly luciferase was normalized to renilla luciferase activity in each group.
Statistical analysis
All statistics were evaluated by GraphPad Instat (San Diego, CA) analysis software. In studies comparing two groups, the data was analyzed either by Student t-test of unpaired samples (Figure 2; Table I) or of paired samples (Figure 6). p<0.05 was considered statistically significant. In studies comparing groups of three or more samples (Figures 4, 5, 7, 8 and 9), the means were subjected to an analysis of variance. A Tukey multiple comparisons test was performed to identify which groups were significantly different (p<0.05). In the presentation of the analysis of variance, groups or bars without a shared letter are significantly different from each other.
Figure 2. Human liver cyst fluids have elevated levels of CXCR2 ligands.
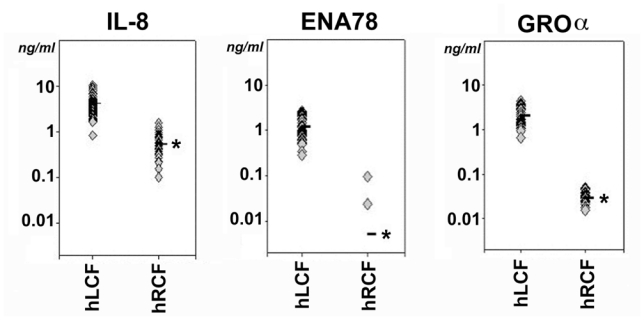
ELISA analyses found concentrations of CXCR2 chemokines were significantly higher in human liver cyst fluids (hLCF) than human renal cyst fluids (hRCF). The analysis specifically included IL-8 (left panel), ENA78 (middle panel) and GROα (right panel). Individual values are represented with diamonds and the means are represented with the bar. (*p<0.05 in liver versus kidney samples).
Table I.
Densitometric analysis of cytokines detected in liver and kidney cyst fluids.
| Construct | Liver Cysts | Kidney Cysts |
|---|---|---|
| n=5 | n=6 | |
| IL-8 | 0.56 ± 0.21 | 0.12 ± 0.10a |
| ENA78 | 0.08 ± 0.01 | 0.00 ± 0.00a |
| GRO | 0.04 ± 0.01 | 0.00 ± 0.00a |
| VEGF | 0.06 ± 0.01 | 0.00 ± 0.00a |
| Angiogenin | 0.53 ± 0.06 | 0.65 ± 0.22 |
| IL-6 | 0.06 ± 0.03 | 0.04 ± 0.04 |
| HGF | 0.34 ± 0.34 | 0.20 ± 0.20 |
| EGF | 0.00 ± 0.00 | 0.02 ± 0.02 |
| MCP-1 | 0.35 ± 0.09 | 0.52 ± 0.19 |
| Acrp30 | 0.32 ± 0.01 | 0.87 ± 0.41 |
| Leptin | 0.00 ± 0.00 | 0.61 ± 0.32b |
| MIP-1δ | 0.00 ± 0.00 | 0.61 ± 0.32b |
concentration detected in liver cyst fluids are greater than in kidney cyst fluids (p<0.05)
concentrations detected in liver cyst fluids are less than in kidney cyst fluids (p<0.05)
Figure 6. Hypoxia and cell stretch stimulate IL-8 synthesis by Mz-Cha1 cells.
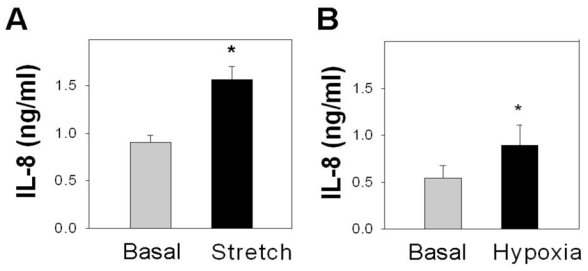
(A) Compared to the release of IL-8 from Mz-ChA1 cells under basal conditions, cells exposed to repetitive stretch cycles for 25 hrs (Stretch) had significantly elevated levels of IL-8. *p <0.05 basal vs stretch (B) Compared to the release of IL-8 from Mz-ChA1 cells under basal conditions, cells cultured under hypoxic conditions for 24 hrs (1% O2; Hypoxia) had a significantly greater release of IL-8. *p<0.05 basal vs hypoxia
Figure 4. IL-8 and liver cyst fluid promote HMEC-1 cell proliferation.
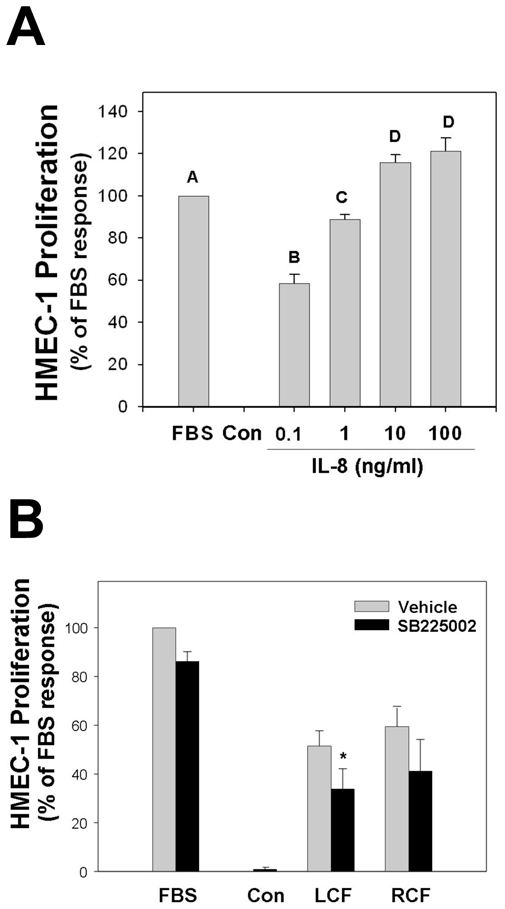
(A) Treatment of HMEC-1 cells with increasing doses of IL-8 for 24 hrs resulted in a significant increase in cell proliferation at 0.1 ng/ml and a maximal response at 100 ng/ml IL-8 when compared to unsupplemented control (Con) cells. From an analysis of variance, bars without a shared letter (e.g. A, B, C, D) are significantly different from each other. (B) Compared to unsupplemented HMEC-1 cells, cells treated with 10% human liver cyst fluid markedly induced cell proliferation. Pretreatment with 50 nM SB225002 inhibited the proliferative response in paired assays (*p<0.05 vehicle vs SB225002). Treatment with 10% human renal cyst fluid also induced HMEC-1 cell proliferation. From four studies, pretreatment with 50 nM SB225002 did not significantly block the proliferative effect of 10% human renal cyst fluid.
Figure 5. IL-8 and liver cyst fluid promote Mz-ChA1 cell proliferation.
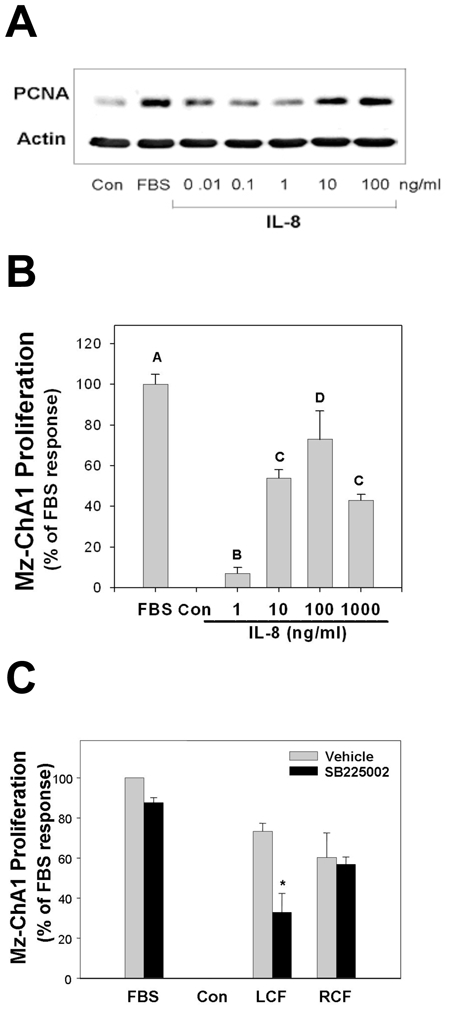
Treatment of Mz-ChA1 cells with IL-8 for 24 hrs induced cell proliferation. (A) Western blot analysis of PCNA showed Mz-ChA1 cells had modest responses with 0.01 to 1.0 ng/ml IL-8 and marked proliferative responses when treated with 10 to 100 ng/ml IL-8. Actin served as a loading control. Blot is representative of three separate experiments. (B) Alamar Blue reduction assays showed a modest proliferative response from 1 ng/ml IL-8 and an apparent maximal response at 100 ng/ml. From an analysis of variance, bars without a shared letter (e.g. A, B, C, D) are significantly different from each other. (C) Stimulation with 10% human liver cyst fluid markedly induced proliferation of unsupplemented Mz-ChA1 cells. This response was significantly inhibited by pretreatment with 50 nM SB225002 (*p <0.05 vehicle vs SB225002). Addition of 10% renal cyst fluid also induced the proliferation of Mz-ChA1 cells. This response, however, was not inhibited by pretreatment with SB225002.
Figure 7. Truncation analysis of stress-responsive regions within the IL-8 promoter.
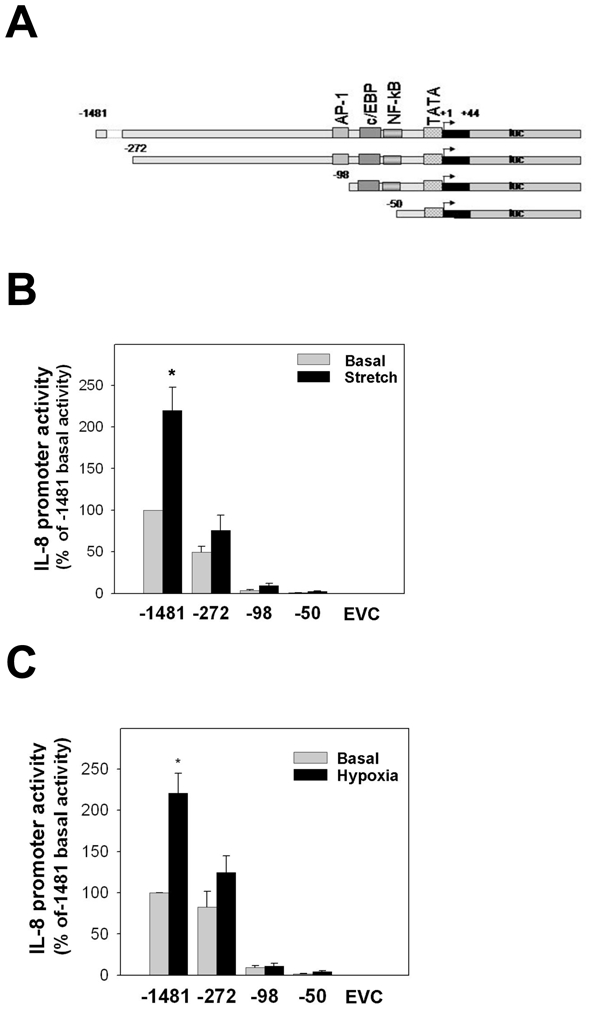
(A) A full length IL-8 promoter (−1,481/+44 base pairs) was truncated to generate −272/+44, −98/+44 and −50/+44 IL-8 promoter constructs. (B) Stretching of Mz-ChA1 cells (n=8) for 25 hours doubled the IL-8 promoter activity when compared to control cells. The −272/+44 truncated promoter showed a modest decrease in the basal promoter activity and a diminished stretch response. The basal and stretch-induced promoter activity in the −98/+44 construct and −50/+44 construct were essentially abolished. (C) Subjecting Mz-ChA1 cells (n=6) to hypoxia (1% O2 for 8 hrs) doubled the IL-8 promoter activity. Under basal conditions, the promoter activity of the −272/+44 construct was unchanged but there was a loss of the hypoxia response. The basal and hypoxia-induced promoter activity in the −98/+44 construct and −50/+44 construct were essentially abolished.
Figure 8. AP-1, c/EBP and NF-κB are required for IL-8 promoter activity.
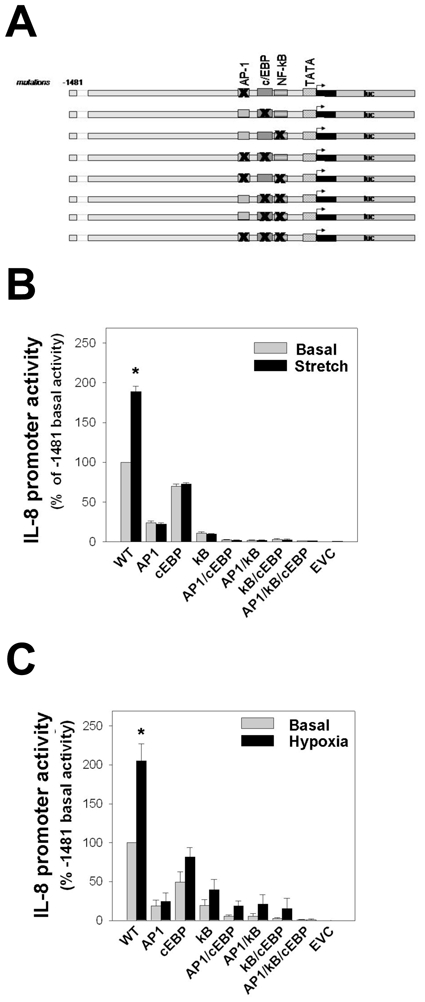
(A) AP-1, c/EBP and NF-κB binding sites were mutated individually, in tandem or in triplicate in the −1,481/+44 promoter. Mutated sites were denoted by X’s in the specific sites. (B) Stretching of Mz-ChA1 cells (n=4) roughly doubled the IL-8 promoter activity. Mutation of the AP-1 or NF-κB sites, individually or in tandem, resulted in a profound loss of promoter activity under both basal and stretched conditions. Mutation of the c/EBP site resulted in a modest decrease in the basal activity and a complete loss of the stretch-induced increase. (C) Subjecting Mz-ChA1 cells (n=4) to hypoxia also induced a doubling in the IL-8 promoter activity. This response to hypoxia was largely lost when the binding sites for AP-1, NF-κB were mutated.
Figure 9. Transcriptional regulation on the -251 A>T SNP of IL-8 gene by stretch.
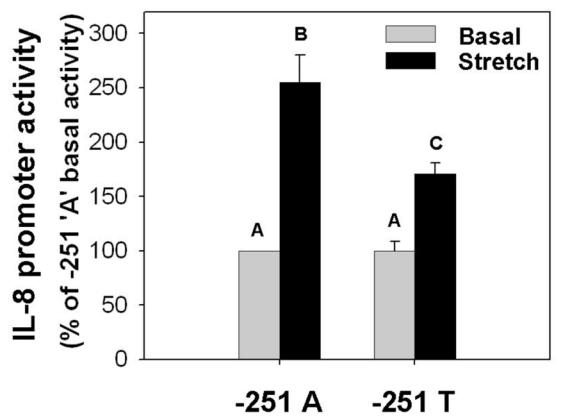
Cell stretching induced a significant increase in the IL-8 promoter activity in Mz-ChA1 cells. When the –251 residue was mutated from A to T, the promoter activity was not different under basal conditions but had a reduced response to cell stretching. From an analysis of variance, bars without a shared letter (e.g. A, B, C) were significantly different (p<0.05).
RESULTS
Liver and kidney cyst fluids contain a distinct profile of cytokines and growth factors
Cytokine array analyses found the profile of cytokines and growth factors in ADPKD liver and kidney cyst fluids were markedly distinct (Figure 1). A densitometric analysis of all the factors detected in the individual arrays for liver (n=5) and kidney (n=6) cyst fluids is presented in Table 1. These values were normalized to the internal control samples included in the arrays. The arrays showed some factors (e.g. angiogenin) were present in both liver and kidney cyst fluids. Hepatocyte growth factor (HGF) was found sporadically, being detected in one of the five liver cyst fluid samples and one of the six kidney cyst fluid samples tested. Other factors were specifically elevated in either kidney cyst fluids or liver cyst fluids. For example, all kidney cyst fluid samples tested contained leptin and macrophage inflammatory protein-1δ but these factors were not observed in any of the liver cyst fluid samples. Conversely, liver cyst fluids had readily detected levels of IL-8 but only two of the kidney cyst fluid samples tested had detectable levels of IL-8 and IL-8 was present at weakly detectable or undetectable levels in the other four samples. While the signals were not as robust as those for IL-8, ENA78 and GRO were also present in liver but not kidney cyst fluids.
Figure 1. Human ADPKD liver and renal cysts have disparate cytokine profiles.
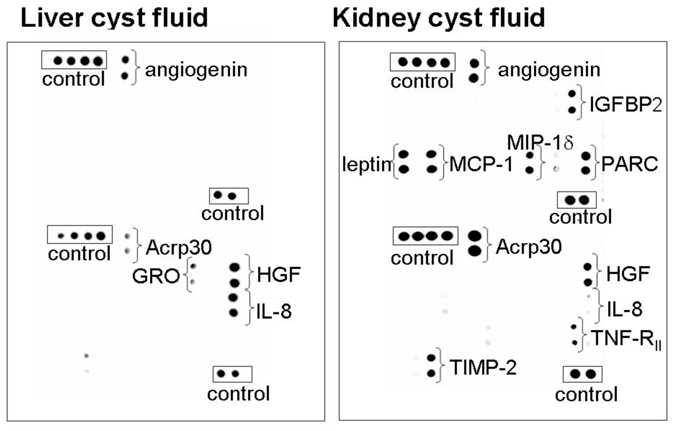
(A) Cytokine arrays established the profile of cytokines and growth factors present in human ADPKD liver (left panel) and kidney (right panel) cyst fluids. Some factors (e.g. angiogenin) were detected in both liver and kidney cyst fluids. Some factors were specifically elevated in either kidney cyst fluids (e.g. leptin, MIP-1δ) or liver cyst fluids (e.g. IL-8). Extended exposures also revealed the presence of ENA78 and GRO in liver cyst fluids. Internal positive controls are shown enclosed in a rectangle. Table I provides a relative densitometric analysis of liver (n=5) versus kidney (n=6) cyst fluid arrays.
IL-8, ENA78 and GROα are each agonists for CXCR2 chemokine receptors, suggesting they may act in a coordinate fashion to impact cyst growth. Consequently, their concentrations in liver and kidney cyst fluids were measured directly by ELISA (Figure 2). The concentration of IL-8 was significantly higher in liver cyst fluids (4.13 ± 0.24 ng/ml; n=67; *p<0.05) than kidney cyst fluids (0.53 ± 0.07 ng/ml; n=30). Similarly, the concentrations of ENA78 (liver: 1.18 ± 0.08 ng/ml, n=53; kidney: 0.05 ± 0.00 ng/ml, n=24) and GROα (liver: 2.10 ± 0.15 ng/ml, n=53; kidney: 0.03 ± 0.00 ng/ml, n=24) were higher in liver cyst fluids. As a comparative control, ELISA analyses of the same cyst fluid samples for EGF found the levels were below detection levels in both liver (0.00 ± 0.00 ng/ml) and kidney (0.01 ± 0.01 ng/ml) samples (data not shown).
CXCR2 agonists are secreted across apical and basolateral membranes
The presence of CXCR2 agonists in liver cyst fluid indicates these factors are secreted across the apical membrane of the cyst lining epithelial cells. This would position these agonists to interact with receptors on the apical membrane of the cyst lining epithelial cells. To determine if factors could also be secreted across the basolateral membrane, where they could interact with receptors on the basolateral membrane of the epithelial cells or with endothelial cells of the cyst wall vasculature, cytokine profiles were evaluated from the apical and basal chambers of pkd2(WS25/−) liver cyst epithelial cells grown to confluence on semi-permeable membrane supports (Figure 3). The transepithelial resistance of these monolayers was greater than 1,000 Ω · cm2, a level that would essentially eliminate paracellular diffusion of factors between domains. Media was collected seventy-two hours following a change of the apical and basal media. Cytokine array analyses found some factors were higher in the apical media versus the basal media (e.g. MIP-1α) and other factors higher in the basal media versus the apical media (e.g. KC, VCAM1, MIP-2). The general pattern, however, indicated that a markedly similar profile of cytokines and growth factors amassed in both the apical and basal media. Quantitative ELISA measurements of KC, a functional analog of human IL-8 and a CXCR2 agonist, confirmed the bipolar release of KC and found KC levels were greater into the basal chamber (2.48 ± 0.26 ng after 72 hr; n=3) versus the apical chamber (1.06 ± 0.04 ng after 72 hr; n=3). These results are consistent with the presence of KC in mouse liver cyst fluid (0.47 ± 0.06 ng/ml, n=49; data not shown) and suggest that CXCR2 agonists are released both into the serosa of the liver cyst wall as well as the liver cyst lumen and are positioned to participate in autocrine/paracrine signaling of the liver cyst lining epithelial cells and vascular endothelial cells.
Figure 3. Polarized secretion of cytokines and growth factors by mouse liver cyst epithelial cells.
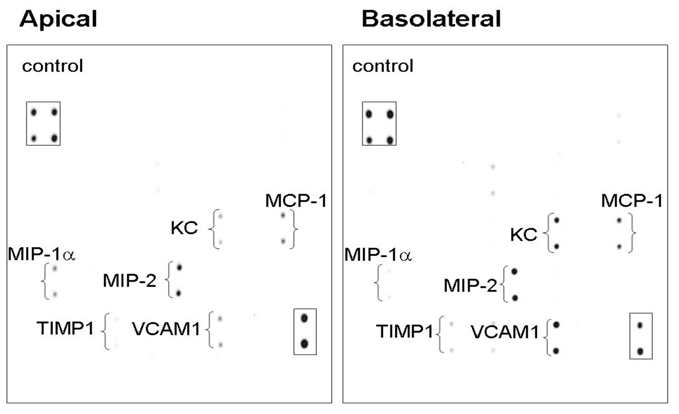
Primary cultures of isolated liver cyst epithelial cells from pkd2(WS25/−) mice grown on semi-permeable supports form high resistance monolayers (Rt>1,000 Ω·cm2). Cytokine array analysis of media collected after 72 hours of incubation showed a parallel pattern of cytokine and growth factor release into both the apical and basal media. Boxes show internal array controls.
IL-8 and human liver cyst fluid promote endothelial cell proliferation
Endothelial cell proliferation is an essential component of angiogenesis. As the liver cyst wall is directed to grow, neovascularization is likely needed in order to support the new growth. The effect of CXCR2 agonists in liver cyst fluids on endothelial cell proliferation was evaluated by treating HMEC-1 cells with either IL-8 or human liver cyst fluids with or without a CXCR2 inhibitor (Figure 4). Treatment with increasing doses of IL-8 for 24 hrs significantly enhanced the rate of proliferation of HMEC-1 cells (Figure 4A). HMEC-1 cells had a significant proliferative response when treated with 0.1 ng/ml IL-8 (58 ± 4 % of the 10% FBS response; n=3) and a peak response with 100 ng/ml IL-8 (121 ± 6% of the 10% FBS response, n=3).
Subsequently, the effect of CXCR2 signaling from constituents within human liver cyst fluid was tested (Figure 4B). Treatment of HMEC-1 cells with 10% of human liver cyst fluid induced a significant proliferative response (52 ± 6% of the 10% FBS response; n=4). The contribution of CXCR2 signaling to the responses to liver cyst fluid was evaluated by pre-treating paired HMEC-1 cells with 50 nM SB225002, a specific CXCR2 inhibitor. SB225002 blunted the proliferative response of HMEC-1 cells to human liver cyst fluid (34 ± 8% of 10% FBS response, n=4; *p<0.05), indicating part of the proliferative response to liver cyst fluid was due to CXCR2 signaling. Higher concentrations of SB225002 (e.g. 500 nM) resulted in greater inhibition of proliferation but concerns about non-specific effects begin to arise at these concentrations (data not shown). These results are consistent with the levels of CXCR2 agonists found in liver cyst fluid and support the hypothesis that CXCR2 signaling contributes to the development and maintenance of the vasculature within human liver cyst walls.
Interestingly, treatment of HMEC-1 cells with 10% kidney cyst fluid also induced cell proliferation (59 ± 8% of the 10% FBS response, n=4). This indicates pro-growth factors are also present in kidney cyst fluids. Paired samples pre-treated with SB225002 prior to exposure to kidney cyst fluid showed a rate of proliferation that was 41 ± 13% of the 10% FBS response (n=4). An analysis of variance failed to show this level was significantly different from cells receiving kidney cyst fluid alone. Given the modest number of study repetitions, however, it cannot be ruled out that a more variable but significant effect of SB225002 on proliferation induced by kidney cyst fluids is occurring. Such an effect would be in line with the lower and more variable levels of CXCR2 agonists present in kidney cyst fluids.
IL-8 and human liver cyst fluid promote epithelial cell proliferation
In a similar vein, it was important to determine if IL-8 and CXCR2 signaling could promote the proliferation of liver cyst epithelial cells. In the absence of a primary human liver cyst cell line, Mz-ChA1 cells, a cell culture model of human cholangiocytes, was used to approximate the proliferative responses of ‘cystic’ cholangiocytes. Importantly, CXCR2 is expressed at the apical domain of both normal and ‘cystic’ cholangiocytes (30) and is expressed in Mz-ChA1 cells (data not shown). The proliferative responses to IL-8 were measured qualitatively using PCNA expression (Figure 5A) and quantitatively using Alamar Blue reduction assay (Figure 5B). Elevated PCNA expression was observed in cells treated with 10 ng/ml or more of IL-8. Similarly, Alamar Blue reduction showed a small but significant proliferative response to 1 ng/ml IL-8 (7 ± 3 % of 10% FBS response; n=4) and robust proliferative responses to IL-8 concentrations at or above 10 ng/ml IL-8 (10 ng/ml: 54 ± 4 % of 10% FBS response, n=4; 100 ng/ml IL-8: 73 ± 16% 10% FBS response; n=4). The proliferative response to 100 ng/ml IL-8 was completely inhibited in paired samples pre-treated with 50 nM SB225002 (n=4; data not shown).
The capacity of CXCR2 agonists within human liver cyst fluids to promote cell proliferation was measured in Mz-ChA1 cholangiocytes (Figure 5C). Treatment of Mz-ChA1 cells with 10% human liver cyst fluid induced a significant proliferative response (72 ± 4% of 10% FBS response; n=5). Inhibition of CXCR2 signaling with 50 nM SB225002 significantly reduced this proliferation response (32 ± 16% of 10% FBS response, n=4). Analysis of PCNA expression confirmed these observations with 10% human liver cyst fluid inducing a potent increase in the PCNA:actin ratio while normal human bile, a negative control, failed to induce cell proliferation (data not shown). As with the endothelial cells, the incomplete inhibition of proliferation by SB225002 suggests that other factors present within the liver cyst fluids also contribute to the proliferative response by these cells. Treatment with 10% kidney cyst fluid also induced Mz-ChA1 cell proliferation (60 ± 14% of FBS response, n=6). This proliferative response, however, was not inhibited by pre-treatment with SB225002 (59 ± 4% of 10% FBS response, n=4).
Hypoxia and cell stretch stimulates IL-8 synthesis by cyst epithelia
The expression of most cytokines and growth factors is moderated by external cues or ‘stresses’ placed on the cells. Evidence indicates that the ADPKD liver cyst epithelium is subjected to cell stretching (11, 12) and hypoxia (30). In other cell types, cell stretching and hypoxia are potent inducers of IL-8 expression (19, 26). Consequently, the effect of cell stretching and hypoxia on IL-8 secretion by liver cyst epithelial cells was modeled by subjecting Mz-ChA1 cells to stretching or hypoxia (Figure 6). Cell stretching induced an increase inIL-8 secretion (Basal: 0.91 ± 0.07 ng/ml1; Stretch: 1.56 ± 0.14 ng/ml; n=5). Similarly, hypoxia induced a significant increase in IL-8 release (Basal: 0.54 ± 0.13 ng/ml; Hypoxia: 0.89 ± 0.22 ng/ml; n=5). While other stressors may also moderate IL-8 expression, these observations demonstrate that both hypoxia and cell stretching increase IL-8 synthesis and release.
Stress-responsive elements regulating IL-8 transcription
The transcription factors AP-1, c/EBP and NF-κB have been shown in different model systems to be potent activators of IL-8 gene expression with defined binding sites within the IL-8 promoter (14). An IL-8 promoter-luciferase construct that included these three sites as well as an extended upstream region was used to explore the regions and sites responsible for the stress-induced expression of IL-8 in cholangiocytes (Figure 7A and 8A). An initial analysis was performed using 5′ truncations of the full length −1,482/+44 IL-8-Luc promoter construct (Figure 7). The −272/+44 promoter contains the AP-1, c/EBP and NF-κB sites. The −98/+44 promoter has the AP-1 site deleted and the −50/+44 promoter has all three sites deleted. With the full length IL-8 promoter, the basal promoter activity (100%; n=8) was doubled in cells exposed to either cell stretching (220 ± 28%; n=8; Figure 7B) or hypoxia (217 ± 24%; n=6; Figure 7C). In the cell stretch study, the −272/+44 promoter had a diminished basal promoter activity (49 ± 7%; n=8) and failed to show a robust increase in promoter activity under stretched conditions (75 ± 18%; n=8; Figure 7B). The −272/+44 construct in the hypoxia study retained its basal activity (83 ± 19; n=6; Figure 7C) but showed no significant increase in activity under hypoxic conditions (124 ± 20%; n=6; Figure 7C). Both the basal and stretch-induced promoter activities in the −98/+44 and −50/+44 truncation mutants were essentially abolished. In the hypoxia studies, the −98/+44 and −50/+44 promoter truncation mutants also presented minimal basal activities and no increase in promoter activities in response to hypoxia.
In complimentary studies, the basal and stress-induced IL-8 promoter activities were measured in constructs with the AP-1, c/EBP and NF-κB binding sites mutated to eliminate their binding and activation (Figure 8). The three sites were mutated individually, in pairs or in triplicate. Mutation of either the AP-1 site or the NF-κB site resulted in a profound decrease in the basal IL-8 promoter activity level. Neither hypoxia nor cell stretching significantly increased the IL-8 promoter activity of the mutated constructs. Mutation of the c/EBP site resulted in a more modest decrease in the basal promoter activity. The mutation of any two of the AP-1, c/EBP or NF-κB binding sites or mutation of all three sites largely eliminated the basal IL-8 promoter activity, corroborating the essential participation of these transcription factors in allowing IL-8 gene expression. These results were confirmed using a smaller (−131/+11) IL-8 “core” promoter that had specific mutations within the AP-1, c/EBP and NF-κB sites (data not shown) (20). With regards to the promoter activity in response to hypoxia and cell stretching, despite an intact sequence upstream of the AP-1, c/EBP, NF-κB binding sites, there was little or no increase in IL-8 promoter activity when any of the known transcription factor binding sites were mutated. Together the truncation and mutation studies confirm that the “core promoter”, including the AP-1, c/EBP, NF-κB sites, is essential for both the basal and stress-activated activities. Regions upstream of the core promoter, however, are also required for stress-dependent activation of the IL-8 promoter.
IL-8 promoter polymorphism modifies stress-induced IL-8 expression
Several single nucleotide polymorphisms (SNPs) have been reported within the IL-8 gene. The IL-8 SNP at -251 bp (T>A; rs4073) has been well characterized and is associated with altered IL-8 expression, increased risk for gastric carcinoma and increased respiratory infections (21, 35, 37). To assess if this polymorphism moderates IL-8 promoter activity under basal or stressed conditions, a single base A>T substitution was introduced at -251 bp by site-directed mutagenesis in the full-length −1,481/+44 IL-8 promoter-luc vector and the comparative promoter activities were measured under basal and stress conditions (Figure 9). Under basal conditions, there was no difference in promoter activities between the -251A (100%; n=5) and - 251T IL-8 promoters (101 ± 9 %, n=5). In contrast, the stretch-dependent increase in IL-8 promoter activity measured in -251A construct (255 ± 25 % of -251A basal activity; n=5) was blunted in the -251T reporter construct (173 ± 2% of -251A basal activity, n=5). (Figure 9B). A similar response was observed in preliminary hypoxia studies (data not shown). It will be of significant clinical interest to determine if individuals with a -251A SNP secrete and accumulate greater amounts of IL-8 in liver cyst fluids than individuals with a -251T SNP.
DISCUSSION
Multiple factors may influence the clinical progression of ADPKD
ADPKD has been definitively linked to mutations in the PKD1 and PKD2 genes. The clinical presentation of ADPKD, however, is markedly heterogeneous and impacted by both genetic and extragenetic factors. For example, the onset of disease occurs, on average, 15 years earlier in individuals with PKD1 mutations versus those with PKD2 mutations. Further, ADPKD is considered a molecular recessive disease that arises from a germline mutation in one copy of the gene and a somatic mutation that later inactivates the second PKD allele. The rate, timing and intragenic site of the somatic mutation can impact cystogenesis (18, 34). Despite different rates of cystogenesis in individuals with PKD1 versus PKD2 mutations, the rates of cyst growth in these individuals are similar (9, 17). This suggests that while cystogenesis is largely determined by the primary mutation but cyst growth is likely moderated by extra-genetic factors. Significant intra-familial variability in disease severity also indicates that extra-genetic factors influence the presentation of the disease (31). Some of the extra-genetic factors that modify disease severity have begun to be identified by genetic linkage analyses (13). Discovering and defining the extra-genetic factors responsible for driving cyst growth is specifically important for liver cyst growth since it is the total volume (i.e. cyst growth) and not the number of liver cysts (i.e cystogenesis) that dictates the clinical presentation of ADPKD liver cyst disease.
Growth factor and cytokine profiles in liver and kidney cyst fluids are distinct
Cytokines and growth factors secreted by the cyst lining epithelial cells have long been predicted to promote cyst growth. Various pro-growth factors, including IL-1, IL-2, TNF-α, and EGF, have been reported to accumulate in kidney cyst fluids (16, 29, 40). Factors such as IL-8, ENA78, IL-6 and VEGF, have been discovered more recently in ADPKD liver cyst fluids (30). It remained unclear, however, if the cytokine/growth factor profile was largely determined by changes that occurred within all epithelial cells in which PKD1 or PKD2 was mutated or if the profile was largely independent of the primary mutation and dictated by the individual epithelial cell type forming the cyst. Paired cytokine array analyses and ELISA studies documented that, despite some overlap, the profiles were distinct and several factors were specific either to the liver or kidney cyst fluids. (Figure 1; Table 1). De-identification of the samples did not allow demographic differences in the liver and kidney cyst fluid donors to be evaluated. However, with liver cyst disease being far more prevalent in women than men and, conversely, kidney cyst disease is more prevalent in men than women, differences in the sex of the donors might influence the differences in the factors found in the liver and kidney cyst fluids. Regardless, the distinct cytokine and growth factor profiles indicate distinct mechanisms likely regulate the development and growth of the liver and kidney cysts and highlight the need to specifically study the molecular mechanisms underlying ADPKD liver cyst formation and growth.
CXCR2 agonists are concentrated in liver cyst fluids
A striking difference between the liver and kidney cyst fluids was the higher concentrations of CXCR2 agonists, including IL-8, GROα and ENA78, in the liver cyst fluids (Figures 1 and 2). All three factors were present at levels near or above their dissociation constant for CXCR2 binding (24, 27). Studied in the greatest detail, IL-8 is a potent proinflammatory chemokine, induces angiogenesis, promotes tumor invasion and metastasis and stimulates epithelial cell proliferation (3, 7, 22, 23, 33, 43). In epithelial cell models, IL-8 has been shown to contribute to the induction of transepithelial migration of neutrophils (8). Preliminary studies in liver cysts have not consistently found evidence of neutrophil infiltration into liver cyst fluids (data not shown) but additional studies are required to assess if CXCR2 agonists induce neutrophil migration or an inflammatory response into the liver cyst wall.
The secretion of IL-8 across both the apical and basolateral membranes, as seen in Figure 3, positions CXCR2 agonists to signal angiogenesis within the liver cyst wall and proliferation of the liver cyst epithelial cells. CXCR2 is expressed both on human endothelial cells (1, 25) and on human liver cyst epithelial cells (30). In vitro proliferation assays demonstrated that exogenous IL-8 and liver cyst fluids containing CXCR2 agonists induced proliferation of both endothelial cells and cholangiocytes (Figures 4 and 5). If CXCR2 is similarly activated in the native epithelial and endothelial cells within liver cyst walls, this pathway may contribute to in vivo liver cyst growth. It should be noted that other factors are present in the cyst fluids and likely act in conjunction with CXCR2 agonists to moderate the cellular proliferation and growth response of liver cysts. This is highlighted by the robust proliferative response of HMEC-1 endothelial cells or Mz-ChA1 epithelial cells that was induced by liver cyst fluid was not fully blocked by pre-treatment with 50 nM SB225002, a potent CXCR2 receptor inhibitor (Figures 4 and 5). VEGF is an example of another factor that is present in liver cyst fluids and likely contributes to liver cyst growth. VEGF is present in mouse and human liver cyst fluids. Inhibition of VEGF signaling blunted the in vitro proliferative response of mouse liver cyst epithelial cells following treatment with mouse liver cyst fluid and impeded in vivo liver cyst growth (4). Interestingly, cooperation between the CXCR2 and VEGFR2 signaling pathways for cell activation has been demonstrated (32). In the future, it will be of significant interest to investigate the potential interplay and synergism between the different signaling pathways that are activated in response to the complex mixture of cytokines and growth factors present within the cyst fluids.
IL-8 expression was influenced by cellular stress and genetic polymorphisms
With concentrations poised around the Kd for CXCR2, increases in IL-8 expression are predicted to increase the magnitude of CXCR2 signaling. The expression of many cytokines and growth factors is regulated by different stresses experienced by cells. In other cell types, cell stretching and hypoxia (15, 26) both induce IL-8 expression. Evidence suggests that human ‘cystic’ cholangiocytes in liver cyst walls experience both stretching and hypoxia.
Cell stretching would be predicted to occur when fluid is secreted into the enclosed lumen of the liver cysts or the diaphragm presses down on the superficial liver cysts. In vitro studies using pkd2(WS25/−) mouse liver cyst epithelial cells demonstrate ‘cystic’ cholangiocytes retain their secretory responses to both elevated extracellular ATP or cAMPi (11). Interestingly, ATP concentrations are elevated in a subset of both mouse and human liver cyst fluid samples. In vivo human ADPKD liver cysts secrete fluid into the cyst lumens in response to secretin, a potent cAMPi-dependent choleretic hormone (12). Alternatively, ultrasonography of in vivo pkd2(WS25/−) mouse liver cysts showed that the downward movement of the diaphragm physically distorted the liver cysts and manometer readings of pressure within liver cysts detected a positive lumenal pressure with chest compressions (data not shown). In the present study, applying a respiratory pattern of cell stretching resulted in an increased expression of IL-8 from Mz-ChA1 cells (Figure 6). This increase in expression was accompanied by increases in IL-8 promoter activity (Figures 7 and 8). Paralleling studies in other cell types (14), AP-1, NF-κB and, to a lesser extent, c/EBP binding sites were required for activating the IL-8 promoter in Mz-ChA1 cells (Figures 7 and 8). These sites, however, were not responsible for activating the IL-8 promoter in response to cell stretching. Instead, a region lying between -252 bp and −1,481 bp, well upstream of the AP-1, c/EBP and NF-κB binding sites, enabled cell stretching to increase IL-8 promoter activity. Full characterization the specific cis-sites and trans factors responsible for the stress response of the IL-8 promoter may provide a therapeutic target to intercede in IL-8 expression within liver cyst lining epithelial cells.
The walls of large human ADPKD liver cysts also display features of hypoxic stress. The cyst lining epithelial cells have hypoxic characteristics, including microvillar elongation, loss of microvillar structure/blebbing and loss of microvillar density (10, 30), and large human liver cyst walls were relatively avascular (average vessel to epithelium distance was >100 μm; (data not shown)). As with cell stretching, hypoxia induced Mz-ChA1 cells to secrete greater concentrations of IL-8 than paired normoxic cells (Figure 6) and was paralleled by increased IL-8 promoter activity (Figures 7 and 8). These observations indicate that cell stretching and hypoxia can increase the synthesis and release of IL-8. These elevated levels of IL-8 would likely promote increases in the proliferation rates of the liver cyst epithelial and endothelial cells.
In addition to the environmental stressors, an individual’s genetic background can also influence IL-8 expression. The IL-8 gene has several single nucleotide polymorphisms that can influence IL-8 expression. Among the best characterized, the -251T>A polymorphism correlates with increased IL-8 expression, greater tumorigenic capacity and a poorer prognosis in a number of specific tumor types (21, 35, 37). In Mz-ChA1 cells, constructs with the -251A>T IL-8 polymorphism had no effect on the basal IL-8 promoter activity but blunted the increase in IL-8 promoter activity that is induced by cell stretching (Figure 9). With IL-8 having been implicated in the pathogenesis of different diseases, it will be of significant interest to evaluate the role of IL-8 in the ADPKD liver cyst disease by comparing and contrasting the concentrations of IL-8 accumulated in liver cyst fluids and the severity of liver cyst disease in ADPKD patients with the -251A versus the -251T polymorphisms in their IL-8 promoter. More broadly, strategies to intercede in the induction of IL-8 expression, whether from cellular stresses or genetic polymorphisms, should reduce IL-8 signaling and any consequent growth within ADPKD liver cysts.
In summary, the present studies support a principal role for IL-8 and CXCR2 signaling in impacting the progression of ADPKD liver cyst disease. Signaling from IL-8 and other CXCR2 agonists that amasses in ADPKD liver cyst fluid was capable of driving proliferation of both epithelial and endothelial cells. With liver cyst expansion being the primary factor dictating the clinical manifestations of ADPKD liver cyst disease, the present studies support the investment in in vivo studies to directly determine the contribution of CXCR2 signaling in promoting ADPKD liver cyst growth.
Acknowledgments
The atmospheric chamber was kindly provided by Dr. Sean Colgan (Gastroenterology Division, UCDHSC). The Flexercel Stress Unit (Flexcell Corp., McKeesport, PA) was graciously provided by Dr. Raphael Nemenoff (Renal Division, DOM, UCDSHC). The renilla luciferase reporter gene plasmid was graciously given by Dr. Lynn Heasley (Renal Division, DOM, UCDHSC). The “core” IL-8 promoter-luciferase constructs, including mutations for AP-1, NF-kB and c/EBP binding sites were a kind contribution from Dr. Michael Kracht (Medical School Hannover, Germany). The abdominal ultrasonographic evaluation in mice was kindly performed by Dr. Kelly Ambler (Cardiology Division, DOM, UCDHSC).
GRANTS
This research was supported by grants to RBD from the NIH-NIDDK (DK034039) and the Polycystic Kidney Foundation (109a2r).
Abbreviations used in this paper
- ADPKD
autosomal dominant polycystic kidney disease
- IL-8
interleukin 8
- ENA-78
epithelial-cell-derived neutrophil attractant-78
- GROα
growth regulated oncogene/melanoma growth stimulatory activity
- VEGF
vascular endothelial growth factor
- EGF
endothelial growth factor
- CXCR2
cystidine-X-cystidine receptor type 2
- MIP-1
macrophage inflammatory protein 1
- MCP-1
macrophage chemotactic protein-1
- PCNA
proliferating nuclear antigen
References
- 1.Addison CL, Daniel TO, Burdick MD, Liu H, Ehlert JE, Xue YY, Buechi L, Walz A, Richmond A, Strieter RM. The CXC chemokine receptor 2, CXCR2, is the putative receptor for ELR+ CXC chemokine-induced angiogenic activity. J Immunol. 2000;165:5269–5277. doi: 10.4049/jimmunol.165.9.5269. [DOI] [PubMed] [Google Scholar]
- 2.Ades EW, Candal FJ, Swerlick RA, George VG, Summers S, Bosse DC, Lawley TJ. HMEC-1: establishment of an immortalized human microvascular endothelial cell line. J Invest Dermatol. 1992;99:683–690. doi: 10.1111/1523-1747.ep12613748. [DOI] [PubMed] [Google Scholar]
- 3.Ali S, Lazennec G. Chemokines: novel targets for breast cancer metastasis. Cancer metastasis reviews. 2007;26:401–420. doi: 10.1007/s10555-007-9073-z. [DOI] [PMC free article] [PubMed] [Google Scholar]
- 4.Amura C, Brodsky KS, Groff R, Gattone VH, Voelkel NF, Doctor RB. VEGF receptor inhibition blocks liver cyst growth in pkd2(WS25/−) mice. Am J Physiol Cell Physiol. 2007 doi: 10.1152/ajpcell.00038.2007. [DOI] [PubMed] [Google Scholar]
- 5.Amura CR, Marek L, Winn RA, Heasley LE. Inhibited neurogenesis in JNK1-deficient embryonic stem cells. Mol Cell Biol. 2005;25:10791–10802. doi: 10.1128/MCB.25.24.10791-10802.2005. [DOI] [PMC free article] [PubMed] [Google Scholar]
- 6.Bae KT, Zhu F, Chapman AB, Torres VE, Grantham JJ, Guay-Woodford LM, Baumgarten DA, King BF, Jr, Wetzel LH, Kenney PJ, Brummer ME, Bennett WM, Klahr S, Meyers CM, Zhang X, Thompson PA, Miller JP. Magnetic resonance imaging evaluation of hepatic cysts in early autosomal-dominant polycystic kidney disease: the Consortium for Radiologic Imaging Studies of Polycystic Kidney Disease cohort. Clin J Am Soc Nephrol. 2006;1:64–69. doi: 10.2215/CJN.00080605. [DOI] [PubMed] [Google Scholar]
- 7.Bendre MS, Gaddy-Kurten D, Mon-Foote T, Akel NS, Skinner RA, Nicholas RW, Suva LJ. Expression of interleukin 8 and not parathyroid hormone-related protein by human breast cancer cells correlates with bone metastasis in vivo. Cancer Res. 2002;62:5571–5579. [PubMed] [Google Scholar]
- 8.Bijuklic K, Sturn DH, Jennings P, Kountchev J, Pfaller W, Wiedermann CJ, Patsch JR, Joannidis M. Mechanisms of neutrophil transmigration across renal proximal tubular HK-2 cells. Cell Physiol Biochem. 2006;17:233–244. doi: 10.1159/000094128. [DOI] [PubMed] [Google Scholar]
- 9.Chapman AB, Guay-Woodford LM, Grantham JJ, Torres VE, Bae KT, Baumgarten DA, Kenney PJ, King BF, Jr, Glockner JF, Wetzel LH, Brummer ME, O’Neill WC, Robbin ML, Bennett WM, Klahr S, Hirschman GH, Kimmel PL, Thompson PA, Miller JP. Renal structure in early autosomal-dominant polycystic kidney disease (ADPKD): The Consortium for Radiologic Imaging Studies of Polycystic Kidney Disease (CRISP) cohort. Kidney Int. 2003;64:1035–1045. doi: 10.1046/j.1523-1755.2003.00185.x. [DOI] [PubMed] [Google Scholar]
- 10.Doctor RB, Dahl RH, Salter KD, Fitz JG. Reorganization of cholangiocyte membrane domains represents an early event in rat liver ischemia. Hepatology. 1999;29:1364–1374. doi: 10.1002/hep.510290514. [DOI] [PubMed] [Google Scholar]
- 11.Doctor RB, Johnson S, Brodsky KS, Amura CR, Gattone V, Fitz JG. Regulated ion transport in mouse liver cyst epithelial cells. Biochim Biophys Acta. 2007;1772:345–354. doi: 10.1016/j.bbadis.2006.11.006. [DOI] [PubMed] [Google Scholar]
- 12.Everson G, Emmett M, Brown W, Redmond P, Thickman D. Functional similarities of hepatic and biliary epithelium: studies of fluid constituents and in vivo secretion in response to secretin. Hepatology. 1990;11:557–565. doi: 10.1002/hep.1840110406. [DOI] [PubMed] [Google Scholar]
- 13.Fain PR, McFann KK, Taylor MRG, Tison M, Johnson AM, Reed B, Schrier RW. Modifier genes play a significant role in the phenotypic expression of PKD1. Kidney Int. 2005;67:1256–1267. doi: 10.1111/j.1523-1755.2005.00203.x. [DOI] [PubMed] [Google Scholar]
- 14.Freund A, Jolivel V, Durand S, Kersual N, Chalbos D, Chavey C, Vignon F, Lazennec G. Mechanisms underlying differential expression of interleukin-8 in breast cancer cells. Oncogene. 2004;23:6105–6114. doi: 10.1038/sj.onc.1207815. [DOI] [PMC free article] [PubMed] [Google Scholar]
- 15.Galindo M, Santiago B, Alcami J, Rivero M, Martin-Serrano J, Pablos J. Hypoxia induces expression of the chemokines MCP-1 and IL-8 in human dermal fibroblasts. Clinical and experimental immunology. 2001;123:36–41. doi: 10.1046/j.1365-2249.2001.01412.x. [DOI] [PMC free article] [PubMed] [Google Scholar]
- 16.Gardner KJ, Burnside J, Elzinga L, Locksley R. Cytokines in fluids from polycystic kidneys. Kidney Int. 1991;39:718–724. doi: 10.1038/ki.1991.87. [DOI] [PubMed] [Google Scholar]
- 17.Grantham JJ, Torres VE, Chapman AB, Guay-Woodford LM, Bae KT, King BF, Jr, Wetzel LH, Baumgarten DA, Kenney PJ, Harris PC, Klahr S, Bennett WM, Hirschman GN, Meyers CM, Zhang X, Zhu F, Miller JP. Volume progression in polycystic kidney disease. N Engl J Med. 2006;354:2122–2130. doi: 10.1056/NEJMoa054341. [DOI] [PubMed] [Google Scholar]
- 18.Hateboer N, Veldhuisen B, Peters D, Breunning MH, San Millan JL, Bogdanova M, Coto E, van Dijk MA, Afzal AR, Jeffery S, Saggar-Malik AK, Torra R, Dimitrakov D, Martinez I, Sanz de Castro S, Krawczak K, Ravine D. Location of mutations within the PKD2 gene influences clinical outcomes. Kidney Int. 2000;57:1444–1451. doi: 10.1046/j.1523-1755.2000.00989.x. [DOI] [PubMed] [Google Scholar]
- 19.Hirani N, Antonicelli F, Strieter RM, Wiesener MS, Ratcliffe PJ, Haslett C, Donnelly SC. The regulation of interleukin-8 by hypoxia in human macrophages--a potential role in the pathogenesis of the acute respiratory distress syndrome (ARDS) Mol Med. 2001;7:685–697. [PMC free article] [PubMed] [Google Scholar]
- 20.Holtmann H, Winzen R, Holland P, Eickemeier S, Hoffmann E, Wallach D, Malinin NL, Cooper JA, Resch K, Kracht M. Induction of interleukin-8 synthesis integrates effects on transcription and mRNA degradation from at least three different cytokine- or stress-activated signal transduction pathways. Mol Cell Biol. 1999;19:6742–6753. doi: 10.1128/mcb.19.10.6742. [DOI] [PMC free article] [PubMed] [Google Scholar]
- 21.Hull J, Thomson A, Kwiatkowski D. Association of respiratory syncytial virus bronchiolitis with the interleukin 8 gene region in UK families. Thorax. 2000;55:1023–1027. doi: 10.1136/thorax.55.12.1023. [DOI] [PMC free article] [PubMed] [Google Scholar]
- 22.Kitadai Y, Haruma K, Mukaida N, Ohmoto Y, Matsutani N, Yasui W, Yamamoto S, Sumii K, Kajiyama G, Fidler IJ, Tahara E. Regulation of disease-progression genes in human gastric carcinoma cells by interleukin 8. Clin Cancer Res. 2000;6:2735–2740. [PubMed] [Google Scholar]
- 23.Kuwada Y, Sasaki T, Morinaka K, Kitadai Y, Mukaida N, Chayama K. Potential involvement of IL-8 and its receptors in the invasiveness of pancreatic cancer cells. Int J Oncol. 2003;22:765–771. [PubMed] [Google Scholar]
- 24.Lee J, Horuk R, Rice G, Bennett G, Camerato T, Wood W. Characterization of two high affinity human IL-8 receptors. J Biol Chem. 1992;267:16283–16287. [PubMed] [Google Scholar]
- 25.Li A, Varney ML, Valasek J, Godfrey M, Dave BJ, Singh RK. Autocrine role of interleukin-8 in induction of endothelial cell proliferation, survival, migration and MMP-2 production and angiogenesis. Angiogenesis. 2005;8:63–71. doi: 10.1007/s10456-005-5208-4. [DOI] [PubMed] [Google Scholar]
- 26.Li LF, Ouyang B, Choukroun G, Matyal R, Mascarenhas M, Jafari B, Bonventre JV, Force T, Quinn DA. Stretch-induced IL-8 depends on c-Jun NH2-terminal and nuclear factor-kappaB-inducing kinases. Am J Physiol Lung Cell Mol Physiol. 2003;285:L464–475. doi: 10.1152/ajplung.00031.2003. [DOI] [PubMed] [Google Scholar]
- 27.Lowman HB, Slagle PH, DeForge LE, Wirth CM, Gillece-Castro BL, Bourell JH, Fairbrother WJ. Exchanging interleukin-8 and melanoma growth-stimulating activity receptor bindinig specificities. J Biol Chem. 1996;271:14344–14352. doi: 10.1074/jbc.271.24.14344. [DOI] [PubMed] [Google Scholar]
- 28.Mitsuyama K, Toyonaga A, Sasaki E, Watanabe K, Tateishi H, Nishiyama T, Saiki T, Ikeda H, Tsuruta O, Tanikawa K. IL-8 as an important chemoattractant for neutrophils in ulcerative colitis and Crohn’s disease. Clinical and experimental immunology. 1994;96:432–436. doi: 10.1111/j.1365-2249.1994.tb06047.x. [DOI] [PMC free article] [PubMed] [Google Scholar]
- 29.Munemura C, Uemasu J, Kawasaki H. Epidermal growth factor and endothelin in cyst fluid from autosomal dominant polycystic kidney disease cases: possible evidence of heterogeneity in cystogenesis. Am J Kidney Dis. 1994;24:561–568. doi: 10.1016/s0272-6386(12)80212-5. [DOI] [PubMed] [Google Scholar]
- 30.Nichols MT, Gidey E, Matzakos T, Dahl R, Stiegmann G, Shah RJ, Grantham JJ, Fitz JG, Doctor RB. Secretion of cytokines and growth factors into autosomal dominant polycystic kidney disease liver cyst fluid. Hepatology. 2004;40:836–846. doi: 10.1002/hep.20401. [DOI] [PubMed] [Google Scholar]
- 31.Persu A, Duyme M, Pirson Y, Lens XM, Messiaen T, Breuning MH, Chauveau D, Levy M, Grunfeld JP, Devuyst O. Comparison between siblings and twins supports a role for modifier genes in ADPKD. Kidney Int. 2004;66:2132–2136. doi: 10.1111/j.1523-1755.2004.66003.x. [DOI] [PubMed] [Google Scholar]
- 32.Petreaca ML, Yao M, Liu Y, Defea K, Martins-Green M. Transactivation of Vascular Endothelial Growth Factor Receptor-2 by Interleukin-8 (IL-8/CXCL8) Is Required for IL-8/CXCL8-induced Endothelial Permeability. Molecular biology of the cell. 2007;18:5014–5023. doi: 10.1091/mbc.E07-01-0004. [DOI] [PMC free article] [PubMed] [Google Scholar]
- 33.Remick DG. Interleukin-8. Crit Care Med. 2005;33:S466–467. doi: 10.1097/01.ccm.0000186783.34908.18. [DOI] [PubMed] [Google Scholar]
- 34.Rossetti S, Burton S, Strmecki L, Pond GR, San Millan JL, Zerres K, Barratt TM, Ozen S, Torres VE, Bergstralh EJ, Winearls CG, Harris PC. The position of the polycystic kidney disease 1 (PKD1) gene mutation correlates with the severity of renal disease. J Am Soc Nephrol. 2002;13:1230–1237. doi: 10.1097/01.asn.0000013300.11876.37. [DOI] [PubMed] [Google Scholar]
- 35.Savage SA, Abnet CC, Mark SD, Qiao YL, Dong ZW, Dawsey SM, Taylor PR, Chanock SJ. Variants of the IL8 and IL8RB genes and risk for gastric cardia adenocarcinoma and esophageal squamous cell carcinoma. Cancer Epidemiol Biomarkers Prev. 2004;13:2251–2257. [PubMed] [Google Scholar]
- 36.Shi Q, Xiong Q, Le X, Xie K. Regulation of interleukin-8 expression by tumor-associated stress factors. J Interferon Cytokine Res. 2001;21:553–566. doi: 10.1089/10799900152547812. [DOI] [PubMed] [Google Scholar]
- 37.Taguchi A, Ohmiya N, Shirai K, Mabuchi N, Itoh A, Hirooka Y, Niwa Y, Goto H. Interleukin-8 promoter polymorphism increases the risk of atrophic gastritis and gastric cancer in Japan. Cancer Epidemiol Biomarkers Prev. 2005;14:2487–2493. doi: 10.1158/1055-9965.EPI-05-0326. [DOI] [PubMed] [Google Scholar]
- 38.Tanner G, McQuillan P, Maxwell M, Keck J, McAteer J. An in vitro test of the cell stretch-proliferation hypothesis of renal cyst enlargement. J Am Soc Nephrol. 1995;6:1230–1241. doi: 10.1681/ASN.V641230. [DOI] [PubMed] [Google Scholar]
- 39.Torres VE, Harris PC, Pirson Y. Autosomal dominant polycystic kidney disease. Lancet. 2007;369:1287–1301. doi: 10.1016/S0140-6736(07)60601-1. [DOI] [PubMed] [Google Scholar]
- 40.Torres VE, Sweeney WE, Wang X, Qian Q, Harris PC, Frost P, Avner ED. EGF receptor tyrosine kinase inhibition attenuates the development of PKD in Han:SPRD rats. Kidney Int. 2003;64:1573–1579. doi: 10.1046/j.1523-1755.2003.00256.x. [DOI] [PubMed] [Google Scholar]
- 41.Vlahakis N, Schroeder M, Limper A, Hubmayr R. Stretch induces cytokine release by alveolar epithelial cells in vitro. Am J Physiol. 1999;277:L167–173. doi: 10.1152/ajplung.1999.277.1.L167. [DOI] [PubMed] [Google Scholar]
- 42.Wall WJ. Images in clinical medicine. Liver transplantation for polycystic liver disease. N Engl J Med. 2007;356:1560. doi: 10.1056/NEJMicm055470. [DOI] [PubMed] [Google Scholar]
- 43.Wang B, Hendricks DT, Wamunyokoli F, Parker MI. A growth-related oncogene/CXC chemokine receptor 2 autocrine loop contributes to cellular proliferation in esophageal cancer. Cancer Res. 2006;66:3071–3077. doi: 10.1158/0008-5472.CAN-05-2871. [DOI] [PubMed] [Google Scholar]
- 44.Wang Y, Yang J, Gao Y, Du Y, Bao L, Niu W, Yao Z. Regulatory effect of e2, IL-6 and IL-8 on the growth of epithelial ovarian cancer cells. Cell Mol Immunol. 2005;2:365–372. [PubMed] [Google Scholar]
- 45.Wu G, D’Agati V, Cai Y, Markowitz GS, Park JH, Reynolds DM, Maeda Y, Le TC, Hou HJ, Kuchrlapati R, Edelmann W, Somlo S. Somatic inactivation of Pkd2 results polycystic kidney disease. Cell. 1998;93:177–188. doi: 10.1016/s0092-8674(00)81570-6. [DOI] [PubMed] [Google Scholar]