

Abstract
Background
The management of Merkel cell carcinoma (MCC) has been complicated by a lack of detailed prognostic data and by the presence of conflicting staging systems.
Objective
To determine the prognostic significance of tumor size, clinical vs pathologic nodal evaluation, and extent of disease at presentation and thereby derive the first consensus staging/prognostic system for MCC.
Methods
5,823 prospectively enrolled MCC cases from the National Cancer Data Base (NCDB) had follow-up data (median 64 months) and were used for prognostic analyses.
Results
At 5 years, overall survival was 40% and relative survival (compared to age- and sex-matched population data) was 54%. Among all MCC cases, 66% presented with local, 27% with nodal and 7% with distant metastatic disease. For cases presenting with local disease only, smaller tumor size was associated with better survival (stage I: ≤2cm: 66% relative survival at five years; stage II: >2cm: 51%; p<0.0001). Patients with clinically local-only disease and pathologically proven negative nodes had better outcome (76% at five years) than those who only underwent clinical nodal evaluation (59%, p<0.0001).
Limitations
The NCDB does not capture disease-specific survival. Overall survival for MCC patients was therefore used to calculate relative survival based on matched population data.
Conclusion
Although the majority (68%) of MCC patients in this nationwide cohort did not undergo pathologic nodal evaluation, this procedure may be indicated in many cases as it improves prognostic accuracy and has important treatment implications for those found to have microscopic nodal involvement.
Keywords: Merkel cell carcinoma, neuroendocrine carcinoma of the skin, staging, prognosis, sentinel lymph node biopsy, clinical staging, pathologic staging
Introduction
Merkel cell carcinoma (MCC) is a neuroendocrine cancer that arises most commonly on the sun-exposed skin of Caucasians who are older than 50. Over the past 20 years, the reported incidence of MCC has more than tripled1 because of new pathologic techniques that diminish missed diagnoses (cytokeratin-20 stain introduced in 1994) and an increased population at risk due to ultraviolet exposure, advanced age, and immune suppression. As of 2008, there are approximately 1,500 MCC cases per year in the US2. MCC is challenging to control due to its propensity for loco-regional recurrence and early microscopic spread to nodes and distant sites. A novel human polyomavirus was recently found to be integrated into the genome of the majority of MCCs3. This virus helps to explain the epidemiologic association of MCC with immune suppression4. The clinical features most commonly associated with primary MCC tumors have been summarized using an acronym, AEIOU: Asymptomatic or non-tender, Expanding rapidly, Immune suppressed, Older than 50, UV-exposed fair skin. Among patients presenting with a primary cutaneous MCC, 89% had three or more of these five features5.
Five staging systems for MCC have been published over the past 17 years, all of which were based on cohorts of 251 or fewer cases derived from three or fewer institutions6–10. Discrepancies among these five systems include: (1) three-stage vs. four-stage systems; (2) regional nodal disease variably defined as stage II or stage III, and; (3) different tumor size thresholds for determining the Tumor (T) categories for primary lesions. Depending on which system was used, “Stage III Merkel cell carcinoma” could refer to invasive local-only disease, regional nodal disease, or distant metastatic MCC. In addition, prior staging systems did not differentiate either: i) whether nodal evaluation was microscopic or clinical-only or ii) whether nodal involvement was clinically detectable or only microscopic in extent.
To address these issues, a prognostic analysis of clinical factors in MCC was carried out using data from the National Cancer Data Base (NCDB, established in 1989 as a joint project of the American College of Surgeons and the American Cancer Society). The NCDB is a national tumor registry maintained by the Commission on Cancer that captures approximately 70% of all cancer diagnoses in the United States11 and has accumulated the largest known cohort of MCC patients. This analysis was used to derive a new MCC prognostic/staging system to be adopted world-wide in 2010.
Patients and Methods
Cases from the NCDB were identified using MCC-specific histology code 8247. A flow diagram of the MCC cases used for the prognosis and staging analysis is shown in Figure 1. There were 10,020 MCC patients captured in the NCDB between 1986–2004 that were used for basic demographic analyses (Table 1). The NCDB’s policy is to collect follow-up data from the time of initial diagnosis at five-year intervals. All patients diagnosed before the year 2000 (5823 patients) had follow-up data available and were used for this analysis. Median follow-up was 64.1 months for the 2282 patients who were alive at the time of last contact.
Figure 1. Flow diagram for MCC cases prospectively captured by the NCDB and extent of available data.

There were 10,020 MCC cases captured by the NCDB during 1986–2004. Among those captured prior to the year 2000, 5823 cases had available follow-up data and served as the basis for overall survival and staging analyses. Double boxes indicate groups used for analysis and discussed in this study. As detailed in the Patients and Methods section, cases that had no data in any of the Tumor, Nodal or Metastatic categories (TxNxMx) were eliminated from consideration beyond basic demographic characteristics (Table 1). The effect of Nodal and Tumor status on prognosis was assessed using cases that were negative for distant metastatic disease; therefore, patients with distant metastasis (M1) were excluded from analysis of nodal and primary tumor data. Similarly, cases presenting with pathologically confirmed nodal disease (pN1) were excluded from analysis of primary tumor data, as were those with unknown nodal status (Nx). In total, 2856 cases had available follow-up as well as TNM data sufficient for stage assignment.
Table 1.
Demographics of 10,020 Merkel Cell Carcinoma Patients in the National Cancer Data Base Dataset (1986–2004)
| Number | Percent | |
|---|---|---|
| Gender | ||
| Men | 6144 | 61.3% |
| Women | 3876 | 38.7% |
| Age (median = 76 yrs) | ||
| <40 | 93 | 0.9% |
| 40–49 | 297 | 3.0% |
| 50–59 | 848 | 8.5% |
| 60–69 | 1796 | 17.9% |
| 70–79 | 3543 | 35.4% |
| 80–89 | 2835 | 28.3% |
| 90+ | 608 | 6.1% |
| Body Site | ||
| Lip | 249 | 2.5% |
| Eyelid | 249 | 2.5% |
| External Ear | 398 | 4.0% |
| Other unspecified part of face | 2787 | 27.8% |
| Scalp and neck | 973 | 9.7% |
| Trunk | 1176 | 11.7% |
| Upper limb and shoulder | 2100 | 21.0% |
| Lower limb and hip | 1534 | 15.3% |
| Overlapping lesion of skin | 38 | 0.4% |
| Skin, NOS | 516 | 5.2% |
| Extent of Disease* | ||
| Local | 4437 | 65.6% |
| Nodal | 1836 | 27.1% |
| Metastatic | 491 | 7.3% |
| Race | ||
| White** | 9640 | 96.2% |
| Black | 126 | 1.3% |
| American Indian, Aleutian or Eskimo | 13 | 0.1% |
| Asian, Pacific Islander | 77 | 0.8% |
| Other/Unknown | 164 | 1.6% |
Extent of Disease data was only available for 6764 patients.
1.8% (n=181) of those classified as White are of Spanish/Hispanic ethnicity.
Among patients with follow-up, some have incomplete staging data because i) staging was not required by the Commission on Cancer/NCDB prior to 1990, ii) complete information may not have been available in the medical record, or iii) a cancer such as MCC that was uncommon and did not have a dedicated AJCC staging system may have been staged less frequently. Of the patients with follow-up data, 1119 were excluded from staging analyses because they had no recorded data regarding tumor size, regional nodal or distant metastatic disease status (Fig 1, TxNxMx). Thus, 4704 cases with data from at least one of the T, N or M categories (Any TNM) were further analyzed. Previously published principles12, 13 for development of cancer staging systems were used.
For patients presenting with distant metastatic disease (M1; n=277), nodal and primary tumor status are not relevant for staging and these cases were therefore removed from subsequent T and N sub-staging analyses. Patients for whom no distant metastatic data were recorded (Mx; n=1655) were assumed to have negative metastatic disease status because their survival curves were essentially identical to those with no distant metastatic disease (M0; n=2772; data not shown). Thus, patients who did not have documented distant metastatic disease (Mx + M0; n=4427) were then analyzed for nodal status and prognosis (Fig 1). Patients with no nodal disease (N0; n=2356) were further analyzed for the effect of primary tumor size on survival. Complete staging does not necessarily require all types of data (eg, local tumor data is not required to fully stage cases presenting with nodal or distant metastatic disease). The total number of cases with ≥ 5 years follow-up that could thus be staged was 2856.
Primary tumor size (maximum tumor dimension by pathologic or clinical report) was recorded by the NCDB in millimeters up to 70 (larger tumors were also recorded as 70mm). In the NCDB, if both pathologic and clinical primary tumor size were present in the patient’s chart, pathologic size superseded and was entered into the database. Patients were considered to have clinical evaluation only (clinically staged) for their lymph nodes if the “number of nodes examined” by pathology was zero or was not stated. Patients were considered to have pathologic evaluation (pathologically staged) for their lymph nodes if the “number of nodes examined” was one or greater.
The NCDB captures overall survival data but does not record information regarding the cause of death. Given the median age at diagnosis (76 years; Table 1), a large fraction of deaths in this cohort would therefore be expected to result from non-MCC causes. We therefore adjusted survival data using age- and sex-matched life expectancy information from the National Center for Health Statistics. The fraction of MCC cohort survival relative to expected survival was calculated at each time point to determine “percent relative survival”. Statistical comparisons of relative survival were based on a proportional excess hazard model as previously described14.
For each patient, the associated population probability of surviving the next 1–5 years after diagnosis was determined using U.S. life table data from the year 2000 census, matched to the patient’s age and sex, and obtained from the National Center for Health Statistics website (http://www.cdc.gov/nchs/data/statab/lewk3_2003.pdf). For any cohort of patients, the “expected” survival probability at years 1–5 after diagnosis is calculated as the average of the population-based probabilities for each patient in the cohort, with linear interpolation between annual time points. The “observed” survival probability is the standard Kaplan-Meier estimate of overall survival for the cohort. “Relative survival” is the ratio of the “observed” and “expected” survival probabilities at each point in time.
Comparisons of relative survival among groups were based on a proportional excess hazards model, such that the overall hazard of mortality is expressed as λ(t)=λe (t) + λd (t), where λe (t) is the “expected” mortality hazard and λd (t) is the excess mortality hazard due to a diagnosis of disease. Since survival is directly related to the (cumulative) hazard function as S(t)= exp{−Λ(t)}, a proportional hazards model for λd (t) is a model for the relative survival S(t)/Se (t). To implement this model we used the methods described in Dickman et al.17 where the observed number of deaths (d j) in an interval of follow-up time (y j) is treated as a Poisson random variable and the expected number of deaths (e j) in the interval is calculated from the U.S. life table data based on individual patient sex and age at diagnosis, We used SAS Proc Genmod to fit the model, with a user-specified link function ln(μj−e j) relating the Poisson mean (μ j) to a covariate model offset by ln(y j).
Results
The clinical and demographic characteristics of 10,020 MCC cases captured by the NCDB are shown in Table 1. Similar to smaller, previously reported cohorts1, 5, 15,16, men comprised the majority of cases (61%). The age at diagnosis was 50 years or older in 94% of MCC cases and the median age was 76. Head/neck presentation was the most common primary site (45%). Non-Caucasian ethnicities were under-represented in the MCC cohort (4%) as compared to their representation in the US population (18%), perhaps because of the protection afforded by increased skin pigmentation in these ethnicities. The majority of cases presented with local disease (66%) followed by nodal disease (27%) and distant metastatic disease (7%).
Extent of Disease at Presentation and Survival
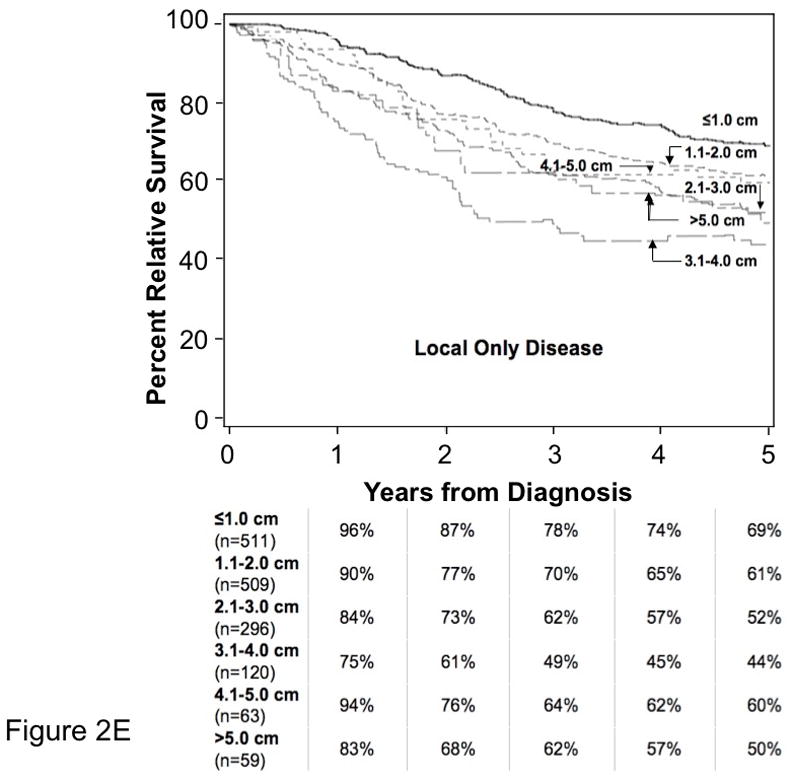
As shown in Figure 2A, observed survival for the MCC cohort (40% at five years) is lower than expected survival (75% at five years) based on age- and sex-matched US population data. To determine the increased mortality associated with an MCC diagnosis, we calculated percent relative survival as described above (Figure 2B). As shown in Figure 2C, MCC patients presenting with local disease had 64% relative survival at five years, those with regional nodal disease had 39% and patients presenting with distant metastatic MCC had 18% relative survival at five years. Figure 2D shows relative survival data for patients with local-only disease grouped by size using the existing AJCC T stages: ≤2.0 cm (T1), 2.1–5.0 cm (T2) and >5.0 cm (T3). Five-year relative survival was 66% among patients with local-only disease and primary tumor ≤2.0 cm vs. 51% for those with primary tumor 2.1– 5.0 cm (excess hazard ratio 1.77; 95% confidence interval 1.4–2.2; p< 0.0001). It is noteworthy that patients presenting with the smallest tumors (primary tumor diameter ≤ 1 cm, n = 511) had a 5-year relative survival of 69% that was only modestly better than the 61% 5-year relative survival of patients with tumors in the 1.1–2.0 cm range (n = 509). There was no survival difference between AJCC Tumor categories of 2.1–5.0 cm and >5.0 cm. Figure 2E shows 5-year relative survival data for all patients with local-only disease grouped by 1 cm increments in size. Primary tumor size in the local-only disease category affected relative survival only for tumors ≤ 4.0 cm. For larger tumors, correlation between size and survival was likely lost because patients presenting with regional nodal and distant metastasis were censored from this analysis and disproportionately presented with large primary tumors.
Figure 2. Overall and Relative Survival for Merkel Cell Carcinoma.


A. Using US census data from 2000 from the National Center for Health Statistics, expected survival (top line) was calculated for a population that was matched for both age and sex with that of the NCDB cohort of MCC patients with follow-up data (n=5823). The lower line represents observed survival for the MCC cohort. MCC-specific deaths cannot be directly determined as the NCDB does not capture data regarding cause of death. An approximation of MCC attributable deaths can be made by subtracting expected mortality for the age- and sex-matched population (non-MCC deaths) from the observed mortality in the cohort.
B. Relative survival for all stages of MCC. Percent relative survival was calculated as the ratio at each time point of observed survival in the MCC cohort to expected survival calculated from US census data.
C. Relative survival for MCC by extent of disease at time of diagnosis. Percent relative survival was calculated as in Panel B for patients with follow-up who presented with: Local disease (node-negative by clinical or pathologic exam and no distant metastatic disease; n=2356), regional nodal (node-positive by clinical or pathologic exam; n=937) and distant metastatic (n=277) disease.
D. Relative Survival by Primary Tumor Size. There were 1558 MCC cases that had available primary tumor size data, at least 5 years of follow-up, and presented with local disease (node negative by pathological or clinical evaluation and no known metastatic disease). These patients were grouped based on the existing AJCC T1-T3 stage categories as indicated in the figure (T4/deep extracutaneous cases were excluded from this analysis). Patients with primary tumors ≤2.0 cm (T1) fared better than tumors >2.0 cm (excess hazard ratio 1.77; 95% confidence interval, 1.4–2.2; p<0.0001). However, among patients with local-only disease, there was no survival difference between 2.1–5.0 cm (T2) and >5.0 cm (T3) groups.
E. Relationship of Primary Tumor Size to Relative Survival in MCC Patients with Local-only Disease.
Relationship of primary tumor size and survival is plotted for 1558 cases presenting with local-only disease (node negativity as determined by pathologic evaluation if available, or clinical evaluation if not). 84 cases whose primary tumor invaded bone, muscle, fascia or cartilage (T4) were excluded from this analysis. Tumor sizes were grouped into 1-centimeter increments, and relative survival was plotted over 5 years.
Clinical vs. Pathologic Lymph Node Staging
Among patients without distant metastatic disease, we determined whether there was a survival difference between those whose nodal status was determined by clinical evaluation (Fig. 3A) and those whose nodal status was determined by pathologic examination (Fig. 3B). Among patients with negative nodal disease, relative survival was worse for those who had only clinical nodal evaluation (Fig. 3A – cN0 group) compared to those who had pathologic confirmation of node negativity (Fig. 3B – pN0 group) (excess hazard ratio 1.80; 95% confidence interval, 1.4–2.4; p<0.0001). For patients with nodal disease, relative survival was worse for those who had clinically apparent nodal involvement (Fig. 3A – cN1) as compared to those who had pathologically proven nodal disease (Fig. 3B – pN1; both clinically apparent and occult nodal disease cases) (excess hazard ratio 1.48; 95% confidence interval, 1.1–1.9; p=0.004). 68% of MCC patients in this cohort did not have pathologic nodal evaluation as this was performed infrequently for MCC between 1986 and 1999.
Figure 3. Relative Survival by Nodal Status: Clinical vs. Pathologic Evaluation.

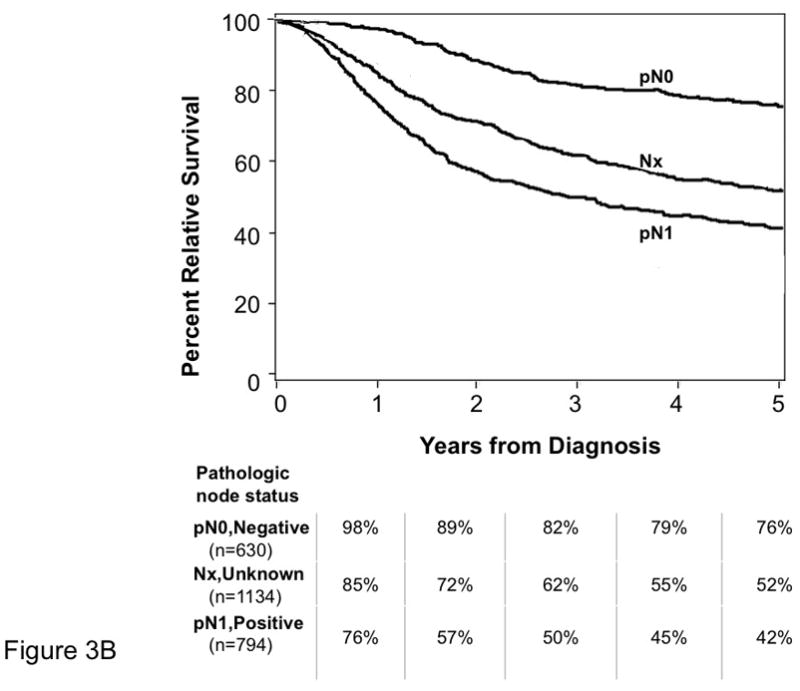
Age- and sex-adjusted percent relative survival curves are shown for all MCC patients that had ≥ 5 years of follow-up data and did not have distant metastatic disease (n=4427). Patients for whom no regional nodal data were available (1134 cases) are represented by the same curve (Nx) in both panels A and B. Pathologic node-negative status (pN0) was established either by elective lymphadenectomy or by sentinel lymph node biopsy. Pathologic node-positive status (pN1) was established by elective or therapeutic lymphadenectomy, fine needle aspirate, sentinel lymph node or other biopsy technique.
The age- and sex-adjusted excess hazard ratio comparing clinical node negative to pathologic node negative (top line in both panels) is 1.80 (95% confidence interval, 1.4–2.4, p<0.0001). The age- and sex-adjusted excess hazard ratio comparing clinical node positive to pathologic node positive (bottom line in both panels) is 1.48 (95% confidence interval, 1.1–1.9, p=0.004). There was very little overlap in data in this cohort for the method of nodal evaluation because patients had only clinical or pathologic nodal data recorded in the majority of cases. Specifically, 240 (5%) of the 4,427 cases included in this analysis had both pathologic and clinical nodal data recorded. These cases are included in the pathologic category (Panel B) and excluded from the clinical nodal analysis (Panel A) because pathologic data was considered to be more accurate.
Components of the New Staging System
The final Tumor, Node and Metastasis (TNM) category and stage groupings for MCC as to be used by tumor registrars17 are shown in Table 2. Whenever possible, TNM terminology was preserved from the 6th edition of the AJCC staging manual chapter “Carcinoma of the Skin”18 or adapted for use in MCC from the AJCC melanoma staging system19. Although there was no survival difference for T2 (2.1–5.0 cm) vs. T3 (>5.0 cm) tumors (Fig. 2D), these categories were preserved to allow the T4 category to represent tumors that invade deep structures as in other AJCC staging systems.
Table 2.
TNM Criteria and Stage Groupings of the New AJCC Staging System for Merkel cell carcinoma
| T | N | M |
|---|---|---|
|
Tx, Primary tumor cannot be assessed T0, No primary tumor Tis, In situ primary tumor T1, Primary tumor ≤ 2 cm T2, Primary tumor >2 but ≤ 5 cm T3, Primary tumor >5 cm T4, Primary tumor invades bone, muscle, fascia, or cartilage |
Nx, Regional nodes cannot be assessed N0, No regional node metastasis* cN0, Nodes not clinically detectable* cN1, Nodes clinically detectable* pN0, Nodes negative by pathologic exam pNx, Nodes not examined pathologically N1a, Micrometastasis** N1b, Macrometastasis*** N2, In-transit metastasis**** |
Mx, Distant metastasis cannot be assessed M0, No distant metastasis M1, Distant metastasis***** -M1a, distant skin, distant subcutaneous tissues or distant lymph nodes -M1b, lung -M1c, all other visceral sites |
| Stage | Stage Grouping | ||
|---|---|---|---|
| 0 | Tis | N0 | M0 |
| IA | T1 | pN0 | M0 |
| IB | T1 | cN0 | M0 |
| IIA | T2/T3 | pN0 | M0 |
| IIB | T2/T3 | cN0 | M0 |
| IIC | T4 | N0 | M0 |
| IIIA | Any T | N1a | M0 |
| IIIB | Any T | N1b/N2 | M0 |
| IV | Any T | Any N | M1 |
“N0” denotes negative nodes by clinical, pathologic or both types of exam. Clinical detection of nodal disease may be via inspection, palpation and/or imaging; cN0 is used only for patients who did not undergo pathologic node staging.
Micrometastases are diagnosed after sentinel or elective lymphadenectomy
Macrometastases are defined as clinically detectable nodal metastases confirmed pathologically by biopsy or therapeutic lymphadenectomy.
In-transit metastasis is a tumor distinct from the primary lesion and located either 1) between the primary lesion and the draining regional lymph nodes or 2) distal to the primary lesion.
Because there are no data to suggest a significant effect of M categories on survival in MCC, M1a-c are included in the same stage grouping.
The regional node (N) categories are in part defined by the method of nodal evaluation: pathologic vs clinical. For example, ‘nodes not clinically detectable’ is designated as cN0, while ‘nodes positive by pathologic exam’ is designated as either N1a (micrometastatic) or N1b (macrometastatic) as appropriate (Table 2). Similar to other AJCC staging systems, patients with nodal disease detected by pathologic examination but not detectable clinically have “micrometastatic” or N1a nodal disease. Those who have clinically apparent regional lymph node disease, confirmed by pathologic evaluation, have “macrometastatic” or N1b nodal disease. In-transit lymphatic disease was not included in any prior MCC staging system and is referred to as N2 in the new system (Table 2). Although not occurring in lymph nodes per se, as this represents clinically detectable lymphatic disease, it is included in stage IIIB together with macrometastatic nodal disease.
Distant metastatic disease (M status), was divided into 3 categories as in the staging of melanoma20,19, based on the site of metastasis: M1a – distant skin, distant subcutaneous tissues or distant lymph nodes; M1b – lung; M1c – all other visceral sites.
The final stage groupings and their relationship with percent relative survival over 5 years are summarized in Table 2 and Figure 4. The NCDB data show that the existing (if arbitrary) delineation of tumor sizes in the AJCC staging system is a significant predictor for survival at 5 years (≤2cm: 66% at five years; >2cm: 51%; p<0.0001). Sub-stages were created for stage I and stage II local disease based on the strong predictive effect of method of determining node negativity (59% survival for clinical staging vs 76% for pathologic staging at five years, p<0.0001). These sub-stages specify whether node-negative status was established by pathologic examination (IA and IIA) or only by clinical evaluation (IB and IIB). We attempted to determine whether there was a subset of MCC cases with significantly higher survival based on TNM criteria. Even among patients with the smallest primary tumors (≤ 1 cm) who had pathologically negative lymph nodes, 5-year relative survival was 81% (n = 128), nearly identical to all stage Ia patients who presented with a primary tumor ≤ 2.0 cm in diameter and pathologically negative nodes (79% relative survival, n = 266).
Figure 4. Relative Survival for MCC by Stage at Presentation in 2856 Patients.


Sufficient local, nodal and distant data were available for stage classification of 2856 MCC patients as summarized in Figure 1. Cases presenting with local disease (Panel A) or regional nodal/distant metastatic disease (Panel B) are shown by sub-stages with annual percent relative survival below each panel. Stages are as indicated directly on the survival curves except for Stage IIIA (microscopic node positive, clinical node negative) which could not be derived using the NCDB dataset as described in the Discussion section. The curve marked “IIIA*” represents pathologically node positive patients whose clinical node status was unknown (pN1, cNx). It is anticipated that true Stage IIIA patients with known clinically negative node status (pN1, cN0) may have better survival than the line marked “IIIA*” (pN1, cNx).
Stage IIC disease is a new sub-stage that includes patients with a deeply invasive primary (Table 2) whose nodal status was negative by either clinical or pathologic evaluation. As shown in Fig. 4A, stage IIC patients had a worse relative survival compared to those patients whose tumors did not invade deep structures. Stage III includes patients with either micrometastatic nodal disease or macrometastatic/in-transit disease (5-year relative survival, 42% vs 26%, respectively; p = 0.004).
Discussion
Here we present the prognostic analysis used to derive the first unified staging system for MCC. It is anticipated that this staging system, along with the recent introduction of 7 new MCC-specific diagnostic (ICD 9 CM) codes21 will aid in standardizing language used to describe MCC and its prognosis among patients, clinicians, and researchers. This staging system is the result of multidisciplinary consensus meetings that analyzed NCDB data from more than twenty times as many patients as any of the prior MCC staging systems.
Analysis of this dataset verified that primary tumor size (≤2 cm vs >2 cm) is predictive of survival and identified two aspects of nodal involvement that are highly significant for prognosis and are thus incorporated into the new staging system. These relevant characteristics of nodal disease are the method by which negative lymph node status was determined and whether involved lymph nodes were clinically apparent or only microscopically detectable. Pathologic staging of clinically uninvolved lymph nodes (for example, via sentinel lymph node biopsy) is important to accurately determine prognosis in MCC patients who present with local-only disease.
There are numerous differences among the five prior MCC staging systems and the new consensus system. Inclusion of 2.0 cm lesions with smaller tumors in stage I is consistent with the earlier AJCC system but differs from some of the prior staging systems that included 2.0 cm lesions with larger tumors. The new staging system now explicitly includes a stage IIC, for deeply invasive tumors (T4; invasion of bone, muscle, fascia, or cartilage) that carry a poorer prognosis than other localized disease categories (Figure 4A). In-transit metastases are now included as N2 (stage IIIB disease).
The most significant difference between the new system and the prior systems is that the method of determining negative node status will now be included. Overall, approximately one-third of MCC patients who only undergo clinical nodal evaluation are under-staged as they in fact have occult microscopic nodal involvement22. This difference is both clinically and statistically significant. It is clear, however, that many patients will not be staged pathologically for diverse reasons. Because the new staging system takes into account the best information available for each patient, it provides the most accurate possible prognostic data by not including patients whose nodes were negative by pathology together with patients who only had clinical node examination.
There are several limitations to the NCDB data set. The NCDB does not collect disease-specific survival data. Therefore, relative survival was calculated (see Methods). A limitation of this type of calculation is that it would over-estimate MCC-associated mortality if MCC patients have coexisting co-morbidities (such as profound immunosuppression) that can themselves augment mortality.
A further limitation of the data set is that clinical lymph node data were often not recorded in the past if pathologic lymph node data were available. This means that the NCDB does not provide a direct source of data for stage IIIA patients (micrometastatic nodal disease). Specifically, the survival of true stage IIIA patients is predicted to be somewhat better than the “Stage IIIA*” curve presented (Fig. 4B) as there was likely some inclusion of clinically node positive patients in this group. Nonetheless, survival of patients in the “IIIA*” group (42% at five years) is markedly better than the clinically node-positive IIIB group (26% at five years). This suggests that many of the patients in the IIIA* group likely had only microscopic nodal disease although this was not explicitly captured. This limitation will be less significant in future analyses as both clinical and pathologic node data are now being collected by the NCDB.
An additional limitation of the data set is that information on tumor recurrence was not available, meaning that disease-free survival could not be calculated. Prior study has indicated that the vast majority of MCC recurrences happen within the first three years after diagnosis8. Although NCDB did not provide information on MCC recurrences for this analysis, MCC-associated mortality in the current study becomes much less prominent in years four and five (Figure 4).
Future refinement of this new staging system will be dependent on the availability of additional parameters for analysis. Tumor registrars in the United States are already collecting more specific and detailed data on MCC patients than in the past. This information includes both clinical and pathologic data on regional lymph node status as well as the presence or absence of profound immune suppression. Additional new parameters planned to be captured for later analysis include tumor thickness, lymphovascular invasion23, tumor-infiltrating lymphocytes23, growth pattern of the tumor (circumscribed or infiltrative)23, and extracapsular extension/size of nodal tumor nests. A set of guidelines for pathologic evaluation of MCC has been developed by the College of American Pathologists and recommends capture of many of these features24.
In addition to traditional TNM-type staging, other prognostic systems may be useful in the future. These would include nomograms25, 26 that allow weighted integration of continuous variables based on their significance in multivariate analyses. Histologic or molecular features of MCC that are prognostically validated in the future could thus be incorporated. Such tools will likely exist in parallel with traditional TNM staging as their functions are complementary.
Acknowledgments
We thank Dr Leslie Sobin for thoughtful comments on the manuscript and staging system development. Supported by NIH K02-AR50993, American Cancer Society RSG-08-115-01-CCE, ACS-Jerry Wachter MCC Fund, NIH K24-CA139052, an unrestricted educational grant from Schering Pharmaceutical, Kenilworth, NJ, the David & Rosalind Bloom Endowment for MCC Research, and the UW MCC Patient Gift Fund.
Abbreviations
- MCC
Merkel cell carcinoma
- AJCC
American Joint Committee on Cancer
- SLNB
Sentinel lymph node biopsy
- NCDB
National Cancer Data Base
- US
United States
- ICD 9 CM
International Classification of Disease 9 Clinical Modification
Footnotes
AUTHORS’ DISCLOSURES OF POTENTIAL CONFLICTS OF INTEREST: The author(s) indicated no potential conflicts of interest.
Reprint requests should be made to pnghiem@uw.edu
This study was presented in part at the Second World Meeting of Melanoma Centers, Clearwater Florida, November 22, 2008.
Publisher's Disclaimer: This is a PDF file of an unedited manuscript that has been accepted for publication. As a service to our customers we are providing this early version of the manuscript. The manuscript will undergo copyediting, typesetting, and review of the resulting proof before it is published in its final citable form. Please note that during the production process errors may be discovered which could affect the content, and all legal disclaimers that apply to the journal pertain.
References
- 1.Hodgson NC. Merkel cell carcinoma: changing incidence trends. J Surg Oncol. 2005;89(1):1–4. doi: 10.1002/jso.20167. [DOI] [PubMed] [Google Scholar]
- 2.Lemos B, Nghiem P. Merkel cell carcinoma: more deaths but still no pathway to blame. J Invest Dermatol. 2007;127(9):2100–3. doi: 10.1038/sj.jid.5700925. [DOI] [PubMed] [Google Scholar]
- 3.Feng H, Shuda M, Chang Y, Moore PS. Clonal integration of a polyomavirus in human Merkel cell carcinoma. Science. 2008;319(5866):1096–100. doi: 10.1126/science.1152586. [DOI] [PMC free article] [PubMed] [Google Scholar]
- 4.Engels EA, Frisch M, Goedert JJ, Biggar RJ, Miller RW. Merkel cell carcinoma and HIV infection. Lancet. 2002;359(9305):497–8. doi: 10.1016/S0140-6736(02)07668-7. [DOI] [PubMed] [Google Scholar]
- 5.Heath ML, Jaimes N, Lemos B, et al. Clinical characteristics of Merkel cell carcinoma at diagnosis in 195 patients: the AEIOU features. J Am Acad Dermatol. 2008;58(3):375–81. doi: 10.1016/j.jaad.2007.11.020. [DOI] [PMC free article] [PubMed] [Google Scholar]
- 6.Yiengpruksawan A, Coit DG, Thaler HT, Urmacher C, Knapper WK. Merkel cell carcinoma. Prognosis and management. Arch Surg. 1991;126(12):1514–9. doi: 10.1001/archsurg.1991.01410360088014. [DOI] [PubMed] [Google Scholar]
- 7.Allen PJ, Zhang ZF, Coit DG. Surgical management of Merkel cell carcinoma. Ann Surg. 1999;229(1):97–105. doi: 10.1097/00000658-199901000-00013. [DOI] [PMC free article] [PubMed] [Google Scholar]
- 8.Allen PJ, Bowne WB, Jaques DP, Brennan MF, Busam K, Coit DG. Merkel cell carcinoma: prognosis and treatment of patients from a single institution. J Clin Oncol. 2005;23(10):2300–9. doi: 10.1200/JCO.2005.02.329. [DOI] [PubMed] [Google Scholar]
- 9.AJCC Cancer Staging Manual. 6. Chicago: Springer; 2002. [Google Scholar]
- 10.Clark JR, Veness MJ, Gilbert R, O’Brien CJ, Gullane PJ. Merkel cell carcinoma of the head and neck: Is adjuvant radiotherapy necessary? Head Neck. 2007;29(3):249–57. doi: 10.1002/hed.20510. [DOI] [PubMed] [Google Scholar]
- 11.Bilimoria KY, Stewart AK, Winchester DP, Ko CY. The National Cancer Data Base: a powerful initiative to improve cancer care in the United States. Ann Surg Oncol. 2008;15(3):683–90. doi: 10.1245/s10434-007-9747-3. [DOI] [PMC free article] [PubMed] [Google Scholar]
- 12.Greene FL, Sobin LH. A worldwide approach to the TNM staging system: collaborative efforts of the AJCC and UICC. J Surg Oncol. 2009;99(5):269–72. doi: 10.1002/jso.21237. [DOI] [PubMed] [Google Scholar]
- 13.Sobin LH. TNM: principles, history, and relation to other prognostic factors. Cancer. 2001;91(8 Suppl):1589–92. doi: 10.1002/1097-0142(20010415)91:8+<1589::aid-cncr1170>3.0.co;2-k. [DOI] [PubMed] [Google Scholar]
- 14.Dickman PW, Sloggett A, Hills M, Hakulinen T. Regression models for relative survival. Stat Med. 2004;23(1):51–64. doi: 10.1002/sim.1597. [DOI] [PubMed] [Google Scholar]
- 15.Agelli M, Clegg LX. Epidemiology of primary Merkel cell carcinoma in the United States. J Am Acad Dermatol. 2003;49(5):832–41. doi: 10.1016/s0190-9622(03)02108-x. [DOI] [PubMed] [Google Scholar]
- 16.Albores-Saavedra J, Batich K, Chable-Montero F, Sagy N, Schwartz AM, Henson DE. Merkel cell carcinoma demographics, morphology, and survival based on 3870 cases: a population based study. J Cutan Pathol. 2009 doi: 10.1111/j.1600-0560.2009.01370.x. [DOI] [PubMed] [Google Scholar]
- 17.Merkel Cell Carcinoma: Chapter 30, AJCC Cancer Staging Manual. 7. Chicago: Springer; In Press. [Google Scholar]
- 18.Carcinoma of the Skin (Excluding Eyelid, Vulva, and Penis) Chapter 23. Chicago: Springer; 2002. [Google Scholar]
- 19.AJCC Cancer Staging Manual. Chapter 24. Chicago: Springer; 2002. Melanoma of the skin; pp. 209–20. [Google Scholar]
- 20.Balch CM, Soong SJ, Gershenwald JE, et al. Prognostic factors analysis of 17,600 melanoma patients: validation of the American Joint Committee on Cancer melanoma staging system. J Clin Oncol. 2001;19(16):3622–34. doi: 10.1200/JCO.2001.19.16.3622. [DOI] [PubMed] [Google Scholar]
- 21.Iyer JG, Koba S, Nghiem P. Toward Better Management of Merkel Cell Carcinoma Using a Consensus Staging System, New Diagnostic Codes and a Recently Discovered Virus. Actas Dermosifiliogr. 2009;100(Supl 1):00–0. doi: 10.1016/s0001-7310(09)73378-2. [DOI] [PMC free article] [PubMed] [Google Scholar]
- 22.Gupta SG, Wang LC, Penas PF, Gellenthin M, Lee SJ, Nghiem P. Sentinel lymph node biopsy for evaluation and treatment of patients with Merkel cell carcinoma: The Dana-Farber experience and meta-analysis of the literature. Arch Dermatol. 2006;142(6):685–90. doi: 10.1001/archderm.142.6.685. [DOI] [PubMed] [Google Scholar]
- 23.Andea AA, Coit DG, Amin B, Busam KJ. Merkel cell carcinoma: histologic features and prognosis. Cancer. 2008;113(9):2549–58. doi: 10.1002/cncr.23874. [DOI] [PubMed] [Google Scholar]
- 24.Rao P, Balzer B, Lemos B, et al. Protocol for the Examination of Specimens from Patients with Merkel Cell Carcinoma of the Skin. College of American Pathologists. doi: 10.5858/134.3.341. In Press. [DOI] [PMC free article] [PubMed] [Google Scholar]
- 25.Eastham JA, Kattan MW, Scardino PT. Nomograms as predictive models. Semin Urol Oncol. 2002;20(2):108–15. doi: 10.1053/suro.2002.32936. [DOI] [PubMed] [Google Scholar]
- 26.Pal A, Provenzano E, Duffy SW, Pinder SE, Purushotham AD. A model for predicting non-sentinel lymph node metastatic disease when the sentinel lymph node is positive. Br J Surg. 2007 doi: 10.1002/bjs.5943. [DOI] [PubMed] [Google Scholar]