Abstract
Background
The objective of this work was to determine the clinical accuracy of GlucoMen®Day, a new microdialysis-based continuous glucose monitoring system (CGMS) from A. Menarini Diagnostics (Florence, Italy). Accuracy evaluation was performed using continuous glucose-error grid analysis (CG-EGA), as recommended by the Performance Metrics for Continuous Interstitial Glucose Monitoring; Approved Guideline (POCT05-A).
Methods
Two independent clinical trials were carried out on patients with types 1 and 2 diabetes mellitus, the glycemic levels of whom were monitored in an in-home setting for 100-hour periods. A new multiparametric algorithm was developed and used to compensate in real-time the GlucoMen®Day signal.
The time lag between continuous glucose monitoring (CGM) and reference data was first estimated using the Poincaré plot method. The entire set of CGM/reference data pairs was then evaluated following the CG-EGA criteria, which allowed an estimation of the combined point and rate accuracy stratified by glycemic ranges.
Results
With an estimated time lag of 11 minutes, the linear regression analysis of the CGM/reference glucose values yielded r = 0.92. The mean absolute error (MAE) was 11.4 mg/dl. The calculated mean absolute rate deviation (MARD) was 0.63 mg/dl/min. The data points falling within the A+B zones of CG-EGA were 100% in hypoglycemia, 95.7% in euglycemia, and 95.2% in hyperglycemia.
Conclusions
The GlucoMen®Day system provided reliable, real-time measurement of subcutaneous glucose levels in patients with diabetes for up to 100 hours. The device showed the ability to follow rapid glycemic excursions and detect severe hypoglycemic events accurately. Its accuracy parameters fitted the criteria of the state-of-the-art consensus guideline for CGMS, with highly consistent results from two independent studies.
Keywords: accuracy, continuous glucose monitoring, GlucoMen®Day, microdialysis
Introduction
Continuous glucose monitoring (CGM) provides a new perspective from which to view and represent the myriad perturbations that describe glucose metabolism.1
Continuous glucose monitoring is actually recognized as the only technique with the ability to provide complete diurnal/nocturnal glucose patterns and supply trend information.1,2 Several clinical studies have indicated that utilization of CGM data, both retrospectively and in real time, can help adjust insulin therapies, prevent (or minimize the occurrence of) extreme glycemic excursions,3,4 reduce glycated hemoglobin values,5,6,7 and achieve a tight glycemic control in both intensive care8,9 and surgical units.10
Despite these clear advantages, utilization of CGM techniques is still limited in the current clinical practice, mainly because of concerns about their accuracy, reliability, robustness, and patient tolerability. As a direct consequence, tremendous research efforts from both the scientific community and medical diagnostics companies have been devoted to the development of accurate, reliable, minimally invasive, and automated CGM systems (CGMSs).11,12
At present, the only CGM concepts that have been transformed into successful, commercially available products are those relying on electrochemical glucose biosensors. These devices can essentially be divided in two categories: implantable needle-type enzyme sensors on one hand, and systems based on the use of a micro-dialysis probe coupled with a glucose biosensor on the other.13–15
GlucoDay®S (A. Menarini Diagnostics, Florence, Italy) is currently the only CGMS available on the European market that relies on microdialysis technology.16,17 Preliminary results relative to the next generation device, “GlucoMen®Day” (A. Menarini Diagnostics, Florence, Italy), have been published.13,18 In comparison to its predecessor, the GlucoMen®Day system features a number of important improvements, in terms of sensor stability/lifetime, minimized bio- and electrochemical interferences, effectiveness of the signal processing algorithms and data management software, and extension of the monitoring period up to 100 hours.
This article presents, for the first time, the preliminary clinical results from two independent studies performed on patients with diabetes using the GlucoMen®Day CGMS. The clinical assessment for accuracy involved patients with both type 1 and type 2 diabetes mellitus (T1DM, T2DM), who were monitored in an in-home setting for 100-hour periods. Continuous glucose monitoring results were elaborated and presented using the continuous glucose-error grid analysis (CG-EGA) method, as recommended by the Performance Metrics for Continuous Interstitial Glucose Monitoring; Approved Guideline (POCT05-A).19
The accuracy parameters calculated for the GlucoMen®Day were also compared with those published by Kovatchev and coworkers,20 which described the performance of some of the most successful CGM devices available on the market.
Materials and Methods
The CGM data discussed in this article were collected during two independent clinical trials. The first one (protocol number GMD_02) was performed at the Center for Clinical Research (ZMF-CRC), Medical University of Graz (Austria), in the Autumn of 2008. The second study (protocol number: GMDCP06) is currently in progress at the Santa Maria della Stella hospital in Orvieto, Italy.
Subjects younger than 18 years old or older than 75, women who were pregnant or breastfeeding, individuals affected by severe acute and/or chronic diseases or skin diseases that could interfere with application of catheters and adhesives, subjects under treatment with anticoagulants or vasoactive drugs, and those currently participating in other clinical trials were excluded.
A total of 12 patients with diabetes were randomly enrolled within the patient population of each Center.
GMD_02 study (Graz): Patient population: 6 T1DM patients, 3 males, 3 females, (30 ± 5) years old, body mass index (25.1 ± 2.5) kg/m2.
GMDCP06 study (Orvieto): Patient population: 6 T2DM patients, 4 males, 2 females, (62 ± 11) years old, body mass index (25.6 ± 4.0) kg/m2.
Study Protocols
Patients from both studies were implanted with the GlucoMen®Day and monitored for up to 100 hours. Aside from clinic visits for device implantation and venous blood drawing, these subjects wore the GlucoMen®Day during their normal daily activities (at home, work, etc.).
Venous Blood Glucose Measurements
In-hospital venous blood sampling was performed at least once per day (in the morning) throughout the studies. At day 2 after implantation, the sampling frequency was increased to a blood drawing every 15 minutes over at least 2-hour postbreakfast or postmeal tolerance test. Such frequent sampling aimed to collect closely spaced glucose reference values suitable for the elaboration of CG-EGA. Plasma glucose levels were quantified by means of laboratory analyzers (a Beckman Glucose Analyzer II, Beckman Instruments Graz, Austria and a Cobas Analyzer, Roche Diagnostics, Orvieto, Italy).
Capillary Blood Glucose Measurements
All subjects were provided with a meter for the self-monitoring of blood glucose (SMBG) (Glucocard G meter, A. Menarini Diagnostics, Florence, Italy) and sensors. This meter allowed the collection of reference glycemic data that were employed for the retrospective calibration of CGM signals and for diabetes self-management purposes. Only capillary blood samples obtained from the fingerprint were used. Patients were required to self-test their capillary BG a minimum of six times per day, preferably shortly before and after the meals and once during the night.
The performance endpoint of these studies was the clinical assessment of both point and trend accuracy of GlucoMen®Day according to the POCT05-A Guideline 2008 by the Clinical and Laboratory Standards Institute (CLSI);19 the safety endpoint included an evaluation of the tolerability of the device.
The protocols of both studies (GMD_02 and GMDCP06) were evaluated and approved by the local ethical committees and by the Italian Ministry of Health; all subjects provided written informed consent.
The GlucoMen®Day System
GlucoMen®Day is a new generation microdialysis-based device that allows 100-hour continuous glucose monitoring in patients with diabetes. The device is intended for professional use only.
The GlucoMen®Day system consists of three components (Figure 1): (a) a disposable sensor kit (a fluidic circuit comprising a perfusion solution bag, a microdialysis probe, and a biosensor flowcell); (b) a recorder; and (c) a control unit.
Figure 1.
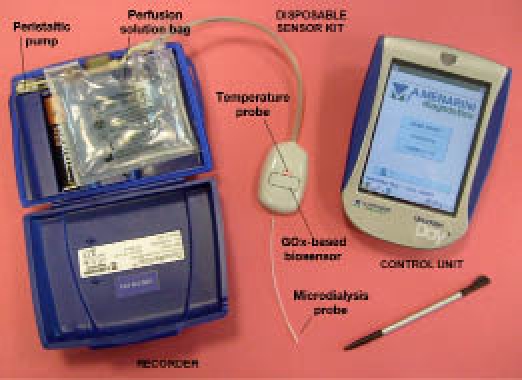
The GlucoMen®Day system.
The microdialysis probe is to be inserted in the peri-umbilical region of the patient using a splittable needle and remains implanted for the entire period of monitoring. Postinsertion sampling of interstitial glucose is achieved by means of the circulating perfusion solution (NaCl 136.9 mM, KCl 2.7 mM, KH2PO4 1.5 mM, Na2HPO4 8.1 mM, C6H5COONa 6.9 mM, Tween™80 0.4 mM). The glucose-enriched dialysate is then delivered to the biosensor flowcell (affixed to the abdomen of the patient) where a GOx (glucose oxidase)-based amperometric biosensor generates an electrical current proportional to the glucose concentration. The reaction generating such an electrical current thus occurs in the flowcell and not underneath the patient's skin, as in the case of needle-type glucosensors.
The heart of the GlucoMen®Day system is a screen-printed electrochemical cell where the carbon-based working electrode is modified with GOx and Prussian Blue as the redox mediator.13 The Prussian Blue mediator allows electrocatalytic reduction of hydrogen peroxide at −20 mV vs. Ag/AgCl pseudoreference electrode, an optimized potential where the possible interference of endogenous and exogenous species (including ascorbic acid, paracetamol, dopamine, and uric acid) is further minimized. Hence, the biosensor architecture of the GlucoMen®Day combines the high specificity of GOx toward glucose with a substantial electrochemical immunity against most of the common redox interferents.
The recorder (positioned around the patient's waistline using a specific belt) is controlled by a palm-size device via wireless radio frequency connection (Bluetooth®). Raw GlucoMen®Day data (an electrical current) is converted into a glucose value after calibration of the signal against SMBG data obtained about two hours postimplantation. Thereafter, only a single recalibration of the signal per day is required. Both raw current data and recalibrated glycemic values can either be displayed in real time or downloaded and visualized retrospectively. Raw data are averaged over 60 seconds, which means that the resulting CGM profile is formed by discrete values at 1-minute intervals.
Even though available in the data management software, the alarms for hypo- and hyperglycemic events were not actively used during these studies.
Key features and technical specifications of the GlucoMen®Day are summarized in Table 1.
Table 1.
GlucoMen®Day Features and Specifications
| Feature | Technical specification | |
|---|---|---|
| No maintenance | Disposable sensor kit | |
| No risk of cross-contamination | ||
| Compact and comfortable to wear | Dimensions (recorder) | 112 × 84 × 29 mm |
| Weight (recorder) | 170 g | |
| Minimally invasive | Microdialysis probe diameter/cutoff | 0.8 mm/6 kDa |
| High sensor stability | Monitoring time | 100 h (~5 days) |
| Calibration frequency | 1/day | |
| Accurate tracking of rapid glucose excursions | Measuring frequency | 1/min |
| Lag-phase (instrumental delay) | <2 min | |
| Early available glucose readings | Run-in time | ~2 h |
| Detection of severe hypoglycemic events | Glucose range | 5–600 mg/dl (0.3–33 mmol/liter) |
| Real-time display of glycemic values | Available | |
| Alarms for hypo- and hyperglycemic events | Available | |
| Automatic identification of stable signal regions for optimal calibration | Available | |
Signal Compensation Algorithm
The GlucoMen®Day features a dedicated signal management algorithm that, acting in real time on the raw data, provides a final output compensated for electrical/mechanical perturbations, temperature fluctuations, enzyme inactivation (“drift”), and nonlinearity. Detailed analytical descriptions of each component of this algorithm cannot be disclosed because of a patent under preparation.
The way the compensation algorithm acts on the signal is schematically depicted in Figure 2. The raw signal (1 electrical current datum/second) is subjected to a first filtering process (“clipping”), which suppresses all abnormally rapid signal variations. The signal is then averaged over 60 seconds, yielding a data set on which both the component of the algorithm that corrects the signal for temperature fluctuations and that compensating for enzyme inactivation, act in parallel. Following a further clipping, the signal is compensated for nonlinearity (if likely to correspond to glucose readings >400 mg/dl) and finally calibrated. As the final output, a continuous glucose signal (mg/dl, 1 datum/minute) is obtained.
Figure 2.
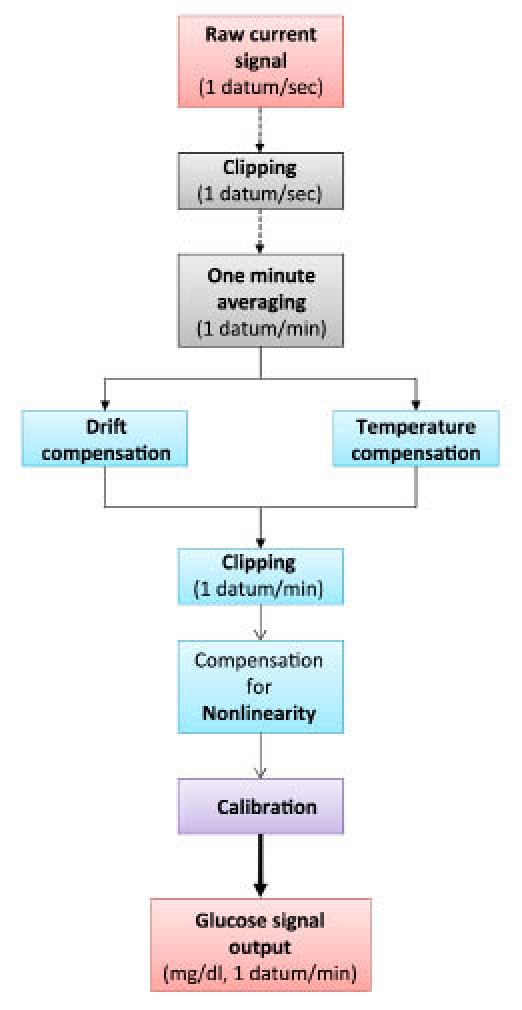
Signal processing flow-chart.
The different components of the algorithm were initially developed and validated for effectiveness using exclusively the CGM data collected during the GMD_02 study. The robustness of the algorithm was then confirmed by performing the retrospective analysis of the CGM data coming from the GMDCP06 study, employed as a cross-validation data set.
Data Analysis (Accuracy Metrics)
The clinical accuracy of the GlucoMen®Day was assessed by analyzing the differences existing between the glucose readings generated by the CGM device and the corresponding capillary and venous BG reference values. This analysis was preceded by the estimate of the characteristic time lag of the system, which was needed in order to take into account the well-recognized delay existing between reference and CGM data.21
As far as microdialysis-based devices are concerned, the total time lag has to be intended as the sum between physiological and instrumental delay. On one hand, the intercompartmental blood/interstitial fluid delay is commonly attributed to the time needed for glucose to diffuse across the transcapillary wall and/or interstitial fluid microconvection.21 On the other, the instrumental delay refers to the time needed for the glucose-enriched perfusate to go from the tip of the microdialysis probe to the biosensor flowcell.
Evaluation of the total time lag was done as suggested by Kovatchev and colleagues (Poincaré plot method), by rigidly shifting (delaying) the entire set of reference values with respect to the corresponding CGM profile by 1-minute steps.2 Delays ranging from 0 to 30 minutes were applied. For each applied delay, the “agreement criterion” (i.e., the Pearson correlation coefficient) between the resulting CGM/reference data pairs was then calculated. The time shift that allowed maximization of the agreement criterion (%) was identified as the system time-lag.
In order to confirm the consistency of the calculated value, the characteristic time lag of GlucoMen®Day was estimated by analyzing the data coming from Graz separately from those collected in Orvieto. The combined set of GMD_02 and GMDCP06 data was also analyzed.
With the system time-lag taken into account, accuracy of the CGM data was calculated considering both static and dynamic evaluation criteria.
In terms of static accuracy, the CGM/reference data pairs were elaborated in form of Clarke error grid analysis (EGA)22 and Bland-Altman bias plot.23,24 Other numerical parameters calculated to describe the point accuracy were mean and median absolute errors (MAE and MedAE), and mean and median absolute relative errors (MARE and MedARE). The absolute errors were evaluated as the absolute value of the difference between CGM and corresponding reference data. The absolute relative errors were evaluated as the absolute error expressed as a percentage of the reference value.20
Concurrently, the dynamic accuracy of GlucoMen®Day was evaluated using the CG-EGA, as suggested by the POCT05-A consensus guideline elaborated by the Clinical and Laboratory Standards Institute.19,25,26 The combined point and rate CG-EGA collapses the error grid zone into three groups—accurate readings, benign errors, and erroneous readings—and stratifies them by reference BG ranges based on both glucose data points in time and the rate of change of glucose. As numerical measures of the trend accuracy, the mean absolute rate deviation (MARD) and median absolute rate deviation (MedARD) were also calculated.
All data analyses were performed using software entirely developed by A. Menarini Diagnostics, Scientific & Technology Affairs Department (Florence, Italy).
Results
Besides the obvious dependence from glucose concentration, the signal recorded by continuous glucose sensors significantly depends on a number of biochemical and physical conditions, including the progressive inactivation of the surface-immobilized enzyme, temperature fluctuations, electrical interferences, mechanical instabilities of the implant, and surface biofouling, all having a relevant impact on the accuracy of the measurements.
Biofouling Issue
Biofouling and encapsulation (typical responses of the body to implanted foreign materials) are known to be critical issues for most of the needle-type CGMS.27,28 Formation and thickening of such mass-transfer barrier progressively reduce the glucose influx towards the electrodes. These processes, along with the progressive inactivation of the surface-immobilized enzyme (and other parallel events), are responsible for the so-called sensor “drift.”
Interestingly, the currently available set of data suggests that biofouling at the polyethersulfone/polyvinylpyrrolidone microdialysis fibre surface is a minor problem. In fact, the glucose recovery rate [(10 ± 3)%, depending on the quality of the implant, n = 12] was found to be nearly constant from the beginning to the end of the monitoring periods (100 hours in total). Such resistance of the microdialysis probe to the foreign body response was explained as follows. While circulating into the probe, small amounts of the perfusion solution are normally released into the subcutaneous tissue. It was, therefore, hypothesized that this solution might dilute all signaling chemicals and proteins that stimulate the foreign body reactions. Concurrently, the continuous leakage of liquid from the probe might inhibit the processes of protein and cell adhesion, which commonly lead to formation of the fibrous capsule.
Signal Processing
The raw signal profile measured by the GlucoMen®Day was assumed to be obtained by convolution of a “glucose-specific function” (strictly dependent upon the actual glycemic level) and a series of “interference functions,” one for each variable that was known to affect the output. The component of the output strictly dependent upon glucose concentration was, therefore, obtained through a real-time “deconvolution” process, where the contribution of each interference function was eliminated from the raw signal.
Temperature Fluctuations
Temperature plays a crucial role in the functionality of CGM systems, directly affecting the catalytic activity of the enzyme, the permeability of the microdialysis probe to glucose, and the water solubility of oxygen (essential cosubstrate of GOx).13 Temperature fluctuations unbalance the relative amounts of glucose and O2 reacting at the biosensor surface (even when the physiological level of glucose is stable), and can be, therefore, responsible for limited accuracy and reduced range of linear response.
Although the impact of temperature fluctuations on each aspect of the biosensing process was not individually verified, its overall effect on the output of GlucoMen®Day was extensively characterized in vitro. An empirical model describing the performance of the system was thus elaborated. The temperature probe (placed in close proximity of the biosensor flowcell, Figure 1) allowed real-time tracking of temperature fluctuations, and these were in turn used to compensate the signal.
Figure 3 illustrates how the component of the algorithm that compensates for temperature fluctuations works.
Figure 3.
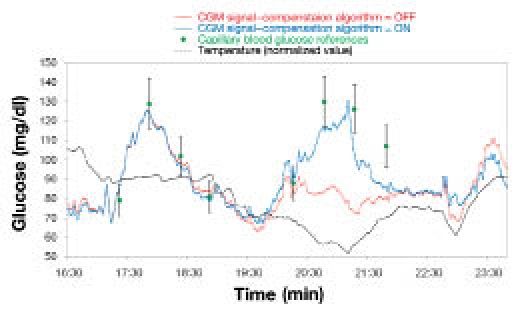
Correction of the CGM signal by means of the temperature-compensating algorithm.
In this case, the raw current profile (red line) significantly underestimated the glycemic peak corresponding to the meal since that raising of the bodily glucose levels occurred in concomitance with a rapid temperature decline. Application of the temperature-compensating algorithm in real time allowed a correction of the signal, thus substantially improving the accuracy of the CGM profile.
Electrical and Mechanical Interferences
All signal fluctuations that were unlikely to describe physiological events (because they are much faster than the fastest possible glycemic excursion in humans) were mathematically suppressed. Most of such fluctuations are thought to be associated with mechanical instabilities of the implant. Figure 4 illustrates how the “clipping” component of the algorithm works.
Figure 4.
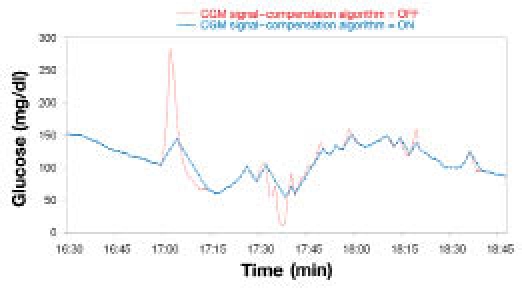
Correction of the CGM signal by means of the “clipping” algorithm.
Evaluation of Time Lag
The Poincaré plot analyses, performed for the GMD_02 study on one hand and the GMDCP06 study on the other, provided highly consistent results: time lags of 11 and 10 minutes, respectively. Please note that the closeness of the values obtained reflected the ability of the GlucoMen®Day system to generate accurate results as frequently as 1 glycemic datum/minute. The former time-lag value (11 minutes) also resulted from the analysis of the combined set of available data (i.e., 236 data pairs from 12 different patients, Figure 5) and was thus selected as the representative GlucoMen®Day time lag.
Figure 5.
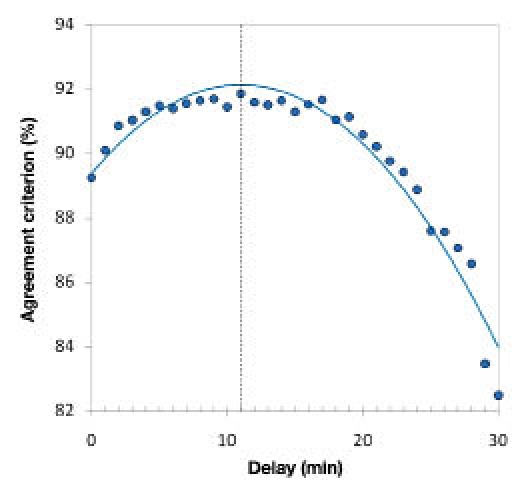
Agreement criterion (%) versus applied time delay. The maximum of the second-order polynomial function that fitted the obtained agreement criterion (%) values (blue curve) corresponds to the system time-lag.
Interestingly, when taking into account that the device features an instrumental lag of about 2 minutes, the estimated intercompartimental time-lag (blood/interstitial fluid, 9 minutes) fitted well with the values reported in the literature for needle-type CGM systems.2,21,29
Point and trend accuracy of GlucoMen®Day were thus calculated taking into account such time lag (i.e., for each patient, the full set of reference values was shifted 11 minutes forward in time with respect to the corresponding CGM signal).
Evaluation of Clinical Accuracy
Point and trend accuracy of the GlucoMen®Day system, as derived combining the results from two independent studies, was assessed according to the criteria dictated by the CLSI POCT05-A guideline. A total of 236 data pairs were used for the evaluation of the static accuracy parameters, while a subset of 120 pairs (suitably spaced from each other by 15 minutes) was employed for the evaluation of the dynamic accuracy.
A selected portion of a monitoring session and a full 100-hour glycemic profile are shown in Figures 6 and 7, respectively. These plots are illustrative of the key features of GlucoMen®Day: ability to follow rapid glycemic excursions, detect severe hypoglycemic events accurately, and provide reliable and stable CGM signals for up to 5 days.
Figure 6.
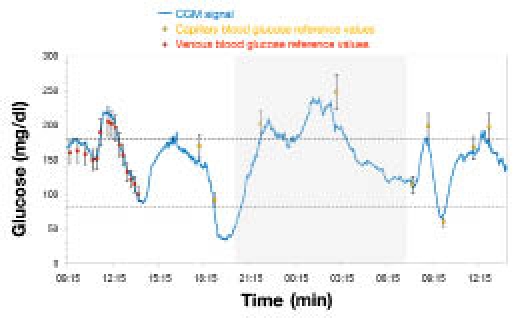
GlucoMen®Day CGM signal (portion).
Figure 7.
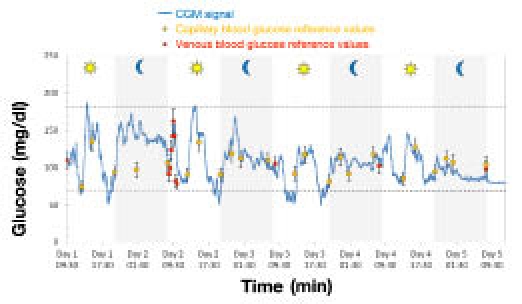
Typical 100-hour glyceemic profile obtained using the GlucoMen®Day system.
Static Accuracy
A Pearson correlation coefficient, r = 0.92, indicated a highly statistically significant linear relationship between the CGM data generated by GlucoMen®Day and the reference measurements.
In terms of bias plot, the total percentage of points falling within ±15 mg/dl (if <75 mg/dl) and ±20% (if ≥75 mg/dl) of the reference values was 90%, with a MAE of 11.4 mg/dl, a MedAE of 9.0 mg/dl, a MARE of 10.0% and MedARE of 7.0%.
The Clarke EGA analysis (Figure 8) showed 90% of points falling within the clinically accurate zone A, 10% of points within zone B where the errors lead to benign or no treatment, and no data (0%) within the clinically critical zones C, D, and E.
Figure 8.
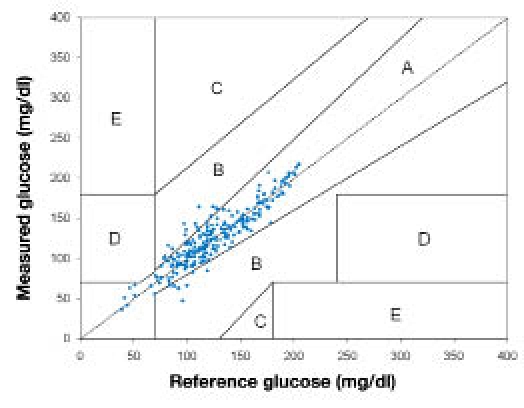
Clarke EGA of the combined GMD_02/GMDCP06 data (n = 236).
No direct correlation apparently existed between the benign errors observed in Figure 8 and temperature fluctuations; indirect effects, however, could not be excluded.
Dynamic Accuracy
The CG-EGA summary (Figure 9) illustrates the overall dynamic performance of the GlucoMen®Day system, stratified as a function of predefined BG ranges: hypoglycemia (BG ≤70 mg/dl), euglycemia (70< BG ≤180 mg/dl), and hyperglycemia (BG >180 mg/dl).
Figure 9.
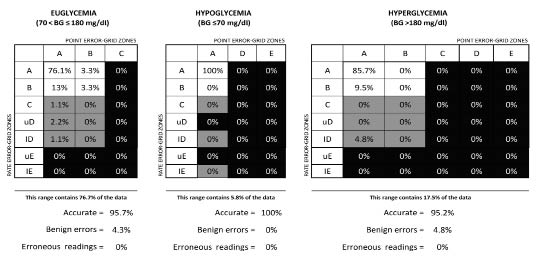
CG-EGA summary of the combined GMD_02/GMDCP06 data (n = 120).
Notably, the percentage of accurate determinations was higher than 95% in all glycemic ranges, with a minor fraction (<5%) of benign errors in the euglycemic and hyperglycemic ranges, and no (0%) erroneous readings. Particularly relevant from the clinical point of view is the excellent performance in hypoglycemia, the glucose level in which accurate CGM readings are particularly desirable.
The values of MARD and MedARD calculated over the entire glucose range (from hypo- to hyperglycemic levels) were 0.63 and 0.43 mg/dl/min, respectively.
For comparative purposes only, Table 2 shows the point and trend accuracy parameters of the GlucoMen®Day system (as calculated in the present paper) and the corresponding literature values for some of the most important commercially available CGM devices (data mainly from Kovatchev and colleagues20).
Table 2.
Comparison of Point and Trend Accuracy Parameters for Different Commercially Available CGM Devices
| Point accuracy – Euglycemia, 70 < BG < 180 mg/dl (3.9–10.0 mmol/liter)a | |||||||
|---|---|---|---|---|---|---|---|
| Guardian®b | DexCom STS®b | DexCom SEVEN PLUS®c | Navigator®b | GlucoDay®Sb | GlucoMen®Day | ||
| Mean absolute error | mg/dl | 16.4 | 22.3 | n.a.d | 16.0 | 15.7 | 11.9 |
| mmol/liter | 0.91 | 1.24 | n.a. | 0.89 | 0.87 | 0.66 | |
| Mean absolute relative error (%) | 15.2 | 21.2 | 15.0 | 15.3 | 15.6 | 10.4 | |
| Median absolute error | mg/dl | 14.8 | 19.1 | n.a. | 15.3 | 10.8 | 10.1 |
| mmol/liter | 0.82 | 1.06 | n.a. | 0.85 | 0.60 | 0.56 | |
| Median absolute relative error (%) | 13.3 | 18.4 | 13.0 | 11.8 | 10.7 | 7.7 | |
| % readings within ISO 15197 requirementse | 73.2 | 52.2 | 74.0 | 72.2 | 76.9 | 89.3 | |
| Point Accuracy – Hypoglycemia, BG ≥ 70 mg/dl [3.9 mmol/liter]f | |||||||
| Mean absolute error | mg/dl | 9.9 | 13.1 | n.a. | 6.5 | 8.5 | 7.4 |
| mmol/liter | 0.55 | 0.73 | n.a. | 0.36 | 0.47 | 0.41 | |
| Mean absolute relative error (%) | 16.1 | 21.5 | 25.0 | 10.3 | 17.5 | 14.2 | |
| Median absolute rrror | mg/dl | 7.6 | 11.52 | n.a. | 4.3 | 7.2 | 5.9 |
| mmol/liter | 0.42 | 0.64 | n.a. | 0.24 | 0.40 | 0.33 | |
| Median absolute relative error (%) | 13.8 | 22.5 | 20.0 | 7.4 | 15.6 | 9.6 | |
| % readings within ISO 15197 requirementse | 76.5 | 52.9 | n.a. | 79.4 | 83.0 | 80.0 | |
| Rate accuracy – Descent into hypoglycemia | |||||||
| Absolute rate deviation | mg/dl/min | 0.87 | 0.72 | n.a. | 0.66 | 1.74 | 0.75 |
| mmol/liter/h | 2.9 | 2.4 | n.a. | 2.2 | 5.8 | 2.5 | |
| Rate accuracy – Ascent from hypoglycemia | |||||||
| Absolute rate deviation | mg/dl/min | 0.90 | 0.99 | n.a. | 0.99 | 2.79 | 0.45 |
| mmol/liter/h | 3.0 | 3.3 | n.a. | 3.3 | 9.3 | 1.5 | |
DexCom SEVEN PLUS system assumes the euglycemic range to be 80–180 mg/dl (4.4–10.0 mmol/liter).30
Data from Kovatchev BP, Anderson S, Heinemann L, Clarke WL. Comparison of the numerical and clinical accuracy of four continuous glucose monitors. Diabetes Care. 2008;31:1160–4.20
Data from: SEVEN PLUS User Guide. Dexcom, Inc: San Diego, CA.30
n.a., data not available
Overall percentage of readings falling within ±15 mg/dl (if <75 mg/dl) and ±20% (if ≥75 mg/dl) of the reference values, according to the ISO 15197 accuracy requirements (bias plot).23 ISO, International Organization for Standardization.
DexCom SEVEN plus system defines as hypoglycemia BG levels ≥80 mg/dl (≥4.4 mmo/liter).30
What first emerges from this comparison is that the GlucoMen®Day system, with its innovative core biosensor technology and improved signal processing algorithm, features significantly higher accuracy levels than its predecessor GlucoDay®S, in both the hypoglycemic and the euglycemic range. Moreover, it also emerges that, while the general performance of the A. Menarini Diagnostics' product is in line with that of most of the systems, the accuracy parameters evaluated for the GlucoMen®Day in the hypoglycemic range often compare favorably with those of the other state-of-the-art CGM devices.
Conclusions
GlucoMen®Day, the new microdialysis-based CGM system from A. Menarini Diagnostics, allows accurate and real-time measurement of subcutaneous glucose levels in patients with diabetes for up to 100 hours (in-home setting). Its innovative biosensor technology follows rapid glycemic excursions and accurately detects severe hypoglycemic events. The embedded signal compensation algorithm further improves the clinical performance of the device, both in terms of accuracy and linearity.
The performance levels of the GlucoMen®Day fit the criteria of consensus guidelines for CGMS (POCT05-A), with highly consistent results from two independent studies. The dynamic accuracy parameters (evaluated by means of the CG-EGA), demonstrate how the clinical accuracy of GlucoMen®Day is significantly higher than that of the previous generation microdialysis-based device, GlucoDayS. Moreover, it also emerges that, while the general performance of the new device is in line with that of most of the commercially available needle-type glucose sensors, the accuracy parameters evaluated for the GlucoMen®Day in the hypoglycemic range often compare favorably with those of the other state-of-the-art CGM devices.
These results, presently based on a limited number of patients, are being consolidated through further clinical studies.
Acknowledgements
Center for Clinical Research (ZMF-CRC), Medical University of Graz, Austria; Dipartimento di Medicina, U.O. di Diabetologia ed Endocrinologia, Ospedale Civile di Orvieto (Italy).
Abbreviations
- BG
blood glucose
- CG–EGA
continuous glucose error grid analysis
- CGM
continuous glucose monitoring
- CGMS
continuous glucose monitoring system
- CLSI
Clinical and Laboratory Standards Institute
- EGA
error grid analysis
- GOx
glucose oxidase
- MAE
mean absolute error
- MARD
mean absolute rate deviation
- MARE
mean absolute relative error
- MedAE
median absolute error
- MedARD
median absolute rate deviation
- MedARE
median absolute relative error
- SMBG
self-monitoring of blood glucose
- T1DM
type 1 diabetes mellitus
- T2DM
type 2 diabetes mellitus
References
- 1.Mazze RS, Strock E, Borgman S, Wesley D, Stout P, Racchini J. Evaluating the accuracy, reliability, and clinical applicability of continuous glucose monitoring (CGM): Is CGM ready for real time? Diabetes Technol Ther. 2009;11(1):11–18. doi: 10.1089/dia.2008.0041. [DOI] [PubMed] [Google Scholar]
- 2.Kovatchev BP, Shields D, Breton M. Graphical and numerical evaluation of continuous glucose sensing time lag. Diabetes Technol Ther. 2009;11(3):139–143. doi: 10.1089/dia.2008.0044. [DOI] [PMC free article] [PubMed] [Google Scholar]
- 3.Chase HP, Kim LM, Owen SL, MacKenzie TA, Klingensmith GJ, Murtfeldt R, Garg SK. Continuous subcutaneous glucose monitoring in children with type 1 diabetes. Pedriatics. 2001;107(2):222–226. doi: 10.1542/peds.107.2.222. [DOI] [PubMed] [Google Scholar]
- 4.Schiaffini R, Ciampalini P, Fierabracci A, Spera S, Borrelli P, Bottazzo GF, Crinò A. The Continuous Glucose Monitoring System (CGMS) in type 1 diabetic children is the way to reduce hypoglycemic risk. Diabetes Metab Res Rev. 2002;18(4):324–329. doi: 10.1002/dmrr.309. [DOI] [PubMed] [Google Scholar]
- 5.Schaepelynck-Belicar P, Vague P, Simonin G, Lassmann-Vague V. Improved metabolic control in diabetic adolescents using the Continuous Glucose Monitoring System (CGMS) Diabetes Metab. 2003;29(6):608–612. doi: 10.1016/s1262-3636(07)70076-9. [DOI] [PubMed] [Google Scholar]
- 6.Garg SK, Schwartz S, Edelman SV. Improved glucose excursions using an implantable real-time continuous glucose sensor in adults with type 1 diabetes. Diabetes Care. 2004;27(3):734–738. doi: 10.2337/diacare.27.3.734. [DOI] [PubMed] [Google Scholar]
- 7.Tamborlane WV, Beck RV, Laffel L. Continuous glucose monitoring and type 1 diabetes. N Engl J Med. 2009;360(2):190–192. doi: 10.1056/NEJMc082243. [DOI] [PubMed] [Google Scholar]
- 8.De Block C, Manuel-y-Keenoy B, Van Gaal L, Rogiers P. Intensive insulin therapy in the intensive care unit: assessment by continuous glucose monitoring. Diabetes Care. 2006;29(8):1750–1756. doi: 10.2337/dc05-2353. [DOI] [PubMed] [Google Scholar]
- 9.Van den Berghe G, Wouters F, Verwaest C, Bruyninckx F, Schetz M, Vlasselaers D, Ferdinande P, Lauwers P, Bouillon R. Intensive insulin therapy in critically ill patients. N Engl J Med. 2001;345(19):1359–1367. doi: 10.1056/NEJMoa011300. [DOI] [PubMed] [Google Scholar]
- 10.Logtenberg SJ, Kleefstra N, Snellen FT, Groenier KH, Slingerland RJ, Nierich AP, Bilo HJ. Pre- and postoperative accuracy and safety of a real-time continuous glucose monitoring system in cardiac surgical patients: a randomized pilot study. Diabetes Technol Ther. 2009;11(1):31–37. doi: 10.1089/dia.2008.0028. [DOI] [PubMed] [Google Scholar]
- 11.Cameron FJ, Ambler GR. Does continuous monitoring have clinical utility in contemporary management of diabetes? J Ped Child Healt. 2004;40(3):79–85. doi: 10.1111/j.1440-1754.2004.00307.x. [DOI] [PubMed] [Google Scholar]
- 12.Shamoon H. Continuous glucose monitoring: the next step toward closing the loop. Diabetes Technol Ther. 2000;2(1):57–59. doi: 10.1089/152091599316748. [DOI] [PubMed] [Google Scholar]
- 13.Ricci F, Caprio F, Poscia A, Valgimigli F, Messeri D, Lepori E, Dall'Oglio G, Palleschi G, Moscone D. Toward continuous glucose monitoring with planar modified biosensors and microdialysis. Biosens Bioelectron. 2007;22(9–10):2032–2039. doi: 10.1016/j.bios.2006.08.041. [DOI] [PubMed] [Google Scholar]
- 14.Klonoff DC. A review of continuous glucose monitoring technology. Diabetes Technol Ther. 2005;7(5):770–775. doi: 10.1089/dia.2005.7.770. [DOI] [PubMed] [Google Scholar]
- 15.Wentholt IM, Vollebregt MA, Hart AA, Hoekstra JB, DeVries JH. Comparison of a needle-type and a microdialysis continuous glucose monitor in type 1 diabetic patients. Diabetes Care. 2005;28(12):2871–28716. doi: 10.2337/diacare.28.12.2871. [DOI] [PubMed] [Google Scholar]
- 16.Poscia A, Mascini M, Moscone M, Luzzana M, Caramenti M, Cremonesi P, Valgimigli F, Bongiovanni C, Varalli M. A microdialysis technique for continuous subcutaneous glucose monitoring in diabetic patients (part 1) Biosens Bioelectron. 2003;18:891–898. doi: 10.1016/s0956-5663(02)00216-6. [DOI] [PubMed] [Google Scholar]
- 17.Varalli M, Marelli G, Maran A, Bistoni S, Luzzana M, Cremonesi P, Caramanti G, Valgimigli F, Poscia A. A microdialysis technique for continuous subcutaneous glucose monitoring in diabetic patients (part 2) Biosens Bioelectron. 2003;18(7):899–905. doi: 10.1016/s0956-5663(02)00215-4. [DOI] [PubMed] [Google Scholar]
- 18.Ricci F, Moscone D, Tuta CS, Palleschi G, Amine A, Poscia A, Valgimigli F, Messeri D. Novel planar glucose biosensors for continuous monitoring use. Biosens Bioelectron. 2005;20(10):1993–2000. doi: 10.1016/j.bios.2004.09.010. [DOI] [PubMed] [Google Scholar]
- 19.Clinical and Laboratory Standards Institute. Performance Metrics for Continuous Interstitial Glucose Monitoring; Approved Guideline. www.clsi.org/source/orders/free/poct05-a.pdf Accessed on July 27, 2010.
- 20.Kovatchev BP, Anderson S, Heinemann L, Clarke W. Comparison of the numerical and clinical accuracy of four continuous glucose monitors. Diabetes Care. 2008;31(6):1160–1164. doi: 10.2337/dc07-2401. [DOI] [PMC free article] [PubMed] [Google Scholar]
- 21.Boyne MS, Silver DM, Kaplan J, Saudek CD. Timing of changes in interstitial and venous glood glucose measured with continuous subcutaneous glucose sensor. Diabetes. 2003;52(11):2790–2794. doi: 10.2337/diabetes.52.11.2790. [DOI] [PubMed] [Google Scholar]
- 22.Clarke WL, Cox D, Gonder-Frederick LA, Carter W, Pohl SL. Evaluating clinical accuracy of systems for self-monitoring of blood glucose. Diabetes Care. 1987;10(5):622–628. doi: 10.2337/diacare.10.5.622. [DOI] [PubMed] [Google Scholar]
- 23.ISO 15197:2003. In vitro diagnostic test systems: Requirements for bloodglucose monitoring systems for self-testing in managing diabetes mellitus. http://www.iso.org/iso/catalogue_detail.htm?csnumber=26309.
- 24.Bland JM, Altman DG. Statistical methods for assessing agreement between two methods of clinical measurement. Lancet. 1986;1(8476):307–310. [PubMed] [Google Scholar]
- 25.Kovatchev BP, Gonder-Frederick LA, Cox DJ, Clarke WL. Evaluating the accuracy of continuous glucose-monitoring sensors: continuous glucose-error grid analysis illustrated by TheraSense Freestyle navigator data. Diabetes Care. 2004;27(8):1922–1928. doi: 10.2337/diacare.27.8.1922. [DOI] [PubMed] [Google Scholar]
- 26.Clarke WL, Kovatchev BP. Continuous glucose sensors: continuing questions about clinical accuracy. J Diabetes Sci Technol. 2007;1(5):669–675. doi: 10.1177/193229680700100510. [DOI] [PMC free article] [PubMed] [Google Scholar]
- 27.Vaddiraju S, Tomazos I, Burgess DJ, Jain FC, Papadimitrakopoulos F. Emerging synergy between nanotechnology and implantable biosensors: A review. Biosens Bioelectron. 2010;25(7):1553–1565. doi: 10.1016/j.bios.2009.12.001. [DOI] [PMC free article] [PubMed] [Google Scholar]
- 28.Onuki Y, Bhardwaj U, Papadimitrakopoulos F, Burgess JD. A review of the biocompatibility of implantable devices: current challenges to overcome foreign body response. J Diabetes Sci Technol. 2008;2(6):1003–1015. doi: 10.1177/193229680800200610. [DOI] [PMC free article] [PubMed] [Google Scholar]
- 29.Kamath A, Mahalingam A, Brauker J. Analysis of time lags and other sources of error of the DexCom SEVEN continuous glucose monitor. Diabetes Technol Ther. 2009;11(11):689–695. doi: 10.1089/dia.2009.0060. [DOI] [PubMed] [Google Scholar]
- 30.SEVEN plus User Guide. http://c0850852.cdn.cloudfiles.rackspacecloud.com/SEVEN_Plus_Users_Guide.pdf.


