

Abstract
Background
Insulin secretion is pulsatile, and has been shown to be altered in both physiologic and pathophysiologic conditions. The identification and characterization of such pulses have been challenging, partially because of the low concentrations of insulin during fasting and its short half-life. Existing pulse detection algorithms used to identify insulin pulses either cannot separate hormone pulses into their secretory burst and clearance components, or have been limited by both the subjective nature of initial peak selection and a lack of statistical verification of bursts.
Methods
To address these concerns, we have developed AutoDecon, a novel deconvolution computer program.
Results
AutoDecon was applied to synthetic insulin concentration-time series modeled on data derived from normal fasting subjects and simulated to reflect several sampling frequencies, sampling durations, and assay replicates. The operating characteristics of AutoDecon were compared to those obtained with Cluster, a standard pulse detection algorithm. AutoDecon performed considerably better than Cluster with regard to sensitivity and secretory burst detection rates for true positives, false positives, and false negatives. As expected, given the short half-life of insulin, sampling at 30-second intervals is required for optimal analytical results. The choice of sampling duration is more flexible and relates to the number of replicates assayed.
Conclusion
AutoDecon represents a viable alternative to standard pulse detection algorithms for the appraisal of fasting insulin pulsatility.
Keywords: deconvolution, hormone pulsatility, insulin, software
Introduction
Insulin secretion is pulsatile and has been detected in vovo1,2 in perfused pancreas3 and in isolated islets.4–7 Such pulsatility typically evolves as rapid spikes with a duration of tens of seconds1,5,8 superimposed on one slower component exhibiting a duration of about 5 minutes or more1,2,9 and a second even slower and variable component with a greater than 60-minute duration.10,11 The slower components are typically detected in vovo, depending on the specific sampling frequency. This pulsatility may play an important physiological role in insulin action12 and is altered in patients with type 2 diabetes and their near relatives13–16 as well as under other pathophysiological conditions.17 However, in part because of the very low concentrations of insulin during fasting, the quantification of pulsatile insulin secretion has been a challenging undertaking.
A number of computer-assisted algorithms created to define hormone pulses, including those of insulin, have sought to identify and subsequently characterize perturbations within hormone concentration-time series.18 However, such methods fail to provide information about the secretory event and subsequent elimination functions known to underlie hormone pulses. To address this issue, a mathematical approach known as deconvolution has been employed to both identify and characterize hormone secretory burst activity, and simultaneously provide information about elimination.19,20 Such deconvolution procedures have been used to characterize the secretion of a number of hormones including insulin.7,18,21–25 However, despite their advantages over standard pulse detection techniques, these deconvolution procedures have inherent limitations, including the subjective nature of the choice of candidate secretory bursts, the lack of robust statistical verification of resolved pulses, and the user-unfriendly interface of the programs.
To address these concerns, we developed an automated deconvolution procedure known as AutoDecon.26,27 In this study, we analyzed and validated the performance of AutoDecon using synthetic fasting serum insulin concentration-time series, which were created by mimicking serum insulin concentration-time series obtained from normal fasting subjects. The synthetic time series were designed to reflect differing sampling intensities and sampling intervals, to simulate differing numbers of replicates within the assay system and measurement uncertainties of common assay systems.26,27 The operating characteristics of AutoDecon were then compared to those of Cluster,28 a standard pulse detection algorithm widely applied to analyze insulin pulsatility.
Methods
Description of AutoDecon
Building upon our original multiparameter deconvolution approach, Deconv,19 a novel and statistically valid automatic algorithm, AutoDecon, was developed.26,27 Previously published hormone pulsatility analysis approaches19,20,29 necessitate prior knowledge or presumption of the number of secretion events, and initial estimates of the secretion event positions and amplitudes are required to be provided by the user. Many require a fixed predetermined estimate of the elimination half-life(s). Finding the number of secretion events and initial parameter estimates is a system identification problem. In this regard, a quintessential data analysis dilemma is the identification and subsequent characterization of small pulsatile events within a concentration-time series where the amplitudes of these events are comparable to the magnitude of the experimental measurement errors. Event identification is further complicated when the pulsatile events are aperiodic (i.e., they occur at apparently random intervals) and/or when the experimental measurement uncertainties are heteroscedastic (i.e., the measurement uncertainties are variable). These issues are addressed via a fully automated and statistically based algorithmic approach, AutoDecon, which finds the optimal number of secretion events and initial parameter estimates while simultaneously performing deconvolution.
AutoDecon implements a rigorous statistical test for the existence of secretion events. In addition, the subjective nature defining the earlier deconvolution procedures is eliminated by the ability of the program to insert automatically and subsequently test the significance of presumed secretion events. No user intervention is required subsequent to the initialization of the algorithm. This automatic algorithm combines three modules: a maximum likelihood parameter fitting module,19,20,29 a new insertion module that automatically adds presumed secretion events, and a new triage module that automatically removes secretion events deemed to be statistically non-significant. The AutoDecon algorithm iteratively adds presumed secretion events, tests the significance of all events, and removes nonsignificant secretion events. The procedure is repeated until no additional secretion events are added. The specific details of this algorithm are outlined elsewhere.26,27
Description of Cluster
The Cluster28 pulse detection algorithm performs a sliding student's t-test to identify significant increases and decreases within the hormone concentration-time series. Nadirs are identified as a significant decrease followed by a significant increase, and peaks are identified as the regions between the nadirs.
Validation of AutoDecon
Collection of Serum Insulin Concentration-Time Series from Normal Women
Subjects. Seven healthy women (mean age 30.2 years) were studied at the Clinical Research Unit at the Institute of Endocrinology, Prague, Czech Republic. No subject had a history of diabetes, impaired glucose tolerance, thyroid dysfunction, or hyperprolactinemia. All women had normal thyroid function tests, serum prolactin, and serum testosterone concentrations. The mean body mass index was 20.1 (range 18.9–21.2 kg/m2). All women reviewed and signed consent forms approved by the Institutional Ethical Committee at the Institute of Endocrinology.
Protocol. After an overnight fast, an indwelling cannula was placed into a forearm vein and blood samples were obtained at 30-second intervals for 60 minutes. After each sample was obtained, 0.6 ml of saline was administered into the dead space, withdrawn, and discarded 10 seconds prior to the next sample collection.
Assays. Serum insulin was measured using an enzyme-linked immunosorbent assay (ELISA) (Roche Diagnostics GmbH, Mannheim, Germany). The sensitivity [minimal detectable concentration (MDC)] of the ELISA was 0.2 μU/ml and the intra- and interassay coefficients of variation (CV) were 1.5 and 4.9%, respectively, for a concentration of 5.93 ± 0.09 μU/ml.
Creation of Synthetic Serum Insulin Concentration-Time Series
Synthetic serum insulin concentration-time series were created to mimic the experimentally observed serum insulin concentration-time series and measurement uncertainties.26,27 The series were constructed in a manner such that the locations and sizes of the synthetic secretion events as well as the half-lives and the secretion standard deviations (SD) were known a priori.26,27 When these synthetic time series were analyzed with AutoDecon26,27 and Cluster,28 comparisons between the correct answers and those produced by the algorithms could be made, thus yielding true-positive and false-positive rates for each algorithm and for the specific hormone concentration-time series being considered.
Although the most common method for constructing synthetic concentration-time series involves simulating a series of secretion events based upon the average values, this approach incorrectly assumes that the parameters are not dependent upon one another (i.e., it assumes that they are orthogonal to each other) and that the parameters are normally distributed with known distribution characteristics. In fact, the size of a secretion event (modeled as a convolution integral) may depend on the size of the previous secretion event, the time elapsed since the previous event, and the elimination half-life, or may contain a circadian rhythm. In this study, the simulation of the synthetic series took these into account and included a description of the covariance between the hormone pulsatility parameters. It also assumed that distributions of the estimated parameters were log-normal.26,27
One thousand synthetic data sets (i.e., concentration-time series) were constructed to simulate each different sample collection protocol (i.e., samples obtained every 0.5, 1, and 2 minutes for 30, 60, and 120 minutes) and assay replicates (i.e., singlicates, duplicates, and triplicates). A realistic amount of Gaussian-distributed pseudo-random experimental observational error based upon the assay MDC and percentage CV was added to the simulated data.26,27 All combinations were subsequently analyzed with AutoDecon26,27 and Cluster.28
Data Analysis
The performance of each analytical method was determined by comparing method-identified peak locations with known locations for each peak in synthetic data. Identified secretion event locations within a ±3-minute time window of a simulated event were counted as true positives, but if more than one peak determined by the program fell into this window, only the first one of them was considered to be a true positive. Peaks identified that were outside the ±3-minute positive identification window of simulated events were counted as false positives. The true-positive detection rate was determined as the ratio of the true-positive count by each method to the total peaks found by the method. The false-positive detection rate was computed as the ratio of the false-positive count to total peaks found by the program. The true positive detection rate was equal to 100% minus the false positive detection rate. The sensitivity detection rate was determined as the ratio of the true-positive count by each method to the total number of simulated peaks within the synthetic data set. Finally, the false-negative detection rate was determined as the number of simulated secretory bursts that the program failed to identify divided by the number of simulated secretory bursts. The sensitivity detection rate was equal to 100% minus the false positive detection rate.
Results
Identification of Insulin Secretory Bursts/Pulses by AutoDecon and Cluster
The upper panel of Figure 1 shows a representative experimentally measured serum insulin profile obtained in a normal woman sampled at 1-minute intervals for 60 minutes and assayed in duplicate. The lower panel of Figure 1 depicts a representative synthetic serum insulin profile created to mimic the 1-minute sampling for the 60-minute protocol and assayed in duplicate. Synthetic insulin data sets were created to simulate concentration-time series sampled at 30-second, 1-, and 2-minute intervals for 30-, 60-, and 120-minute intervals and assayed as singlicates, duplicates, or triplicates. One thousand synthetic data sets were formulated for each of the 27 combinations of sampling intensities, intervals, and measurement replicates.
Figure 1.
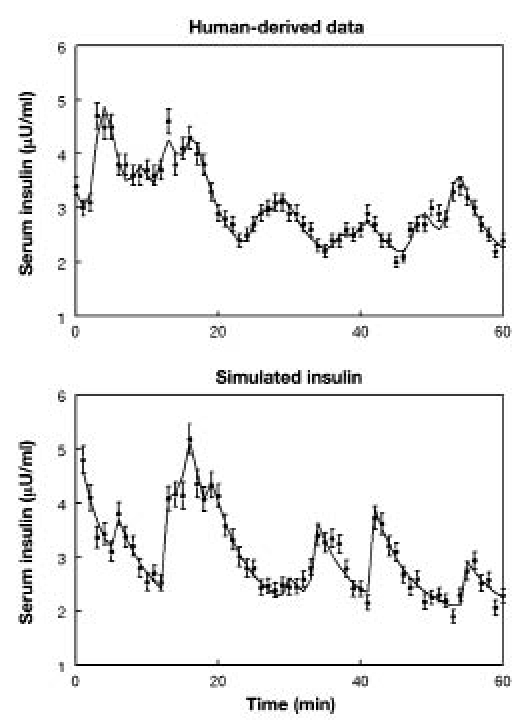
In the upper panel is shown a representative serum insulin concentration-time series obtained from a normal woman sampled at 1-minute intervals for 60 minutes. In the lower panel is depicted a synthetic insulin concentration-time series also representing 1-minute sampling for 60 minutes. The solid lines correspond to the calculated concentration based upon the analyses of the data sets by the AutoDecon algorithm. Intrasample SDs are shown as vertical lines through each data value. These SDs were calculated from the assay CVs and MDCs as the square root of the sum of squared contributions of the individual terms as described previously.26–27
To assess whether the specific pulses identified with AutoDecon26,27 and Cluster28 were identical to those created within the synthetic data series, four performance characteristics were appraised. Results are shown in Tables 1–4 as follows: Table 1, sensitivity rates (number of secretory bursts found by the program and known to be correct/number of secretory bursts simulated) for each of the sampling protocols; Table 2, true positive detection rates (number of secretory bursts found by the program and known to be correct/number of secretory bursts found by the program); Table 3, false positive detection rates (number of secretory bursts found by the program that were not correct/number of secretory bursts found by the program); and Table 4, false negative detection rates (number of secretory bursts known to be correct that the program failed to identify/number of secretory bursts known to be correct).
Table 1.
Median (± SEM) Percent Sensitivity Detection Rates for the Identification of Insulin Secretory Bursts Using the Two Analytical Methods AutoDecon and Cluster
| Sampling duration (min): | 30 | 60 | 120 | ||||
|---|---|---|---|---|---|---|---|
| Analytical method: | AutoDecon | Cluster | AutoDecon | Cluster | AutoDecon | Cluster | |
| Sampling frequency | Replicates | ||||||
| Every 30 seconds | Singlicates | 89.9 ± 0.52 | 57.7 ± 0.69 | 92.7 ± 0.35 | 60.7 ± 0.50 | 92.8 ± 0.34 | 60.9 ± 0.38 |
| Duplicates | 94.0 ± 0.90 | 63.3 ± 0.68 | 96.7 ± 0.24 | 66.7 ± 0.50 | 96.5 ± 0.21 | 65.7 ± 0.40 | |
| Triplicates | 96.2 ± 0.30 | 76.2 ± 0.58 | 97.7 ± 0.20 | 79.8 ± 0.43 | 98.1 ± 0.15 | 81.2 ± 0.33 | |
| Every 1 minute | Singlicates | 76.2 ± 0.85 | 47.4 ± 0.72 | 79.7 ± 0.65 | 50.1 ± 0.51 | 77.2 ± 0.69 | 48.6 ± 0.42 |
| Duplicates | 84.2 ± 0.75 | 51.9 ± 0.69 | 88.0 ± 0.55 | 76.6 ± 0.43 | 86.1 ± 0.58 | 56.8 ± 0.46 | |
| Triplicates | 87.5 ± 0.40 | 63.3 ± 0.68 | 91.2 ± 0.48 | 68.2 ± 0.49 | 90.4 ± 0.50 | 70.0 ± 0.41 | |
| Every 2 minutes | Singlicates | 34.1 ± 0.88 | 35.4 ± 0.69 | 41.9 ± 0.48 | 39.1 ± 0.47 | 44.5 ± 0.66 | 38.5 ± 0.38 |
| Duplicates | 36.3 ± 0.91 | 39.9 ± 0.71 | 52.4 ± 0.83 | 45.8 ± 0.49 | 52.9 ± 0.72 | 46.3 ± 0.41 | |
| Triplicates | 40.9 ± 1.10 | 45.4 ± 0.69 | 58.3 ± 0.30 | 52.5 ± 0.48 | 58.0 ± 0.74 | 54.6 ± 0.38 | |
Table 4.
Median (± SEM) Percent False Negative Detection Rates for the Identification of Insulin Secretory Bursts Using the Two Analytical Methods AutoDecon and Cluster.
| Sampling duration (min): | 30 | 60 | 120 | ||||
|---|---|---|---|---|---|---|---|
| Analytical method: | AutoDecon | Cluster | AutoDecon | Cluster | AutoDecon | Cluster | |
| Sampling frequency | Replicates | ||||||
| Every 30 seconds | Singlicates | 10.0 ± 0.52 | 42.2 ± 0.69 | 7.3 ± 0.35 | 39.3 ± 0.50 | 7.1 ± 0.34 | 39.0 ± 0.38 |
| Duplicates | 5.9 ± 0.39 | 36.6 ± 0.68 | 3.5 ± 0.24 | 33.2 ± 0.50 | 3.4 ± 0.21 | 34.2 ± 0.40 | |
| Triplicates | 3.7 ± 0.30 | 23.8 ± 0.58 | 2.3 ± 0.20 | 20.2 ± 0.43 | 1.9 ± 0.15 | 18.8 ± 0.33 | |
| Every 1 minute | Singlicates | 25.8 ± 0.85 | 52.6 ± 0.72 | 19.8 ± 0.65 | 49.6 ± 0.51 | 22.5 ± 0.67 | 51.2 ± 0.42 |
| Duplicates | 16.6 ± 0.75 | 47.5 ± 0.70 | 11.4 ± 0.54 | 22.9 ± 0.42 | 12.5 ± 0.55 | 43.0 ± 0.46 | |
| Triplicates | 11.2 ± 0.63 | 35.4 ± 0.68 | 8.1 ± 0.48 | 31.2 ± 0.49 | 9.3 ± 0.50 | 29.8 ± 0.41 | |
| Every 2 minutes | Singlicates | 64.4 ± 0.91 | 63.0 ± 0.71 | 57.2 ± 0.74 | 59.9 ± 0.48 | 55.1 ± 0.66 | 61.1 ± 0.38 |
| Duplicates | 63.7 ± 0.91 | 58.2 ± 0.72 | 46.8 ± 0.84 | 53.2 ± 0.49 | 46.7 ± 0.72 | 53.2 ± 0.42 | |
| Triplicates | 57.6 ± 1.00 | 52.6 ± 0.69 | 40.8 ± 0.85 | 46.3 ± 0.48 | 41.6 ± 0.74 | 44.8 ± 0.38 | |
Table 2.
Median (± SEM) Percent True-Positive Detection Rates for the Identification of Insulin Secretory Bursts Using the Two Analytical Methods AutoDecon and Cluster
| Sampling duration (min): | 30 | 60 | 120 | ||||
|---|---|---|---|---|---|---|---|
| Analytical method: | AutoDecon | Cluster | AutoDecon | Cluster | AutoDecon | Cluster | |
| Sampling frequency | Replicates | ||||||
| Every 30 seconds | Singlicates | 91.9 ± 0.45 | 79.4 ± 0.71 | 93.4 ± 0.33 | 80.6 ± 0.47 | 96.2 ± 0.18 | 80.1 ± 0.32 |
| Duplicates | 91.9 ± 0.48 | 84.9 ± 0.61 | 93.6 ± 0.33 | 83.9 ± 0.43 | 95.8 ± 0.20 | 89.0 ± 0.33 | |
| Triplicates | 91.4 ± 0.48 | 78.3 ± 0.61 | 93.8 ± 0.36 | 76.9 ± 0.45 | 96.5 ± 0.18 | 74.9 ± 0.31 | |
| Every 1 minute | Singlicates | 95.5 ± 0.46 | 89.9 ± 0.76 | 97.2 ± 0.22 | 93.5 ± 0.38 | 97.5 ± 0.16 | 90.8 ± 0.30 |
| Duplicates | 96.2 ± 0.33 | 94.4 ± 0.55 | 96.6 ± 0.24 | 83.7 ± 0.42 | 97.4 ± 0.15 | 93.8 ± 0.25 | |
| Triplicates | 95.3 ± 0.40 | 93.5 ± 0.46 | 95.6 ± 0.26 | 94.0 ± 0.30 | 97.0 ± 0.16 | 92.9 ± 0.24 | |
| Every 2 minutes | Singlicates | 80.7 ± 1.30 | 89.5 ± 0.95 | 97.2 ± 0.48 | 97.4 ± 0.30 | 99.4 ± 0.18 | 96.6 ± 0.26 |
| Duplicates | 80.0 ± 1.30 | 92.7 ± 0.80 | 98.7 ± 0.29 | 98.7 ± 0.24 | 99.5 ± 0.07 | 98.0 ± 0.17 | |
| Triplicates | 84.4 ± 1.10 | 96.9 ± 0.51 | 98.5 ± 0.30 | 99.0 ± 0.20 | 99.4 ± 0.01 | 98.6 ± 0.13 | |
Table 3.
Median (± SEM) Percent False-Positive Detection Rates for the Identification of Insulin Secretory Bursts Using the Two Analytical Methods AutoDecon and Cluster
| Sampling duration (min): | 30 | 60 | 120 | ||||
|---|---|---|---|---|---|---|---|
| Analytical method: | AutoDecon | Cluster | AutoDecon | Cluster | AutoDecon | Cluster | |
| Sampling frequency | Replicates | ||||||
| Every 30 seconds | Singlicates | 8.9 ± 0.43 | 19.8 ± 0.68 | 6.6 ± 0.33 | 19.4 ± 0.47 | 3.9 ± 0.18 | 19.9 ± 032 |
| Duplicates | 8.9 ± 0.48 | 15.0 ± 0.61 | 6.4 ± 0.33 | 16.1 ± 0.43 | 4.2 ± 0.20 | 18.1 ± 0.33 | |
| Triplicates | 8.6 ± 0.48 | 21.7 ± 0.61 | 6.2 ± 0.33 | 23.1 ± 0.45 | 3.5 ± 0.18 | 25.1 ± 0.31 | |
| Every 1 minute | Singlicates | 3.2 ± 0.31 | 7.1 ± 0.58 | 2.7 ± 0.20 | 6.5 ± 0.38 | 2.5 ± 0.16 | 9.2 ± 0.30 |
| Duplicates | 3.6 ± 0.30 | 4.3 ± 0.43 | 3.3 ± 0.22 | 16.3 ± 0.42 | 2.6 ± 0.15 | 6.2 ± 0.25 | |
| Triplicates | 4.1 ± 0.32 | 6.2 ± 0.44 | 4.3 ± 0.26 | 6.0 ± 0.30 | 3.0 ± 0.16 | 7.1 ± 0.24 | |
| Every 2 minutes | Singlicates | 0.38 ± 0.19 | 1.3 ± 0.31 | 0.55 ± 0.10 | 2.6 ± 0.30 | 0.33 ± 0.06 | 3.4 ± 0.26 |
| Duplicates | 0.40 ± 0.16 | 1.2 ± 0.29 | 0.46 ± 0.08 | 1.2 ± 0.22 | 0.51 ± 0.01 | 2.0 ± 0.18 | |
| Triplicates | 0.18 ± 0.11 | 0.92 ± 0.20 | 0.72 ± 0.11 | 1.0 ± 0.18 | 0.59 ± 0.01 | 1.4 ± 0.13 | |
Of interest, Tables 2 and 3 depict an interesting property of both AutoDecon and Cluster: a decrease of the sampling frequency typically led to an increase of the true-positive detection rate and a decrease of the false-positive detection rate. This reflects the fact that at lower sampling frequencies, the programs missed many peaks (lower sensitivity detection rate, Table 1), but most of those identified were true-positives.
In order to determine the optimal combination of operating characteristics for a given sampling protocol (i.e., where both sensitivity and true positive detection rates approach 100%, and false positive and false negative detection rates approach 0%), the absolute values representing the differences between actual values and these target values were calculated and expressed as the mean of each of the four operating characteristics (Table 5). Inspection of these values confirmed (1) that the choice of sampling protocol exerts a major effect on information that can be gleaned from the insulin concentration-time series and (2) that AutoDecon performs considerably better than Cluster in terms of maximizing both the sensitivity and true-positive detection rates and minimizing both false-positive and false-negative rates of detection. From these 54 protocols, the 6 that represent the top 10% exhibiting the smallest mean absolute values (and thus the best combination of the four operating characteristics) are listed in Table 6. All were analyzed with AutoDecon as opposed to Cluster. Although all 6 required 30-second sampling, the choice of sampling duration and the number of assay replicates were interdependent, an observation with potential implications on protocol cost, as discussed later.
Table 5.
Mean Absolute Values Representing the Differences between % Sensitivity and % True-Positive Secretory Burst Detection Rates Compared to 100% and between % False-Positive and % False-Negative Detection Rates Compared to 0% for Each of the 27 Sampling Protocols with Data Subsequently Analyzed with AutoDecon and Cluster
| Sampling duration (min): | 30 | 60 | 120 | ||||
|---|---|---|---|---|---|---|---|
| Analytical method: | AutoDecon | Cluster | AutoDecon | Cluster | AutoDecon | Cluster | |
| Sampling frequency | Replicates | ||||||
| Every 30 seconds | Singlicates | 9.03 | 31.2 | 6.95 | 29.4 | 5.50 | 29.5 |
| Duplicates | 7.73 | 25.9 | 4.90 | 24.7 | 3.83 | 44.4 | |
| Triplicates | 6.18 | 22.8 | 4.25 | 21.7 | 2.75 | 22.0 | |
| Every 1 minute | Singlicates | 14.3 | 30.6 | 11.4 | 28.1 | 12.6 | 30.3 |
| Duplicates | 9.95 | 26.4 | 7.53 | 19.7 | 7.90 | 24.6 | |
| Triplicates | 8.13 | 21.2 | 6.40 | 18.8 | 6.23 | 18.5 | |
| Every 2 minutes | Singlicates | 37.5 | 34.9 | 29.6 | 31.5 | 27.9 | 32.3 |
| Duplicates | 37.0 | 31.7 | 24.0 | 23.9 | 23.7 | 29.4 | |
| Triplicates | 29.3 | 27.8 | 21.2 | 24.0 | 21.2 | 23.3 | |
Table 6.
Rank Order of the Upper 10% of Sampling Protocols Exhibiting the Smallest Mean Absolute Values for % Sensitivity and True-Positive Secretory Burst Detection Rates Compared to 100% and for % False Positives and False Negatives Compared to 0%
| Rank order | Protocol | Mean absolute value | Mean absolute value | ||
|---|---|---|---|---|---|
| Sampling frequency (s) | Sampling duration (min) | Assay replicates | AutoDecon | Cluster | |
| 1 | Every 30 | 120 | Triplicates | 2.75 | 22.0 |
| 2 | Every 30 | 120 | Duplicates | 3.83 | 44.4 |
| 3 | Every 30 | 60 | Triplicates | 4.25 | 21.7 |
| 4 | Every 30 | 60 | Duplicates | 4.90 | 24.7 |
| 5 | Every 30 | 120 | Singlicates | 5.50 | 29.5 |
| 6 | Every 30 | 30 | Triplicates | 6.18 | 22.8 |
Characterization of Insulin Secretory Burst Properties by AutoDecon
In addition to identifying hormone secretory bursts, AutoDecon provides information about certain burst characteristics including mass and half-duration, and provides an estimate of the half-life of the hormone. Figure 2 shows the mean [± standard error of the mean (SEM)] attributes for mass (μU/ml), half-duration (minutes), and half-life (minutes) utilized to simulate the synthetic insulin secretory bursts compared to those recovered by analysis with AutoDecon. For both burst mass and half-duration and for the estimate of half-life, those recovered by AutoDecon were statistically indistinguishable from those parameters known to define synthetic insulin bursts.
Figure 2.
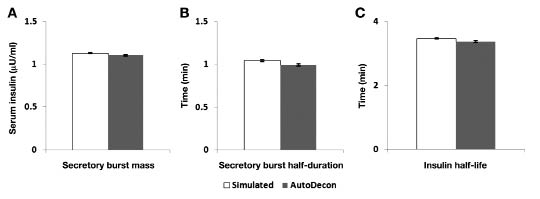
Mean (± SEM) insulin secretory burst mass (A), half-duration (B), and half-life (C) resolved with AutoDecon from synthetic insulin concentration-time series (n = 1000) in comparison to known values. No differences between the known values and those recovered by AutoDecon were detected (p > .0.5).
Discussion and Conclusion
Alterations in the pulsatile secretion of insulin have been reported in a number of clinical situations including in patients with type 2 diabetes,12,13,16 in the relatives of such patients,14 in obese children,10 and in patients with insulinoma.17 A variety of mathematical techniques have been applied to identify and characterize insulin pulses including several of the original computer-assisted pulse detection techniques such as Ultra,15,30 Pulsar,10 Detect,11,17 and Cluster.24,25 However, these earlier approaches to pulse detection are limited in that they characterize perturbations in hormone concentration-time series, but do not provide information about the secretory burst itself or about the elimination of the hormone. The more recent application of deconvolution procedures has allowed for the separation of insulin pulses into their constituent secretory burst and elimination components and has provided insights into insulin secretion not achieved previously.7,21–25 However, although providing significantly more information about the dynamics of insulin secretion than do the standard pulse detection methods, it has become increasingly recognized that the deconvolution techniques used19,20,29 have several limitations that have implications for both its application and its interpretation of results. In addition, the use of such analysis techniques has raised questions as to what constitutes optimal sampling and assay techniques. Thus, this study attempted to address concerns both about the deconvolution technique itself and about sampling/assay protocols employed to acquire appropriate data for analysis.
Previous multiparameter deconvolution procedures19,20,29 have significant limitations including the fact that Deconv requires the user to determine where potential secretory bursts may be located; does not have a rigorous, statistically-based process for retaining or eliminating prospective secretory bursts; and is inherently user-unfriendly in nature. To address these limitations, we developed a deconvolution procedure known as AutoDecon.26,27 This procedure is fully automated, thus eliminating the need to choose potential secretory bursts for consideration. Moreover, AutoDecon uses a statistical approach to test the significance of secretion events and is considerably more user-friendly than the previous algorithm. AutoDecon has been validated previously for the identification and characterization of both luteinizing hormone26 and growth hormone27 secretory bursts.
The second issue mentioned earlier, i.e., the need to define an optimal sampling and assay replicate protocol for insulin, is of both significant analytical and practical importance. Using a canine model, Pørksen and colleagues concluded that, in terms of secretory burst identification, sampling at 1-minute intervals was better than at 2-minute intervals, and that the sampling duration needed to be at least 40 minutes.24 However, no data were presented using a sampling frequency less than 30 seconds, an issue that assumes increased importance when it is recalled that the resolution of pulses into their constituent secretory burst and elimination components with deconvolution requires a sampling frequency of at least five times the estimated half-life of the hormone. Thus, if insulin has a half-life approaching 3 minutes, then an optimal sampling frequency could approach 30–60 seconds. To confound the issue further, although technically possible, such a sampling frequency would, in turn, place limitations on the duration of the sampling process given appropriate concerns about the amount of blood being taken during a clinical study. Moreover, the number of samples obtained raises assay cost issues, which relate directly to the number of replicates performed for a given sample. Thus, in addition to validating AutoDecon for use with insulin concentration-time series, we felt it prudent to obtain information about the operating characteristics of AutoDecon when applied to synthetic data series representing three sampling frequencies (30, 60, and 120 seconds), three sampling intervals (30, 60, and 120 minutes) and three assay replicates (singlicates, duplicates, and triplicates).
Having created the synthetic insulin concentration-time series to reflect the sampling frequency, duration, and assay replicate conditions described earlier, we assessed the operating characteristics of both AutoDecon and Cluster when used to analyze these data. Results clearly demonstrate that AutoDecon performs significantly better than Cluster in identifying secretory bursts. This was assessed on the synthetic data series by estimating four performance characteristics: sensitivity rate, true-positive detection rate, false-positive detection rate, and false-negative detection rate. The choice of sampling protocol is critical with regard to optimizing one or more of the four operating characteristics related to pulse detection and also undertaking clinical studies in a cost-effective manner. In terms of the operating characteristics, there may be situations where, for example, maximizing the sensitivity and true positive detection rates may be more desirable than minimizing the false-positive and false-negative rates of detection or vice versa. Data presented in Tables 1–4 provide guidance for these decisions to be made. For other studies, striking the best balance among all four operating characteristics may be the objective. As shown in Table 6, several of the sampling protocols that exhibited the best overall set of operating characteristics are presented. Of interest, the best performers all involved sampling at 30-second intervals and required analysis with AutoDecon rather than Cluster. However, these data suggest that there is some flexibility with regard to sampling duration and assay replicates, which may be important in terms of cost. For example, under one set of circumstances, it may be more cost effective to constrain the sampling duration to 30 minutes and run the samples as triplicates, whereas under different circumstances the cost of the assay may be substantially more than that related to the nursing/technical personnel who obtain the samples.
In summary, AutoDecon is a multiparameter deconvolution method that addresses a number of concerns raised about earlier deconvolution procedures. With regard to insulin secretion, it appears to perform considerably better than Cluster. Based on its operating characteristics, cost-effective insulin sampling protocols can be designed that will provide adequate information to address the particular issue of interest in a clinical protocol.
Abbreviations
- CV
coefficient of variation
- ELISA
enzyme-linked immunosorbent assay
- MDC
minimal detectable concentration
- SD
standard deviation
- SEM
standard error of the mean
References
- 1.Nunemaker CS, Zhang M, Wasserman DH, McGuinness OP, Powers AC, Bertram R, Sherman A, Satin LS. Individual mice can be distinguished by the period of their islet calcium oscillations: is there an intrinsic islet period that is imprinted in vovo? Diabetes. 2005;54(12):3517–3522. doi: 10.2337/diabetes.54.12.3517. [DOI] [PubMed] [Google Scholar]
- 2.Pørksen N. The in vovo regulation of pulsatile insulin secretion. Diabetologia. 2002;45(1):3–20. doi: 10.1007/s125-002-8240-x. [DOI] [PubMed] [Google Scholar]
- 3.Stagner JI, Samols E, Weir GC. Sustained oscillations of insulin glucagon, and somatostatin from the isolated canine pancreas during exposure to a constant glucose concentration. J Clin Invest. 1980;65(4):939–942. doi: 10.1172/JCI109750. [DOI] [PMC free article] [PubMed] [Google Scholar]
- 4.Beauvois MC, Merezak C, Jonas JC, Ravier MA, Henquin JC, Gilon P. Glucose-induced mixed [Ca2+]c oscillations in mouse beta-cells are controlled by the membrane potential and the SERCA3 Ca2+-ATPase of the endoplasmic reticulum. Am J Physiol Cell Physiol. 2006;290(6):C1503–1511. doi: 10.1152/ajpcell.00400.2005. [DOI] [PubMed] [Google Scholar]
- 5.Gilon P, Shepherd RM, Henquin JC. Oscillations of secretion driven by oscillations of cytoplasmic Ca2+ as evidenced in single pancreatic islets. J Biol Chem. 1993;268(30):22265–22268. [PubMed] [Google Scholar]
- 6.Longo EA, Tornheim K, Deeney JT, Varnum BA, Tillotson D, Prentki M, Corkey BE. Oscillations in cytosolic free Ca2+, oxygen consumption, and insulin secretion in glucose-stimulated rat pancreatic islets. J Biol Chem. 1991;266(14):9314–9319. [PubMed] [Google Scholar]
- 7.Ritzel RA, Veldhuis JD, Butler PC. The mass but not the frequency of insulin secretory bursts in isolated human islets is entrained by oscillatory glucose exposure. Am J Physiol Endocrinol Metab. 2006;290(4):E750–756. doi: 10.1152/ajpendo.00381.2005. [DOI] [PubMed] [Google Scholar]
- 8.Bergsten P. Slow and fast oscillations of cytoplasmic Ca2+ in pancreatic islets correspond to pulsatile insulin release. Am J Physiol. 1995;268(2 Pt 1):E282–287. doi: 10.1152/ajpendo.1995.268.2.E282. [DOI] [PubMed] [Google Scholar]
- 9.Pørksen N, Munn S, Steers J, Vore S, Veldhuis J, Butler P. Pulsatile insulin secretion accounts for 70% of total insulin secretion during fasting. Am J Physiol. 269(3 Pt 1):E478–488. doi: 10.1152/ajpendo.1995.269.3.E478. [DOI] [PubMed] [Google Scholar]
- 10.Radetti G, Ghizzoni L, Paganini C, Iughetti L, Caselli G, Bernasconi S. Insulin pulsatility in obese and normal prepubertal children. Horm Res. 1998;50(2):78–82. doi: 10.1159/000023238. [DOI] [PubMed] [Google Scholar]
- 11.Sonnenberg GE, Hoffmann RG, Johnson CP, Kissebah AH. Low- and high-frequency insulin secretion pulses in normal subjects and pancreas transplant recipients: role of extrinsic innervation. J Clin Invest. 1992;90(2):545–553. doi: 10.1172/JCI115893. [DOI] [PMC free article] [PubMed] [Google Scholar]
- 12.Matthews DR, Naylor BA, Jones RG, Ward GM, Turner RC. Pulsatile insulin has greater hypoglycemic effect than continuous delivery. Diabetes. 1983;32(7):617–621. doi: 10.2337/diab.32.7.617. [DOI] [PubMed] [Google Scholar]
- 13.Matthews DR, Lang DA, Burnett M, Turner RC. Control of pulsatile insulin secretion in man. Diabetologia. 1983;24(4):231–237. doi: 10.1007/BF00282705. [DOI] [PubMed] [Google Scholar]
- 14.O'Rahilly S, Turner RC, Matthews DR. Impaired pulsatile secretion of insulin in relatives of patients with non-insulin-dependent diabetes. N Engl J Med. 1988;318(19):1225–1230. doi: 10.1056/NEJM198805123181902. [DOI] [PubMed] [Google Scholar]
- 15.Polonsky KS, Given BD, Hirsch LJ, Tillil H, Shapiro ET, Beebe C, Frank BH, Galloway JA, van Cauter E. Abnormal patterns of insulin secretion in non-insulin-dependent diabetes mellitus. N Engl J Med. 1988;318(19):1231–1239. doi: 10.1056/NEJM198805123181903. [DOI] [PubMed] [Google Scholar]
- 16.Weigle DS. Pulsatile secretion of fuel-regulatory hormones. Diabetes. 1987;36(6):764–775. doi: 10.2337/diab.36.6.764. [DOI] [PubMed] [Google Scholar]
- 17.Berman N, Genter P, Chou HF, Cortez C, Bowsher R, Ipp E. Erratic oscillatory characteristics of plasma insulin concentrations in patients with insulinoma: mechanism for unpredictable hypoglycemia. J Clin Endocrinol Metab. 1997;82(9):2899–2903. doi: 10.1210/jcem.82.9.4195. [DOI] [PubMed] [Google Scholar]
- 18.Evans WS, Sollenberger MJ, Booth RA, Rogol AD, Urban RJ, Carlsen EC, Johnson ML, Veldhuis JD. Contemporary aspects of discrete peak-detection algorithms: II. The paradigm of the luteinizing hormone pulse signal in women. Endocr Rev. 1992;13(1):81–104. doi: 10.1210/edrv-13-1-81. [DOI] [PubMed] [Google Scholar]
- 19.Veldhuis JD, Carlson ML, Johnson ML. The pituitary-gland secretes in bursts: appraising the nature of glandular secretory impulses by simultaneous multiple-parameter deconvolution of plasma hormone concentrations. Proc Natl Acad Sci U.S.A. 1987;84(21):7686–7690. doi: 10.1073/pnas.84.21.7686. [DOI] [PMC free article] [PubMed] [Google Scholar]
- 20.Johnson ML, Virostko A, Veldhuis JD, Evans WS. Deconvolution analysis as a hormone pulse-detection algorithm. Methods Enzymol. 2004;384:40–54. doi: 10.1016/S0076-6879(04)84004-7. [DOI] [PubMed] [Google Scholar]
- 21.Juhl C, Grøfte T, Butler PC, Veldhuis JD, Schmitz O, Pørksen N. Effects of fasting physiologically pulsatile insulin release in healthy humans. Diabetes. 2002;51(Suppl 1):S255–257. doi: 10.2337/diabetes.51.2007.s255. [DOI] [PubMed] [Google Scholar]
- 22.Ritzel RA, Veldhuis JD, Butler PC. Glucose stimulates pulsatile insulin secretion from human pancreatic islets by increasing secretory burst mass: dose-response relationships. J Clin Endocrinol Metab. 2003;88(2):742–747. doi: 10.1210/jc.2002-021250. [DOI] [PubMed] [Google Scholar]
- 23.Song SH, Kjems L, McIntyre SM, Johnson ML, Veldhuis JD, Butler PC. Pulsatile insulin secretion by human pancreatic islets. J Clin Endocrinol Metab. 2002;87(1):213–221. doi: 10.1210/jcem.87.1.8181. [DOI] [PubMed] [Google Scholar]
- 24.Pørksen N, Munn S, Steers J, Veldhuis JD, Butler PC. Impact of sampling technique on appraisal of pulsatile insulin secretion by deconvolution and cluster analysis. Am J Physiol. 1995;269(6 Pt 1):E1106–1114. doi: 10.1152/ajpendo.1995.269.6.E1106. [DOI] [PubMed] [Google Scholar]
- 25.Meneilly GS, Ryan AS, Veldhuis JD, Elahi D. Increased disorderliness of basal insulin release attenuated insulin secretory burst mass and reduced ultradian rhythmicity of insulin secretion in older individuals. J Clin Endocrinol Metab. 1997;82(12):4088–4093. doi: 10.1210/jcem.82.12.4457. [DOI] [PubMed] [Google Scholar]
- 26.Johnson ML, Pipes L, Veldhuis PP, Farhy LS, Boyd DG, Evans WS. AutoDecon, a deconvolution algorithm for identification and characterization of luteinizing hormone secretory bursts: description and validation using synthetic data. Anal Biochem. 2008;381(1):8–17. doi: 10.1016/j.ab.2008.07.001. [DOI] [PMC free article] [PubMed] [Google Scholar]
- 27.Johnson ML, Pipes L, Veldhuis PP, Farhy LS, Nass R, Thorner MO, Evans WS. AutoDecon: a robust numerical method for the quantification of pulsatile events. Methods Enzymol. 2009;454:367–404. doi: 10.1016/S0076-6879(08)03815-9. [DOI] [PMC free article] [PubMed] [Google Scholar]
- 28.Veldhuis JD, Johnson ML. Cluster analysis: a simple versatile, and robust algorithm for endocrine pulse detection. Am J Physiol. 1986;250(4 Pt 1):E486–493. doi: 10.1152/ajpendo.1986.250.4.E486. [DOI] [PubMed] [Google Scholar]
- 29.Johnson ML, Veldhuis JD. Evolution of deconvolution analysis as a hormone pulse detection method. Methods Neurosci. 1995;28:1–24. doi: 10.1016/S0076-6879(04)84004-7. [DOI] [PubMed] [Google Scholar]
- 30.O'Meara NM, Sturis J, Herold KC, Ostrega DM, Polonsky KS. Alterations in the patterns of insulin secretion before and after diagnosis of IDDM. Diabetes Care. 1995;18(4):568–571. doi: 10.2337/diacare.18.4.568. [DOI] [PubMed] [Google Scholar]