

Abstract
Background
Successful insulin pump therapy depends on correct insulin doses based on an optimal total daily dose (TDD) and optimal pump settings for basal infusion, carbohydrate factor (CarbF), and glucose correction factor (CorrF) based on the TDD. There are limited data in the literature to guide providers and patients regarding methods to optimize these critical parameters for glucose control.
Methods
Anonymous data downloads from 1020 insulin pumps used throughout the United States and overseen by a variety of clinicians were analyzed retrospectively to find insulin doses that provided the best glucose control. A subset of 396 pumps was chosen for glucose data reliability, with over 85% of their glucose data directly entered from a meter. This subset was divided into tertiles based on glucose levels, and the low glucose tertile was analyzed to derive formulas for optimal insulin pump settings.
Results
An inconsistent clustering of pump settings was found for the CarbF and the CorrF. This was less pronounced when CarbFs and CorrFs were determined from the actual bolus doses delivered once adjustments were made to the initial dose calculations by users and, to a larger extent, internally by the bolus calculator itself. Common beliefs that hyperglycemia is related to less carb counting, fewer carb boluses, or delivery of less insulin per day were not substantiated in this data.
New or verified insulin dosing formulas presented include basal U/day = TDD × 0.48; CarbF = [2.6 × Wt(lb)]/TDD; and CorrF = 1960/TDD.
Conclusions
Insulin pump users cannot reap full benefit from their pump bolus calculator if the settings on which bolus doses are based are less than optimal. Our data show that CarbFs and CorrFs tend to be unevenly distributed, suggesting that these factors are not selected in a systematic manner through use of formulas. Poor glucose outcomes among insulin pump users appear to be related to pump setting errors and being relatively underinsulinized, even though those in poor control use more total insulin per day. We have developed a model with the hypothesis that improved glucose outcomes will result from the use of formulas to derive appropriate pump settings. Prospective validation of these concepts is needed.
Keywords: basal rate, carbohydrate factor, correction factor, insulin dose algorithm, insulin pump, total daily dose
Background
Insulin pumps are the most precise tools to achieve near-normoglycemia with a minimum of hypoglycemia in insulin-requiring diabetes. A pump's basal insulin suppresses excess gluconeogenesis and free fatty acids release and enables glucose transport in the fasting state. Carbohydrate (carb) boluses match carb intake via a carbohydrate factor (CarbF). A glucose correction factor (CorrF) compensates for deficits in basal delivery and carb boluses. Although entry of accurate carbo-hydrate intakes and glucose values can be problematic for pump wearers, their efforts for achieving normoglycemia will have greater impact when their pump settings have been optimized.
This article analyzes pump settings retrospectively, shows how pumps and users adjust the bolus calculator's recommendations for actual use, and derives new formulas to help clinicians select more optimal pump settings based on data downloads of pumps users in excellent glucose control.
A pump wearer's total daily dose (TDD) of insulin provides an essential guide from which basal and bolus doses can be determined. A variety of formulas that were at first empiric and later based on research conducted by single clinics have been proposed to derive pump doses from the TDD. Dr. Paul Davidson proposed the first formula for the CorrF in the mid 1980s. This straightforward formula, called the “1500 rule,” was based on his clinical experience with regular insulin among patients at his Atlanta clinic:
| (1) |
In 1994, Walsh and Roberts introduced a similar CarbF formula for multiple daily injections and insulin pumps.1 This “450 rule” was based on Walsh's clinical experience in San Diego with patients using regular insulin and paralleled the 1500 rule:
| (2) |
While accurate for average body weights and insulin sensitivity (IS), the 450 rule becomes less accurate with variations in body weight and IS. Modifications of the numerator in both formulas have been introduced over the years: 1800 and 2000 for the CorrF and 500 and 300 (for children) for the CarbF.
Davidson and colleagues2,3 were the first to publish a clinical study of pump settings among 167 well-controlled pump patients at their Atlanta, Georgia, clinic in 2003. With a mean of 48% of the TDD used for basal delivery, this retrospective clinical study derived a new formula for the CarbF and a new constant for the CorrF for their Atlanta-based patients:
| (3) |
| (4) |
In a 2007 clinical study of 31 patients on pumps and continuous glucose monitors King and Armstrong4 proposed alternative guidelines with a basal percentage that averaged 38% of the TDD. With the majority of the basal reduction occurring during the daytime hours, relatively strong CarbF and CorrF formulas were derived that produce larger bolus doses:
| (5) |
| (6) |
Currently, the Davidson and colleagues2,3 study formulas may be the most reliable, based on widespread clinical use. However, the constants of 2.8 and 1717 derived in the study [Equations (3) and (4)] may lack accuracy because
they are based on CarbF and CorrF settings found in pumps without considering whether the pump's dose recommendations were followed, and the percentage of patients who used their bolus calculators was not given;
the mean TDD was determined from only seven days of TDD doses prior to a clinic visit when each patient's hemoglobin A1c was at its lowest level below 7%;
the subjects lived in a single geographic location; and
the constants were derived using regression analysis of data that clearly had non-Gaussian distributions.3
Responding to the potential limitations of their data, we analyzed anonymous consecutive downloads from 1020 pumps collected during a routine pump software upgrade in 2007. We will first review a theoretical model for the CarbF and the CorrF and then derive more precise formulas for these factors and the daily basal dose.
Carbohydrate Factor Formula
Carbohydrate boluses cover meals and minimize post-meal glucose excursions. The CarbF, or insulin-to-carb ratio, measures how many grams of carb an individual is able to transport into insulin-sensitive cells per unit of insulin. The CarbF measures the efficiency of glucose transport and is directly related to an individual's IS. Individuals with different weights but the same IS will require identical carb boluses to transfer the same number of carbs.
A convenient way to derive an individual's CarbF is to find the average CarbF for people with an average IS and multiply this average CarbF by each individual's relative insulin sensitivity (RIS):
| (7) |
where K1 is a constant equal to the average CarbF for people with an average IS. The RIS for an insulin-deficient individual can be quickly estimated as the ratio between a TDD for someone with their weight who has an average IS and their own actual TDD:
| (8) |
Insulin sensitivity varies in different populations and will rise as glucose levels improve. Two large U.S. studies found mean IS values of 0.24 U/lb. (0.53 U/kg)3 and 0.245 U/lb. (0.54 U/kg) in well-controlled pump patients.5 Any insulin-deficient individual's RIS can then be determined by dividing an expected TDD for their weight (0.24 U/lb. × Wt[lb.]) by their actual TDD:
| (9) |
On this RIS scale, a value of 1.0 represents an average IS, less than 1.0 would be a decreased sensitivity, and greater than 1.0 would be an increased IS.
A CarbF formula can then be represented as
| (10) |
where K1 is a constant equal to average CarbF for people with an average IS and K1 is multiplied by the individual's RIS.
Correction Factor Formula
The CorrF measures how far an individual's elevated glucose concentration will fall in the blood and interstitial fluid per unit of insulin. Correction boluses are usually given to correct for deficits in basal or carb bolus delivery. The fall in glucose is inversely related to a person's weight, representing the size of their intravascular and interstitial space, and is inversely related to their IS, representing the ease with which glucose is transported into insulin-sensitive cells. Because “Wt/IS” equals the TDD, the CorrF is inversely related to the TDD:
| (11) |
where K2 is a constant, measured in mg/dl or mmol/U, sometimes referred to as a correction factor rule number (CorrF-RN), that equals the CorrF × TDD. It is commonly referred to as a 1500, 1700, 1800, or 2000 rule for mg/dl or as a 90, 100, or 110 rule for metric users.
Methods
In 2006 and 2007, the Smiths Deltec pump company offered a free software upgrade for their model 1700 Cozmo® insulin pumps. These pumps, used throughout the United States, presented a unique opportunity to analyze actual insulin pump use. Anonymous data were downloaded from 1020 consecutive, complaint-free Cozmo pumps during a software upgrade of a larger number of pumps. Weight, body max index, hemoglobin A1c levels, and personal data were unavailable within this anonymous data review.
A subset of 396 pumps was selected with these criteria: more than 28 days of consecutive data (average 73.8 days), more than 20 glucose readings (average 316 readings per pump), more than 85% of glucose readings entered directly from a CoZmonitor® meter (average 95.2% direct readings), and a TDD greater than 5 U. Excluded pumps included 7 (0.7%) with less than 20 glucose readings, 39 (3.8%) with less than 28 days of data, 17 (1.7%) not in use with a TDD less than 5 U, and 562 (55.1%) that had more than 15% of readings entered by hand.
Selected pumps were distributed into tertiles of 132 pumps each based on their mean glucose values. The low glucose tertile (GT), with a mean glucose of 144 mg/dl (8.0 mmol), was used to derive insulin dose formulas.
Results
Table 1 shows insulin use data for the entire group and each GT.
Table 1.
Insulin Use in Each Glucose Tertile (Mean Values)
| Group | All 396 Pumps | Low GT | Mid GT | High GT |
|---|---|---|---|---|
| Glucose mg/dl (mmol) | 184 (10.2) | 144 (8.0) | 181 (10.0) | 227 (12.6) |
| Blood glucose measurements/day | 4.38 | 4.73 | 4.41 | 4.01 |
| TDD U/day | 49.4 | 47.9 | 49.1 | 51.1 |
| Basal U/day (%TDD) | 23.4 (47.6%) | 22.8 (47.6%) | 23.1 (47.2%) | 24.3 (47.8%) |
| Carbohydrate bolus U/day (%TDD) | 20.4 (40.8%) | 20.9 (43.1%) | 20.4 (41.2%) | 19.8 (38.0%) |
| Glucose correction bolus U/day (%TDD) | 5.59 (11.6%) | 4.18 (9.0%) | 5.57 (11.6%) | 7.03 (14.2%) |
| # Carbohydrate bolus/Day | 4.14 | 4.07 | 4.20 | 4.14 |
| # Glucose correction bolus/day | 2.12 | 1.92 | 2.10 | 2.35 |
Basal Rates
The mean basal dose made up close to 48% of the TDD in all three tertiles, with an interquartile range (IQR) of 39.6% to 54.9% in the low GT. This makes it easy to approximate an individual's daily basal dose as
| (12) |
Carbohydrate Factor Results
In the low GT, carb boluses comprised 43.1% ± 11.4% of the TDD with an IQR of 35.6% to 51.2%, a median of 43.1%, and a range of 8.7% to 72.2%. When consistent use is defined as delivery of two or more carb boluses per day from the bolus calculator, 92.7% of the 396 pump wearers routinely used their pumps to calculate their carb boluses. This suggests that selection of an accurate CarbF setting is important to control.
Histograms for the distribution of CarbF numbers found in pumps compared to those actually used on a daily basis are shown in Figures 1 and 2.
Figure 1.
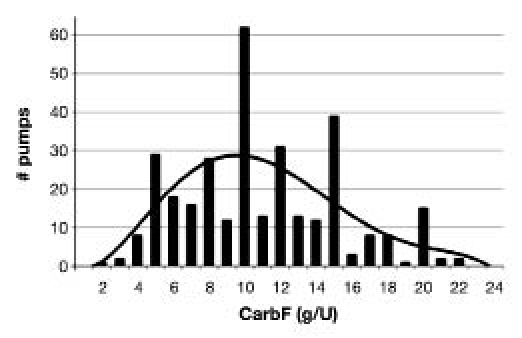
Carbohydrate factor settings found in pumps.
Figure 2.
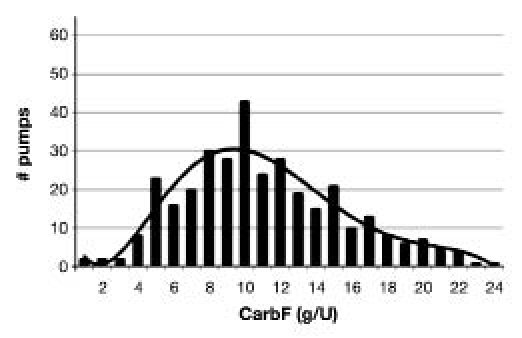
Carbohydrate factors actually used in pumps.
To compare pump CarbF settings versus actual carb bolus dose delivery, we calculated CarbFs from
Pump CarbFs (see Figure 1), an average of the CarbF settings in each pump (some used more than one CarbF per day), and
Actual CarbFs (see Figure 2), a mean of the carbo-hydrate grams entered per meal divided by the carb bolus taken for that meal over an average of 244 meals per pump.
The R2 goodness of fit for the distribution of mean pump CarbF settings was poor at 0.37, 0.37, and 0.39 for low, mid, and high GTs, respectively. (Values closer to 1.0 or −1.0 indicate that values have a better fit within a model generated from the data.) Despite the unexpected clustering found in pump CarbF settings, the distribution of actual CarbFs showed less clustering with an R2 of 0.81, 0.83, and 0.64 for the low, mid, and high GTs, respectively.
We investigated what caused actual bolus doses to differ from the pump's recommendation in the low GT. Most bolus calculator dose recommendations arose from internal adjustments from the bolus calculator itself, not user intervention. In the low GT, the bolus calculator reduced bolus recommendations by an average of 1.40 U/day to account for bolus insulin on board (BOB) and by another 0.27 U/day for hypoglycemia. (The bolus calculator also increased dose recommendations by 4.18 U/day for hyperglycemia.) In contrast, users reduced their bolus calculator's recommended doses by only 0.09 U/day and increased them by 0.56 U/day on average. Most of the protection against hypoglycemia as well as dose increases for hyperglycemia originated in the bolus calculator rather than from user intervention.
The mean values for pump CarbFs and actual CarbFs were considerably higher in the mid GT and high GT compared to the low GT, resulting in delivery of smaller carb bolus doses on average in those with more elevated glucose levels. The mean actual CarbF in the low GT was 10.8 g/U (Table 2), so the CarbF formula from Equation (10) becomes
Table 2.
Carbohydrate Bolus Data by Glucose Tertile (Mean Values)
| Group | All 396 Pumps | Low GT | Mid GT | High GT |
|---|---|---|---|---|
| Glucose mg/dl (mmol) | 184 (10.2) | 144 (8.0) | 181 (10.0) | 227 (12.6) |
| Pump CarbF | 11.5 | 10.7 g/U | 12.6 g/U | 11.1 g/U |
| Actual CarbF | 11.4 | 10.8 | 12.2 | 11.2 |
| Carbohydrate bolus U/day (%TDD) | 20.4 (40.8%) | 20.9 (43.1%) | 20.4 (41.2%) | 19.8 (38.0%) |
| Grams of carbohydrate/day | 189.9 | 185.2 | 196.3 | 187.9 |
| # Carbohydrate bolus/Day | 4.14 | 4.07 | 4.20 | 4.14 |
| (13) |
Correction Factor Results
In the low GT, correction boluses comprised 9.0% ± 5.4% of the TDD with an IQR of 6.2% to 11.3%, a median of 8.7%, and a range of 0% to 43.5%.
The R2 goodness of fit for the distribution of mean pump CorrF entries, shown in Figure 3, was 0.65, 0.50, and 0.45 for low, mid, and high GTs, respectively, while R2 for the actual CorrFs in Figure 4 showed some decrease in clustering at 0.71, 0.63, and 0.72 for low, mid, and high GTs, respectively.
Figure 3.
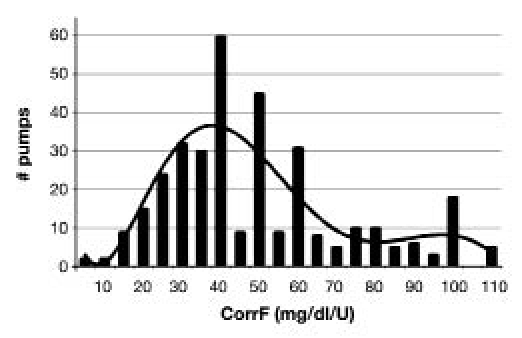
Correction factor settings found in pumps.
Figure 4.
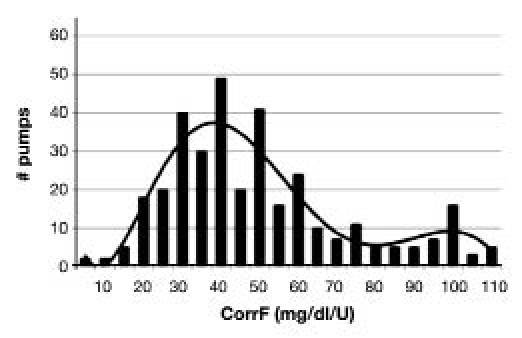
Correction factors actually used.
To determine an optimal CorrF-RN or K2, we derived a mean CorrF-RN by multiplying each individual's mean actual CorrF times their mean TDD. As shown in Table 3, K2 equaled 1960, so Equation (11) becomes
Table 3.
Correction Bolus Data by Glucose Tertile (Mean Values)
| Group | All 396 Pumps | Low GT | Mid GT | High GT |
|---|---|---|---|---|
| Glucose mg/dl (mmol) | 184 (10.2) | 144 (8.0) | 181 (10.0) | 227 (12.6) |
| Pump CorrF | 56.2 | 52.2 | 62.6 | 54.0 |
| Actual CorrF | 55.7 | 53.6 | 61.1 | 52.5 |
| Glucose correction bolus U/day (%TDD) | 5.59 (11.6%) | 4.18 (9.0%) | 5.57 (11.6%) | 7.03 (14.2%) |
| # Glucose correction bolus/day | 2.12 | 1.92 | 2.10 | 2.35 |
| Pump CorrF-RNa | 2210 | 1920 | 2360 | 2300 |
| Actual CorrF-RNa | 2160 | 1960 | 2360 | 2330 |
Mean of pump CorrF or actual CorrF times TDD for each individual.
| (14) |
For clinical use, K2 can be rounded to a 2000 rule.
Discussion
A non-Gaussian clustering was found for the CarbF and CorrF settings in insulin pumps, with a preference for “magic” numbers like 5, 10, and 15 g/U. This unexpected clustering of pump CarbFs and pump CorrFs (Figures 1 and 3) may be caused by retention of values previously used on multiple daily injections, by not changing the pump's default values, or by a preference among pump wearers or clinicians for numbers that are easy to use for manual calculations even though the pump performs these calculations automatically. Regardless of cause, many pump users base their bolus decisions on inappropriate pump settings that complicate the selection of appropriate bolus doses.
Even small changes in the pump CarbF impact glucose outcomes. For example, changing the pump CarbF from 1 U/10 g to 1 U/9 g lowers postmeal glucose levels by 32 to 53 mg/dl (1.8–2.9 mmol) per meal for carb intakes of 60 to 100 g in an 160 lb. individual with an average IS. The large gaps found between pump CarbF numbers in Figure 1 suggest that clinicians and pump wearers do not realize how small changes in the CarbF setting impact glucose values.6
Adaptation for inappropriate pump settings does occur. Actual CarbFs increase or decrease relative to pump CarbFs when the user changes the pump's bolus recommendation or when the pump's bolus calculator decreases a recommendation due to the presence of BOB or hypo-glycemia. As shown earlier, almost all dose reductions and protection against hypoglycemia in the low GT came from the pump's intervention rather than from that of the wearer, even though BOB was underestimated by the short average duration of insulin action (DIA) that was little changed from the pump's default value of 3 h. This emphasizes the importance of accurate pump settings for safety, particularly the DIA time that has the greatest impact on safety through automated dose reductions.
An individual's TDD provides their primary control over mean glucose levels, while use of formulas to derive appropriate pump settings from the TDD will impact fasting and postprandial glucose levels, as well as glucose stability. Most pump wearers have a TDD that is too low, as evidenced by the overall mean glucose of 184 mg/dl (10.2 mmol), with 68% having a mean glucose greater than 164 mg/dl (9.1 mmol). Even though average TDDs relative to the low GT were 1.2 U/day higher in the mid GT and 3.2 U/day higher in the high GT, these groups remain relatively underinsulinized.
Formulas for accurate settings are based on the TDD, therefore, using an accurate TDD is critical. Once an accurate TDD is known, an appropriate daily basal dose can be selected to control fasting glucose levels using Equation (12). This average of 48% of the TDD as basal will rise on low-carb diets and fall on high-carb diets. Carbohydrate factors and CorrFs can be derived using Equations (13) and (14). Our basal formula is identical to that found in the Davidson and colleagues2,3 study, while our bolus formulas provide approximately 8% larger carb boluses and 12% smaller correction boluses.
The mean pump CarbF in the low GT was lower at 10.7 g/U, compared to 1 U/12.6 g/U in the mid GT and 1 U/11.1 g/U in the high GT, making carb bolus recommendations larger for those in better control. Mean pump CorrFs were also higher in the mid and high GTs, again exactly the opposite of need. Table 4 presents a best practices model based on the study's findings that may assist in the evaluation of individual patients' pump settings.
Table 4.
Best Practices Model
| Mean and IQR for optimal insulin doses in the best control tertile: |
|---|
| Basal total = 47.6% of TDD (39.6% to 54.9%) |
| Carbohydrate boluses = 43.1% of TDD (35.6% to 51.2%) |
| Correction boluses = 9.0% of TDD (6.2% to 11.3%) |
The average number of grams of carb entered into pumps was 190 grams per day, roughly equivalent to a 1900 calorie diet, suggesting that the CarbF formula is based on an undercount of actual carb intake. An individual who performs precise carb counting may require a higher CarbF number than that calculated from Equation (13) to compensate for this average undercount.
For all 396 pumps, neither grams of carb per day (r = −0.02; p = 0.34) nor number of carb boluses per day (r = 0.06; p = 0.13) were statistically related to the mean glucose. The number of glucose tests per day was significantly related to the mean glucose level but had only a weak association (r = −0.18; p = 0.000). This contradicts perceptions that pump patients in poor control do not enter as many carbs per day, do not give as many carb and correction boluses per day, or do not monitor nearly as often as those in better control.
Although inaccurate carb counting is believed to be widespread, the data related to carb counting that we could track, including average grams of carb intake per day and average number of carb boluses taken per day, did not vary between GTs. This suggests that carb counting was equally inaccurate in each tertile but had little impact on glucose levels. Unbiased by a research study environment, geography, or clinician preferences, the data suggest that carb counting has less impact on glucose control than is commonly believed. Our findings also suggest that glucose control would improve if pump settings were selected from accurate dose formulas that provide more physiologic settings. Appropriate individualization of pump settings may also improve the dose reductions done internally by the bolus calculator for BOB and hypoglycemia to further reduce the risk of hypoglycemia.
Conclusions
Based on our survey of insulin pumps prescribed by multiple providers in the United States, insulin pump CarbF and CorrF settings are not being systematically adjusted for individual patients. Relatively large numbers of these settings show clustering around easy-to-use numbers and do not follow an expected Gaussian distribution. This suggests that many patients are not reaping the full benefits that properly set bolus calculators could provide. Additional refinements of insulin doses through pattern management are likely to be more effective once pumps and bolus calculators are programmed with settings that are individualized from formulas based on an accurate TDD.
Our data show that close to two-thirds of pump wearers appear to be using TDDs that are less than optimal. We have developed a model and formulas to improve accuracy in the selection of pump settings with the hypothesis that improvements in glucose control can be derived from improved pump settings and from a more accurate TDD.
Four needs currently exist for more accurate insulin dosing from bolus calculators:
More accurate TDDs based on the average glucose level.
More physiologic pump settings, including the basal doses, CarbF, CorrF, and DIA, derived from formulas based on an accurate TDD.
The availability of finer increments in pumps for CarbFs below 20 g/U (nearly all pumps) and CorrFs below 20 mg/dl/U (most pumps with a TDD greater than 100 U/day) to enable pumps to have adequate precision in their bolus dose recommendations.
Feedback to users and clinicians when an individual's pump settings do not match an expected profile based on their TDD, mean glucose level, and frequency of hypoglycemia.
The methods and formulas derived in this study from retrospective data will need to be verified in prospective clinical trials. Automatic calculations of pump settings based on the dose formulas in this study can be found online at www.opensourcediabetes.org.
Abbreviations
- BOB
bolus insulin on board
- carb
carbohydrate
- CarbF
carbohydrate factor
- CorrF
glucose correction factor
- CorrF-RN
correction factor rule number
- DIA
duration of insulin action
- GT
glucose tertile
- IS
insulin sensitivity
- IQR
interquartile range
- RIS
relative insulin sensitivity
- TDD
total daily dose
References
- 1.Walsh J, Roberts R. Pumping insulin. 2nd ed. San Diego: Torrey Pines Press; 1994. [Google Scholar]
- 2.Davidson PC, Hebblewhite HR, Bode BW, Steed RD, Welch NS, Greenlee MC, Richardson PL, Johnson J. Statistically based CSII parameters: correction factor, CF (1700 rule), carbohydrate-to-insulin ratio, CIR (2.8 rule), and basal-to-total ratio. Diabetes Technol Ther. 2003;3:237. [Google Scholar]
- 3.Davidson PC, Hebblewhite HR, Steed RD, Bode BW. Analysis of guidelines for basal-bolus dosing: basal insulin, correction factor, and carbohydrate-to-insulin ratio. Endocr Pract. 2008;14(9):1095–1101. doi: 10.4158/EP.14.9.1095. [DOI] [PubMed] [Google Scholar]
- 4.King AB, Armstrong DU. A prospective evaluation of insulin dosing recommendations in patients with type 1 diabetes at near normal glucose control: bolus dosing. J Diabetes Sci Technol. 2007;1(1):42–46. doi: 10.1177/193229680700100107. [DOI] [PMC free article] [PubMed] [Google Scholar]
- 5.Adamsson U, Lins PE. Clinical views on insulin resistance in type-1 diabetes. In: Agardh CD, Berne C, Östman J, editors. Diabetes. Stockholm: Almqvist & Wiksell; 1992. pp. 142–150. [Google Scholar]
- 6.Walsh J, Roberts R. A patient safety initiative for insulin pumps. Slides 10 to 16. http://www.diabetesnet.com/diabetes_presentations/PropInsPumpManufStand-0909.html.