

Abstract
Background
Glucose is heterogeneously distributed within human skin. In order to develop a glucose measurement method for human skin, both a good quantification of the different compartments of human skin and an understanding of glucose transport processes are essential. This study focused on the composition of human skin. In addition, the extent to which intersubject variability in skin composition alters glucose dynamics in human skin was investigated.
Methods
To quantify the composition of the three layers of human skin—epidermis, dermis, and adipose tissue—cell and blood vessel volumes were calculated from skin biopsies. These results were combined with data from the literature. The composition was applied as input for a previously developed computational model that calculates spatiotemporal glucose dynamics in human skin. The model was used to predict the physiological effects of intersubject variability in skin composition on glucose profiles in human skin.
Results
According to the model, the lag time of glucose dynamics in the epidermis was sensitive to variation in the volumes of interstitial fluid, cells, and blood of all layers. Data showed most variation/uncertainty in the volume composition of the adipose tissue. This variability mainly influences the dynamics in the adipose tissue.
Conclusions
This study identified the intersubject variability in human skin composition. The study shows that this variability has significant influence on the glucose dynamics in human skin. In addition, it was determined which volumes are most critical for the quantification and interpretation of measurements in the different layers.
Keywords: glucose, histology, interstitial fluid, modeling, skin
Introduction
Human skin is a physical barrier at the interface between the human body and its environment. It prevents water loss and protects the body from physical, chemical, and biological insult. At the same time, the skin contributes to the vascular capacity of the entire body, to blood pressure control, and to glucose handling.1,2 The main components involved in glucose handling in human skin are blood plasma, lymph fluid, interstitial fluid (ISF), and cells.
In diabetes care, glucose concentration is generally measured in full blood or in blood plasma. Decisions for intervention are based on this concentration. However, it seems that the effect of hyperglycemia on both the symptoms and complications of diabetes is presumably mediated via ISF and cellular effects.3 New technologies, e.g., electrochemical sensors, have been developed that measure glucose concentration in the ISF of human skin.4,5 Tests with these sensors showed that the measurement depth of the sensor influences the measured value.6 Besides this intrasubject variability, intersubject variability is also an important aspect for these measurements.7–9 This variation between subjects can, for example, originate from variability in the composition and thickness of the different layers.10 A computational model that allows investigation of these relations has been published.11 The model calculates spatiotemporal glucose dynamics in the epidermis, dermis, and subcutaneous layer. In this current study, the composition of human skin was investigated in detail. The composition of the three layers of the skin was quantified using skin biopsies. These data are essential input for the model but were unavailable in the literature. This composition was applied to the model. In addition, the influence of intersubject variability of the histology parameters on glucose handling in human skin was characterized.
Materials and Methods
Histology
This study aimed to characterize the composition of human skin by quantifying the volumes of blood plasma, lymph fluid, ISF, cells, and remaining volume per layer. The remaining volume is defined as the volume that does not take part in the transport of glucose and water, e.g., volume occupied by collagen fibers. Three layers were characterized: epidermis, dermis, and adipose tissue. A large part of these data were not available in the literature. Therefore, these values were obtained by the histology research described in this study. This was combined with data from the literature.12–18 Slices of biopsies of the lower leg of six different subjects (healthy, 4 male, 2 female, 26–48 years of age) were studied with light microscopy (Leica LDMD). Approval was obtained from the ethical committee of the Catherina Hospital in Eindhoven, the Netherlands. The biopsies were taken in the Catharina Hospital. Biopsies were originally taken to investigate the mechanism of temporary hair removal by intense pulsed light.
The biopsies were cut into slices and stained with hema- toxylin and eosin. In the slices studied with light microscopy, cells were counted for each layer. Additionally, cells were counted for the papillary and reticular dermis separately. Next, the surface area of the layer on the picture was calculated. Finally, the number of cross sections of blood vessels was counted in the adipose tissue.
The result of the counting was the number of cells and blood vessels for a certain surface area. The average surface area for one cell (A) was calculated by:
| (1) |
where r is the mean radius for the cell type; r was 10 (6–15 μm for layers most essential in glucose handling), 2.5, 80, and 8 μm for the keratinocytes, fibroblasts, adipocytes, and blood vessels, respectively.10,13,15,19–22 Next, the cell and vessel density (ρ) was calculated:
| (2) |
where n is the number of cells in the layer and S is the total surface area on the picture. It was assumed that the volume density of the cells in a layer was equal to the surface density. Finally, in order to determine the glucose uptake rate per layer, the total cell water volume per layer was calculated:
| (3) |
where ncell_water is the water volume of one cell, with 0.7, 0.7, and 0.04 μm2 cell water/μm2 cell,10,13,15,17,18,22 for the epidermis, dermis, and adipose tissue, respectively.
Computational Modeling
The spatiotemporal model as described in Groenendaal and colleagues11 was used. In short, the model calculates the glucose concentration per component per layer dependent on depth of the skin using the glucose concentration in the blood as an input. The model outputs, e.g., glucose dynamics in the ISF of the dermis, can be compared to physiological measurements. Here, the model was used to study the influence of changes in the composition in the skin, e.g., changes that arise between subjects. These variations include layer thickness and variation in the volumes of the components.
First, a parameter sensitivity analysis (PSA) was performed in which component volumes were changed. These changes were matched with a change of the excluded volume. In this manner, the total volume remained 100%. The volumes were changed using the variation in the histology parameters and the change in lag time during an oral glucose tolerance test (OGTT) was calculated. The OGTT data of Groenendaal et al.11 was used. The lag time was the difference in time between blood plasma and the other compartments to reach a glucose concentration of 6.5 mM during the down slope. Second, the influence of the layer thickness was quantified both by the change in lag time as well as by steady state simulations using a constant glucose concentration of 5 mM as input. In the latter case, the change in ratio between blood plasma and the other compartments was calculated. The thickness of all layers was varied. The physiological range in human skin is (less than) 1 to 4 mm10,15 and 1 to 12 mm23 for the dermis and adipose tissue, respectively. The thickness of the epidermis on a human forearm is 36–61 μm.24 On the wrist, this thickness can increase to almost 100 μm.24 Therefore, we tested a thickness of 50 and 100 μm.
Results
Results are presented per layer. Histology pictures are shown in Figure 1.
Figure 1.
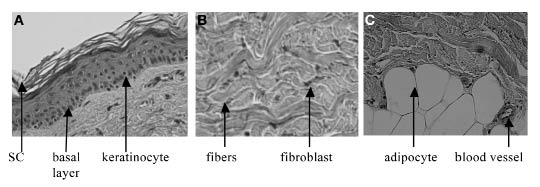
Histology pictures: (A) epidermis and part of the dermis, showing the different layers of the epidermis; (B) dermis; (C) adipose tissue and the dermis.
Epidermis
Epidermal cells are arranged in continuous layers (see Figure 1A). These layers vary in composition. However, in this study, the epidermis was quantified as a whole, excluding the stratum corneum (SC). The SC contains hornified cells and virtually no ISF volume, i.e., it does not significantly contribute to glucose metabolism. The average composition of the epidermis is given in Table 1.
Table 1.
Relative Volumes Including Variation of the Different Compartments of the Epidermis
| Compartment | Volume % | Reference |
|---|---|---|
| Cells | 67 ± 10 | This study |
| Cell water | 47% ± 7 | This study |
| Blood plasma | 0 | – |
| Lymph fluid | 0 | – |
| ISF | 15–35 | 15, 17, and 18 |
| Excluded | 0–28 | This study |
Cells were counted in the epidermis as explained in the Methods section. The number of cells per picture was 95.5 ± 22. The cell density was 0.0086 ± 0.0013 cells/μm2. This resulted in a volume percentage of 67% ± 10% for the cells and of 40–54% for cell water.
The ISF volume in the epidermis increases from virtually absent in the SC to ∼40% in the basal layers.15,17,18 Based on the work of Warner and colleagues18 and Hansen and Yellin25, Van Kemenade15 calculated a depth-dependent water profile of the epidermis and was able to distinguish between intercellular and intracellular water. Unfortunately, only one subject was characterized in this way. This profile was applied to the model as an estimated guess to determine the possible influence of such a gradient.
The cell water content calculated from the cell counting was of the same order of magnitude to the value obtained by Van Kemenade (almost 40%). The minor difference could be caused by assumptions in the cell counting, by the small sample size number of Warner et al.18 (n = 1) or by assumptions in the work of Van Kemenade.15
The excluded volume is calculated by extracting the volumes of the cells and the ISF of the total volume. This varies throughout the depth of the epidermis.
Dermis
Figure 1B shows a picture of the dermis. It can be seen that, compared to the epidermis, the dermal layer contains more connective tissue and a smaller number of cells. The composition of the total dermis is given in Table 2. An explanation of the results follows.
Table 2.
Relative Volumes Including Variation of the Different Compartments of the Dermis
| Compartment | Volume % | Reference |
|---|---|---|
| Cells | 0.3 ± 0.1 | This study |
| Cell water | 0.21 ± 0.07 | This study |
| ISF | 40 ± 5.2 | 12 |
| Lymph | 0.3–0.4 | Calculated from 16 and 26 |
| Blood plasma | 8 ± 0.8 | 14 |
| Excluded | 51.4 | This study |
The number of cells was dependent on the location in the dermis. The number of cells in the reticular dermis was 7.1 ± 2.1, while the number of cells in the papillary layer was 28.1 ± 7.7. The two groups were significantly different (p value ≪ .05). The average density was 0.3% ± 0.1%.
The density of the skin is typically 1.1 g/ml.1 The ISF volume in the dermis is usually around 0.40 ml/g.12 This gives a volume density of 44% water. This matches the range that is given by Johnson and Fusaro.1
The blood plasma volume in the dermis was calculated based on oxygen tension measurements from Evans and Naylor.14 They calculated a blood volume of approximately 8% of the tissue volume.
The volume of the lymphatic system was calculated following an identical strategy to the blood volume in the adipose tissue. The number of lymphatic vessel cross sections (LVCS) was determined by Lubach and coworkers.16 In the human forearm, 1.3 and 1.9 LVCS were counted per mm2 in the papillary and reticular layer, respectively.16 The diameter of the lumen of the initial capillaries is ∼50 μm.26 Combining these results gives a volume density of 0.3–0.4%.
The excluded volume is calculated by extracting the volumes of the other compartments from the total volume. The value is of the same order of magnitude as the value determined by Johnson and Fusaro.1
Adipose Tissue
Figure 1C depicts both the subcutaneous layer as well as the dermal layer. A clear difference can be seen between the layers, e.g., in the size of the cells. Similar to the dermis, the adipose tissue contains cells, extracellular matrix, blood plasma, and lymph vessels. However, the volumes of the different compartments are different. The composition of the subcutaneous layer is given in Table 3.
Table 3.
Relative Volumes Including Variation of the Different Compartments of the Adipose Tissue
| Compartment | Volume % | Reference |
|---|---|---|
| Cells | 78 ± 30 | This study |
| Cell water | 3.1 ± 1.2 | This study |
| ISF | 20 ± 10 | 13 |
| Lymph | 0.3–0.4 | This study |
| Blood plasma | 2.0 ± 0.9 | This study |
| Excluded | 0–30 | This study |
The ISF water content of the adipose tissue is 10–30%.13 The cell density was calculated to be 78% ± 30%. This gives a cell water content of 3.1% ± 1.2%. Next to the cells, the blood vessels are also counted in 10 histology pictures. The density was 2.0% ± 0.9%.
The number of lymph vessels is smaller in the adipose tissue than in the dermis.16,26–28 However, no quantitative data were found on the lymphatics in the adipose tissue. In addition, it was not possible to detect the lymphatics in the histology pictures. Therefore, the volume percentage of the lymphatics in the adipose tissue was taken equal to the percentage in the dermis. The influence of this assumption on glucose dynamics has been tested with the computational model.
Total Skin
Figure 2 shows a comparison of the composition of the three layers and assists in comparing the layers. The figure clearly demonstrates the difference between the layers, e.g. in cell and blood volume.
Figure 2.
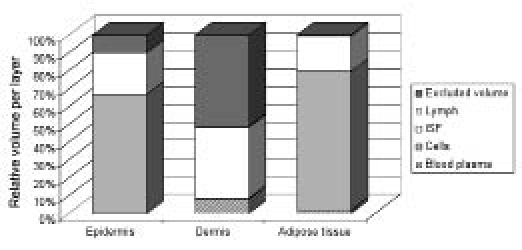
Distribution in the three layers of the skin: epidermis, dermis, and adipose tissue. The lymph fluid volume in the dermis and adipose tissue is barely visible due to the very small value but is present in the figure. The volumes of this component and the other components can be found in Tables 1, 2, and 3.
Results Model Simulations
The results of the histology research were used to determine the rate of glucose clearance per layer.Figure 3 shows that, in absence of insulin, the maximal glucose uptake rate is approximately the same in the epidermis and the adipose tissue. However, in the presence of insulin, the glucose uptake rate can increase four-fold in the subcutaneous layer29 (Figure 3). Besides this, the maximal uptake rate per layer is also dependent on the thickness of the layer.
Figure 3.
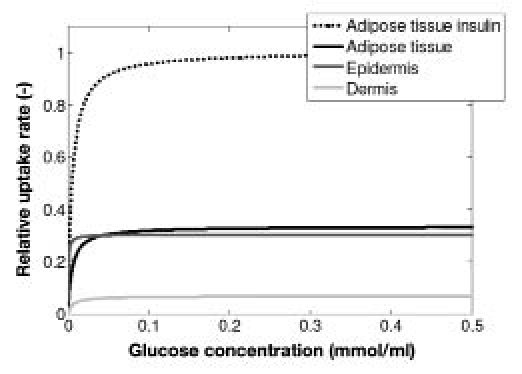
Dose-response diagram for the cells of the different layers. The glucose uptake rate per layer was scaled with maximal glucose uptake rate in the adipose tissue in the presence of insulin. Uptake rate is a function of the blood glucose concentration in the absence and presence of insulin.
Table 4 shows the response time of the layers expressed in lag times. The decay of glucose concentration in the ISF of the epidermis is faster than in blood plasma, while the response in the adipose tissue lags behind by several minutes.
Table 4.
Results Parameter Sensitivity Analysisa
| Parameter | Variation | ISF Dermis | ISF epidermis | ISF adipose tissue |
|---|---|---|---|---|
| Control | – | 97 s | −66 s | 323 s |
| ISF epidermis | 30% | 1.2% | 15.8% | 0.2% |
| ISF dermis | 13% | 14.5% | 20.7% | 1.8% |
| ISF adipose tissue | 50% | 7.9% | 10.3% | 60.4% |
| Cell epidermis | 15% | 3.9% | 49.7% | 0.6% |
| Cell dermis | 33% | 1.0% | 1.7% | 0.1% |
| Cell adipose tissue | 38% | 3.2% | 4.5% | 19.2% |
| Blood plasma dermis (vessel surface area) | 10% | 9.8% | 13.5% | 1.2% |
| Blood adipose tissue (vessel surface area) | 45% | 2.4% | 2.9% | 22% |
| Lymph dermis | 15% | 0% | 0.3% | 0% |
| Lymph adipose tissue | 15% | 0.3% | 0.6% | 0% |
This table gives the variation in the histology parameters. The change in the response of the layers is the average of increasing and decreasing the values with the variations.
Subsequently, this study quantified the extent in which physiological changes in the histology parameters can influence glucose dynamics in human skin. Hereto, a PSA was performed. Table 4 shows the changes in lag time caused by the changes in parameter values. There is most variation/uncertainty in the parameters of the adipose tissue. Although this variation is large, it mainly influences the response in the adipose tissue. On the other hand, the response in the adipose tissue is robust to changes in the histology of the dermis and epidermis. The lag time in the dermal layer is robust for changes in most parameter values; only little change is observed caused by a change in ISF volume. The response in the epidermis was sensitive to changes in all layers.
Besides variability in the volumes of the components, the influence of variability in layer thickness was characterized,Figure 4 and Tables 5 and 6. These results show that variations in the thickness of the dermis only influences the lag time of the dermal ISF and the gradients of the dermal and epidermal ISF. When the thickness of the epidermis is increased to 100 μm, this influences the gradients and also the lag time in the dermis and epidermis, but not in the adipose tissue. The thickness of the adipose tissue does influence the gradient and the lag time only in the adipose tissue. In the upper part of the adipose tissue, the gradient remains relatively unaltered, but in the deeper part of the adipose tissue, the gradient is larger, reaching a steady state at a depth of approximately 4 mm.
Figure 4.
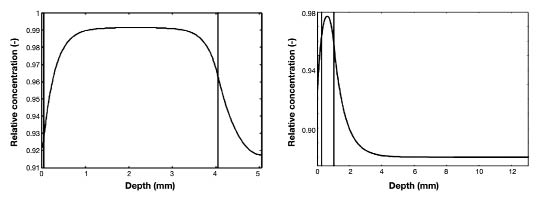
Depth profile during steady state blood glucose of 5 mM. Dermis thickness is 4 mm (Left); adipose thickness is 12 mm (Right).
Table 5.
Gradient during Steady State Blood Glucose Concentration of 5mMa
| Dermis | Epidermis | Adipose tissue | |
|---|---|---|---|
| Control | 93–98% | 92–93% | 92–96% |
| Epidermis 100 μm | 95% (84–97%) | 85% (84–86%) | 93% (92–96%) |
| Dermis 2 mm | 98% (93–99%) | 92% (92–93%) | 93% (92–96%) |
| Dermis 4 mm | 99% (93–99%) | 92% (92–93%) | 93% (92–96%) |
| Adipose 4 mm | 97% (93–98%) | 92% (92–93%) | 89% (88–96%) |
| Adipose 12 mm | 97% (93–98%) | 92% (92–93%) | 88% (88–96%) |
The thickness of the layers has been varied. The response per layer is the gradient between blood glucose and the glucose concentration in the ISF.
Table 6.
Lag Time Change during Oral Glucose Tolerance Testa
| Dermis | Epidermis | Adipose tissue | |
|---|---|---|---|
| Epidermis 100 μm | −74% | −243% | −1.3% |
| Dermis 2 mm | 17.7% | −4% | 1.7% |
| Dermis 4 mm | 25.8% | −4% | 1.7% |
| Adipose 4 mm | 1.6% | 0% | 22% |
| Adipose 12 mm | 1.6% | 0% | 26% |
The thickness of the layers has been varied. This table gives the percentage change in lag time.
Finally, the role of the water gradient in the epidermis was investigated. A steady state glucose concentration of 5 mM in the blood plasma was applied to the model as input. Figure 5 gives the depth profile for the control situation for the gradient within the epidermis.
Figure 5.
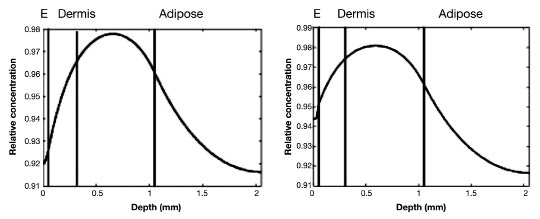
Relative concentration depth profile of glucose concentration at steady state blood glucose of 5 mM. (Left) Graph shows the depth profile in the ISF of the skin for a “control” situation. (Right) Graph includes details in the epidermis. The SC and the water profile in the epidermis are included in the simulations. Left of the first black (first part) line is the epidermis, the second part is the papillary dermis, the third part is the reticular dermis, and far right (fourth part) is adipose tissue. E, epidermis.
Discussion and Conclusion
This study quantified the composition of human skin. The volumes of the main components in glucose handling were determined for the epidermis, the dermis, and the adipose tissue. In addition, this study characterized the intersubject variability in these volumes. These results were used as input for a computational model that calculates spatiotemporal glucose dynamics in human forearm skin. A discussion on the histology research and the modeling results follows.
Histology
This study included lower leg biopsies of six subjects, which were combined with literature information of the human forearm.12–18 According to Lubach et al.16 and Champion et al.,13 the skin composition of the human forearm and lower leg is close. This was also concluded in this current study, because the histology research matched the literature values of human forearm skin. This study included biopsies of both males and females. It should be noted that ethnic differences in skin composition were not investigated. Different studies indicated gender and ethnic differences in skin composition.30,31 The exact influence on glucose dynamics in skin remains to be determined. This could be achieved using a comparable approach as presented in this study. However, these differences are not expected to alter the results in this study.
This composition of the different layers was in line with the function of the layers. The function as supportive tissue of the dermal layer was reflected in the large amount of connective tissue. In addition, it is well perfused with blood plasma, indicating a fast response to changes in blood glucose concentration. The function of the layers was also reflected in the maximal glucose clearance rate per layer. The epidermis is the barrier that protects the underlying structures and continuously needs energy for this.1,2 These results coincide with available data that show that the metabolism of the epidermis overshadows the metabolism of the dermis.1 It indicates that, even though the epidermis is a relatively small layer, it is important for glucose metabolism. The function of the adipose tissue is to store energy.13 The storage is increased at higher glucose levels, i.e., excess glucose. The glucose uptake in the subcutaneous tissue exceeds the uptake in the epidermis in the presence of high glucose concentrations and insulin.
Computational Model
The results of the histology research were applied to the model. In the Results section, we showed the depth profile of glucose through the ISF of human skin. This profile showed that the glucose concentration in the dermal ISF was closest to the blood glucose concentration. In addition, this study showed that differences in skin composition among subjects can significantly alter the glucose dynamics in human skin. After changing the volumes of the different components, most variability was observed in the responses of the epidermal and subcutaneous ISF. The difference being that the epidermis was sensitive to changes in all layers, while the adipose tissue only showed response to change in volumes of the adipose tissue itself. The response in the dermis was robust to changes in the volumes.
Comparable results were observed for the influence of layer thickness. However, some differences should be noted. First, the change in thickness of the epidermis significantly influenced the response in both the dermis and the epidermis, but not in the adipose tissue. However, this increase in layer thickness is physiologically unlikely, and taking into account the water profile in the epidermis partly counteracts the changes (Figure 5). Next, the response of the adipose tissue only changed with changes within the layer. Remarkably, the response became more constant in the deeper part of the adipose tissue.
These results indicate that, although the epidermis could be a good position for early detection of decreasing glucose concentrations, there is variation in the response between subjects dependent on the histology of the entire skin. Also, the layered structure of the epidermis could possibly make measurements in this layer more difficult to interpret. In contrast, the composition of adipose tissue in the human forearm is relatively constant with depth.32 Another difference with the epidermis is that, although there is variability in the response in the adipose tissue, this variability only depends on the composition of the adipose tissue, but not on the composition of the other layers. Finally, the response in the dermis shows relatively little variation among subjects and is close to the blood glucose concentration, indicating its potential for noninvasive glucose measurements.
Applications
The results presented in this study can be used in the development of a glucose measurement method. In addition, the results can be used for interpreting measurements, helping to explain intersubject and, to a lesser extent, intrasubject variability.
Also relevant is that several studies showed that, in diabetes patients, the composition of the skin can change, e.g., blood supply and skin thickness.33,34 These tissue reactions might significantly influence the glucose dynamics in human skin. The approach presented in this study can also be used to characterize the role of these changes on glucose dynamics in the skin of diabetes patients.
Conclusion
This study identified the intersubject variability in human skin composition. We showed that this variability significantly influenced glucose dynamics in human skin. This approach identified robust and sensitive measurement positions between and within subjects in human skin.
Acknowledgments
We thank Guido Roosen for his assistance with the histology research.
Abbreviations
- ISF
interstitial fluid
- LVCS
lymphatic vessel cross sections
- OGTT
oral glucose tolerance test
- PSA
parameter sensitivity analysis
- SC
stratum corneum
References
- 1.Johnson JA, Fusaro RM. The role of skin in carbohydrate metabolism. Adv Metab Disord. 1972;60:1–55. doi: 10.1016/b978-0-12-027306-5.50006-1. [DOI] [PubMed] [Google Scholar]
- 2.Zierler K. Whole body glucose dynamics. Am J Physiol Endocrinol Metab. 1999;39:E409–E426. doi: 10.1152/ajpendo.1999.276.3.E409. [DOI] [PubMed] [Google Scholar]
- 3.Boyne MS, Silver DM, Kaplan J, Saudek CD. Timing of changes in interstitial and venous blood glucose measured with a continuous subcutaneous glucose sensor. Diabetes. 2003;52(11):2790–2794. doi: 10.2337/diabetes.52.11.2790. [DOI] [PubMed] [Google Scholar]
- 4.Heinemann L. Variability of insulin absorption and insulin action. Diabetes Technol Ther. 2002;4(5):673–682. doi: 10.1089/152091502320798312. [DOI] [PubMed] [Google Scholar]
- 5.Khalil OS. Non-invasive glucose measurement technologies: an update from 1999 to the dawn of the new millenium. Diabetes Technol Ther. 2004;6(5):660–697. doi: 10.1089/dia.2004.6.660. [DOI] [PubMed] [Google Scholar]
- 6.Rebrin K, Stei GM, van Antwerp WP, Mastrototaro JJ. Subcutaneous glucose predicts plasma glucose independent of insulin: implications for continuous monitoring. Am J Physiol Endocrinol Metab. 1999;277(3 Pt 1):E561–E571. doi: 10.1152/ajpendo.1999.277.3.E561. [DOI] [PubMed] [Google Scholar]
- 7.Thomas EV. Adaptable multivariate calibration models for spectral applications. Anal Chem. 2000;72(13):2821–2827. doi: 10.1021/ac000009j. [DOI] [PubMed] [Google Scholar]
- 8.De Boer J, Plijter-Groendijk H, Korf J. Microdialysis probe for transcutaneous monitoring for ethanol and glucose in humans. J Appl Physiol. 1993;75(6):2825–2830. doi: 10.1152/jappl.1993.75.6.2825. [DOI] [PubMed] [Google Scholar]
- 9.Sieg A, Guy RH, Delgado-Charro MB. Noninvasive glucose monitoring by reverse iontophoresis in vivo: application of the internal standard concept. Clin Chem. 2004;50(8):1383–1390. doi: 10.1373/clinchem.2004.032862. [DOI] [PubMed] [Google Scholar]
- 10.Odland GF. Structure of the skin. In: Goldsmit LA, editor. Physiology, biochemistry, and molecular biology of the skin. Oxford: Oxford: University Press; 1991. [Google Scholar]
- 11.Groenendaal W, Schmid KA, von Basu G, van Riel NA, Hilbers PA. Modeling glucose and water dynamics in human skin. Diabetes Technol Ther. 2008;10(4):283–293. doi: 10.1089/dia.2007.0290. [DOI] [PubMed] [Google Scholar]
- 12.Aukland K, Reed RK. Interstitial-lymphatic mechanisms in the control of extracellular fluid volume. Physiol Rev. 1993;73(1):1–78. doi: 10.1152/physrev.1993.73.1.1. [DOI] [PubMed] [Google Scholar]
- 13.Champion RH, Burton JL, Ebling FJ, Rook A, Wilkinson DS. Textbook of dermatology. 5th ed. Oxford: Blackwell Science; 1992. [Google Scholar]
- 14.Evans NT, Naylor PF. The dynamics of changes in dermal oxygen tension. Respir Physiol. 1966;2(1):61–72. doi: 10.1016/0034-5687(66)90038-7. [DOI] [PubMed] [Google Scholar]
- 15.Van Kemenade PM. Water and ion transport through intact and damaged skin. Ph.D. thesis. Eindhoven, the Netherlands: Eindhoven University of Technology; 1998. [Google Scholar]
- 16.Lubach L, Lüdemann B, Berens von Rautenfeld D. Recent findings on the angioarchitecture of the lymph vessel system of human skin. Br J Dermatol. 1996;135(5):733–737. [PubMed] [Google Scholar]
- 17.Querleux R, Richard B, Bittoun J, Jolivet I, Idy-Peretti B, Bazin R, Lévêque JL. In vivo hydration profile in skin layers by high- resolution magnetic resonance imaging. Skin Pharmacol. 1994;7(4):210–216. doi: 10.1159/000211296. [DOI] [PubMed] [Google Scholar]
- 18.Warner M, Myers T, Taylor DA. Electron probe analysis of human skin: determination of water concentration profile. J Invest Dermatol. 1988;90(2):218–224. doi: 10.1111/1523-1747.ep12462252. [DOI] [PubMed] [Google Scholar]
- 19.Braverman IM. The cuteneous microcirculation. J Investig Dermatol Symp Proc. 2000;5(1):3–9. doi: 10.1046/j.1087-0024.2000.00010.x. [DOI] [PubMed] [Google Scholar]
- 20.Clarkson K, Katch K, Kroll L, Lane K, Kamen G. Regional adipose cellularity and reliability of adipose cell size determination. Am J Clin Nutr. 1980;33(11):2245–2252. doi: 10.1093/ajcn/33.11.2245. [DOI] [PubMed] [Google Scholar]
- 21.Després S, Savard T, Tremblay B, Bouchard C. Adipocyte diameter and lipolytic activity in marathon runners: relationship with body fatness. Eur J Appl Physiol Occup Physiol. 1983;51(2):223–230. [Google Scholar]
- 22.Kanitakis J. Anatomy, histology and immunohistochemistry of normal human skin. Eur J Dermatol. 2002;12(4):390–401. [PubMed] [Google Scholar]
- 23.Maggs J, Jacob R, Rife L, Lange L, Leone D, During T, Tamborlane S, Sherwin RS. Interstitial fluid concentrations of glycerol, glucose, and amino acids in human quadricep muscle and adipose tissue. Evidence for significant lipolysis in skeletal muscle. J Clin Invest. 1995;96(1):370–377. doi: 10.1172/JCI118043. [DOI] [PMC free article] [PubMed] [Google Scholar]
- 24.Whitton E, Everall JD. The thickness of the epidermis. Br J Dermatol. 1973;89(5):467–476. doi: 10.1111/j.1365-2133.1973.tb03007.x. [DOI] [PubMed] [Google Scholar]
- 25.Hansen Y, Yellin W. NMR and infrared spectroscopic studies of stratum corneum hydration. In: Jellinek HH, editor. Water structure at the water-polymer interface. New York: Plenum; 1972. pp. 19–28. [Google Scholar]
- 26.Schmid-Schönbein GW. Microlymphatics and lymph flow. Physiol Rev. 1990;70(4):987–1028. doi: 10.1152/physrev.1990.70.4.987. [DOI] [PubMed] [Google Scholar]
- 27.Olszewski WL. The lymphatic system in body homeostasis: physiological conditions. Lymphat Res Biol. 2003;1(1):11–24. doi: 10.1089/15396850360495655. [DOI] [PubMed] [Google Scholar]
- 28.Pepper S, Skobe M. Lymphatic endothelium: morphological, molecular and functional properties. J Cell Biol. 2003;163(2):209–213. doi: 10.1083/jcb.200308082. [DOI] [PMC free article] [PubMed] [Google Scholar]
- 29.Klip A. Regulation of glucose transport by insulin and non-hormonal factors. Life Sci. 1982;31(23):2537–2548. doi: 10.1016/0024-3205(82)90726-3. [DOI] [PubMed] [Google Scholar]
- 30.Giacomoni M, Mammone T, Teri M. Gender-linked differences in human skin. J Dermatol Sci. 2009;55(3):144–149. doi: 10.1016/j.jdermsci.2009.06.001. [DOI] [PubMed] [Google Scholar]
- 31.Berardesca E, de Rigal L, Leveque M, Maibach HI. In vivo bio-physical characterization of skin physiological differences in races. Dermatologica. 1991;182(2):89–93. doi: 10.1159/000247752. [DOI] [PubMed] [Google Scholar]
- 32.Thomas K, Kiwit K, Kerner W. Glucose concentration in human subcutaneous adipose tissue: comparison between forearm and abdomen. Exp Clin Endocrinol Diabetes. 1998;106(6):465–469. doi: 10.1055/s-0029-1212017. [DOI] [PubMed] [Google Scholar]
- 33.Brooks M, McLennan T, Twigg Y, Yue DK. Detection and characterisation of microcirculatry abnormalities in the skin of diabetic patients with microvascular complications. Diabetes Vasc Dis Res. 2008;5(1):30–35. doi: 10.3132/dvdr.2008.006. [DOI] [PubMed] [Google Scholar]
- 34.Hanna F, Friesen B, Bombardier G, Gladman H, Hanna A. Pathologic features of diabetic thick skin. J Am Acad Dermatol. 1987;16(3 Pt 1):546–553. doi: 10.1016/s0190-9622(87)70072-3. [DOI] [PubMed] [Google Scholar]