Abstract
Background
Estimates for delays in the interstitial fluid (ISF) glucose response to changes in blood glucose (BG) differ substantially among research groups. We review these findings along with arguments that continuous glucose monitoring (CGM) devices used to measure ISF delay contribute to the variability. We consider the impact of the ISF delay and review approaches to correct for it, including strategies pursued by the manufacturers of these devices. The focus on how the manufacturers have approached the problem is motivated by the observation that clinicians and researchers are often unaware of how the existing CGM devices process the ISF glucose signal.
Methods
Numerous models and simulations were used to illustrate problems related to measurement and correction of ISF glucose delay.
Results
We find that (1) there is no evidence that the true physiologic ISF glucose delay is longer than 5–10 min and that the values longer than this can be explained by delays in CGM filtering routines; (2) the primary impact of the true ISF delay is on sensor calibration algorithms, making it difficult to estimate calibration factors and offset (OS) currents; (3) inaccurate estimates of the sensor OS current result in overestimation of sensor glucose at low values, making it difficult to detect hypoglycemia; (4) many device companies introduce nonlinear components into their filters, which can be expected to confound attempts by investigators to reconstruct BG using linear deconvolution; and (5) algorithms advocated by academic groups are seldom compared to algorithms pursued by industry, making it difficult to ascertain their value.
Conclusions
The absence of any direct comparisons between existing and new algorithms for correcting ISF delay and sensor OS current is, in part, due to the difficulty in extracting relevant details from industry patents and/or extracting unfiltered sensor signals from industry products. The model simulation environment, where all aspects of the signal can be derived, may be more appropriate for developing new filtering and calibration strategies. Nevertheless, clinicians, academic researchers, and the industry would benefit from collaborating when evaluating those strategies.
Keywords: algorithms, artificial pancreas, closed-loop control, diabetes, interstitial fluid
Introduction
Subcutaneous (SC) interstitial fluid (ISF) continues to be the preferred site for glucose sensing, as it is easily accessed and carries a lower risk of infection than the blood stream per se. However, two problems continue to affect the performance of sensors that probe this site: (1) changes in SC ISF glucose are delayed with respect to changes in blood glucose (BG) and (2) electrochemical sensors based on glucose oxidase often have a nonspecific background offset (OS) current. Both problems can result in sensors that fail to detect hypoglycemia and underestimate hyperglycemia. The problems have been discussed at length in scientific literature, with studies looking to correct for OS current focusing primarily on calibration (e.g., one- versus two-point1,2) and studies looking to address the delay focusing on signal processing algorithms (e.g., model-based deconvolution3,4 and Kalman filtering5–8). The origin of the OS current has not been determined definitively, although it has long been known that the OS observed in vitro is not necessarily the same as that observed in vivo, indicating that the biological environment contributes some unknown factor or factors.
This article reexamines these issues with emphasis on how manufacturers have addressed them.9–12 The focus on the approaches used by the medical device industry follows the basic reasoning that (1) it is of interest to the clinical community to understand the devices being used routinely and (2) signal processing and calibration algorithms advocated in the academic engineering community are unlikely to be implemented into industry products without being compared to the algorithms in place or under development. On the latter point, we note that the prevailing view in the academic community is that the signal processing/calibration can be improved. For example, in a survey of scientists at the 2009 Glycemic Modeling Working Group meeting,5 only 19% indicated that they believe existing continuous glucose monitoring (CGM) devices are suitable for performing closed-loop insulin delivery, whereas more than twice that many (41%) believe improvements in the calibration and filter routines will allow this goal to be achieved. The feasibility of using the SC site remains in question, with 40% of respondents believing ISF glucose to be substantially delayed and just 30% believing the maximum rate of change of ISF glucose has been well characterized.5 Virtually everyone agreed that modeling can aid in the understanding and development of new algorithms.
Metabolic Simulations Models
Model simulations are being used increasingly to elucidate the behavior of medical devices, with simulations now being accepted for review by the U.S. Food and Drug Administration13 in lieu of preclinical animal data. Here, modeling/simulation was used to illustrate problems related to the measurement of ISF delay. A simulated BG profile is used throughout the article to highlight how different groups and companies have approached the problem. The glucose excursion published by Boyne et al.14 was used to obtain parameters for the Medtronic Virtual Patient15,16 model, with data and model fit shown in Figure 1. We assumed meals were given at 8:40, 12:50, and 15:15 with corresponding insulin boluses concurrent with each meal (identified as near zero for the first meal) and a correction bolus at hour 12. Equations are publically available for the simulation model,15 the BG data of Figure 1 was easily extracted, and fitting routines for identifying model parameters are available in the software package MLAB (http://www.civilized.com).
Figure 1.
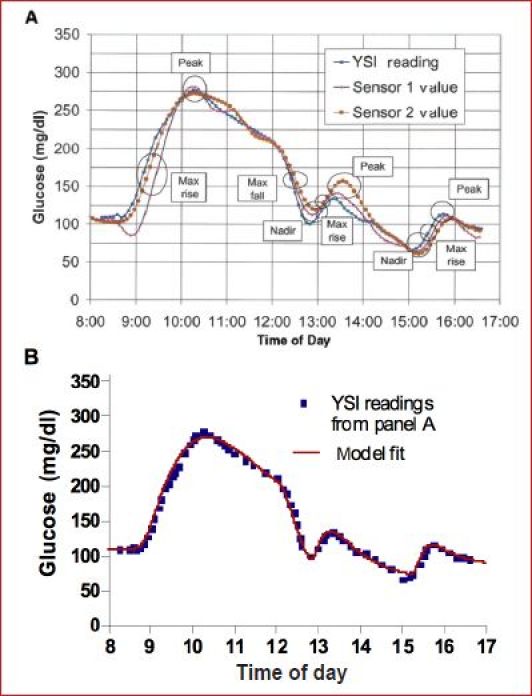
(A) Glucose and sensor profiles reprinted from Boyne et al.14 with permission from Diabetes, (B) Medtronic Virtual Patient15 model fit (red line) to blood glucose data (▪) extracted from Figure 1A Boyne et al.14
Using the model-simulated profile in Figure 1 allowed the SC ISF concentrations to be obtained from equations describing glucose transport across the capillary17 (Figure 2A). In the glucose transport model, K12 and K21 represent fractional rate constants describing the movement of glucose across the capillary and K02 represents fractional clearance of glucose from the ISF fluid compartment, possibly insulin dependent (glucose shown with closed circles, insulin with closed triangles, and the insulin receptor with inverted triangle). The model was originally validated in canines in which ISF obtained from lymph was frequently sampled.17 The identifiable model parameters, delay and gradient, were shown not to be affected by insulin,18 arguing that SC ISF is not derived from insulin-sensitive tissue. The magnitude of the ISF delay in human subjects during rapid hyperglycemic19 and insulin-induced hypoglycemic20 excursions was estimated to be no more than 5–10 min. These studies utilized a CGM system in which the filters normally used to remove sensor noise were disabled. The argument at that time, revisited here, is that the filters per se add delay.21 The model has been independently used by Facchinetti and associates4,22 and Wei and coworkers.23
Figure 2.
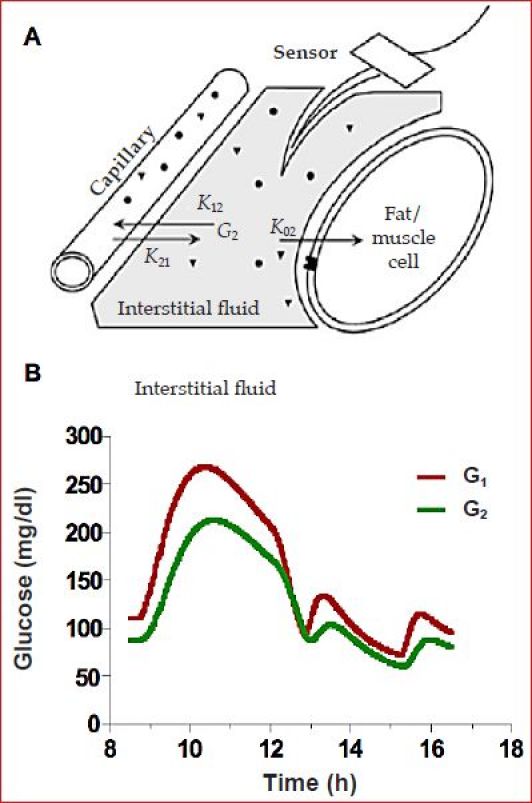
(A) Two-compartment model of blood (capillary) and ISF glucose dynamics.17,18 (B) Simulated blood (G1) and ISF (G2) glucose profiles for the data in Figure 1.
For the ISF glucose profile simulated here, the blood to ISF gradient was arbitrarily set to be 0.8 and the ISF delay to be 12 min (Figure 2B). This is a smaller gradient than that reported using microdialysis24 and a slightly longer delay than typically reported for ISF glucose when identified in the absence of filters18 (see Reference 21 for comments on the delay reported in Reference 24). We note that the model (Figure 2A) defines a very specific type of delay: one in which ISF glucose is expected to begin changing immediately after a change in plasma glucose. This type of delay is analogous to the delay obtained when giving gas to a car in that the car responds immediately to a step increase in gas but does not reach final speed for some seconds. The delay can be characterized by a “time constant” (τ), which is defined as the time to reach 63% of the final speed. Time to reach 50% (T1/2), 90% (T90), or 95% (T95) can be obtained by multiplying τ by 0.693, 2.303, and 3, respectively. Sensor delays and the time of action for many drugs (e.g., insulin) are often reported using similar notation. A time constant can be contrasted to what is sometimes referred to as transport lag (TD) in which there is no response for a finite amount of time (TD). An example of transport lag would be the administration of drug in an intravenous line that is upstream of the patient. With transport lag, there is no increase in the amount of drug reaching the body until the fluid in the intravenous line is advanced to the body, and then the full increase is realized at once. An estimate of TD would be obtained by dividing the volume in the line (ml) by the flow rate (ml/min). For transport lag, the concept of T1/2, T90, or T95 has no meaning (systems can have both transport lag and multiple time constants). Generally, transport lag is much harder to correct in real time but easier to identify retrospectively. Accepted methods for identifying TD include cross correlation or measuring the time between the peak values in two signals.
Separating Interstitial Fluid Delay from Sensor Delay
Estimating the delay associated with a time constant is much more difficult and requires specialized software to identify parameters embedded in differential equations. For example, in the model of Figure 2, the differential equation is:
| (1) |
Here, G1 is BG and G2 is ISF glucose. The ISF delay is defined by the time constant τ = 1/q2, with q2 = K02 + K12 defined in Figure 2A. A direct measure of G2 is difficult to obtain experimentally but can be replaced by the sensor signal if the sensor responds to the ISF glucose (G2) with no appreciable delay, as is the case for many amperometric glucose-oxidase-based sensors. For a sensor with OS, the current (ISIG) would be given as
| (2) |
where m is the sensor sensitivity (typically nA per mg/dl) and OS is the offset (nA). From Equations (1) and (2), a differential equation describing ISIG can be obtained:
| (3) |
where q2, the product m · q1 and the product q1 · OS are identifiable from BG (G1) and sensor current (ISIG) using appropriate software (e.g., MLAB).
In theory, the time constant 1/q2 can be identified from blood glucose (G1) and a calibrated sensor4,23 profile if the sensor glucose (SG) is available as an unfiltered signal. In the absence of filter delay, SG can be obtained by multiplying Equation (2) by the sensors calibration factor (CF) to obtain
| (4) |
Here, q2, K1 = CF · m · q1 and K2 = CF · q1 · OS are identifiable. Facchinetti and colleagues4 and Wei and associates23 used an equation similar to Equation (4) to estimate ISF delay but assumed the sensors to have zero OS current (K2 = 0) and the filter delay to be negligible. With those assumptions, Facchinetti and colleagues4 concluded the ISF delay to be 23.4 min, with a range of 17.9 to 33.8 min, and Wei and associates23 argued the delay to be 15.8 min with range of 10.8 to 21.4 min. The study by Wei et al.23 used the Medtronic Guardian system and speculated that the longer delay estimated in their study versus other studies17–20 could be attributed to the filter. The study by Facchinetti and colleagues4 used the Abbott Navigator system, assuming the device tracks ISF glucose with no added filter delay.
We argue that the longer delay estimated by Facchinetti and colleagues4 can be attributed to device filters and possibly OS, both of which were unaccounted for. We support this argument with Monte Carlo simulations. Using the ISF profile in Figure 2, 500 sensor profiles were simulated, each of which was assumed to be measured with a sensor having a sensitivity of 20 nA in 100 mg/dl and 2 nA OS. To each of the 500 profiles, 15% noise was added and a one-point calibration was performed (example profile Figure 3A). The delay was identified using Equation (4). As expected, this resulted in 500 delay estimates centered about the true mean of 12 min (Figure 3B, blue distribution), effectively demonstrating that the identification method produces an unbiased estimate of ISF delay. However, when the same profiles were filtered to remove noise, the delay was increased to ∼16.5 or 21 min (green and magenta distributions), depending on the level of filtering. To filter the data, infinite impulse response (IIR) filters were used with bandwidths set at 1.5 or 3 c/h, similar to the preferred settings described in Medtronic9 and DexCom11 patents and consistent with a finite impulse response (FIR) filter averaging 15 min of data described by Abbott25 (bandwidth = 1.675 c/h). The Abbott filter is described as being able to switch to a faster 2 min back in time filter (bandwidth = ∼9.325 c/h) when glucose is changing rapidly, making it difficult to estimate precisely the delay that would be added. Still, what is important to note is that, as the filter cutoff is reduced, the apparent ISF delay is increased. As the filter removes noise, the distribution of parameter estimates first narrows (green distribution more peaked than blue) and then increases as the filter results in an inability of the ISF model to fit the profile. Nonlinear least squares routines typically report estimates of this width as fractional standard deviation (identifications performed with routines available in MLAB).
Figure 3.
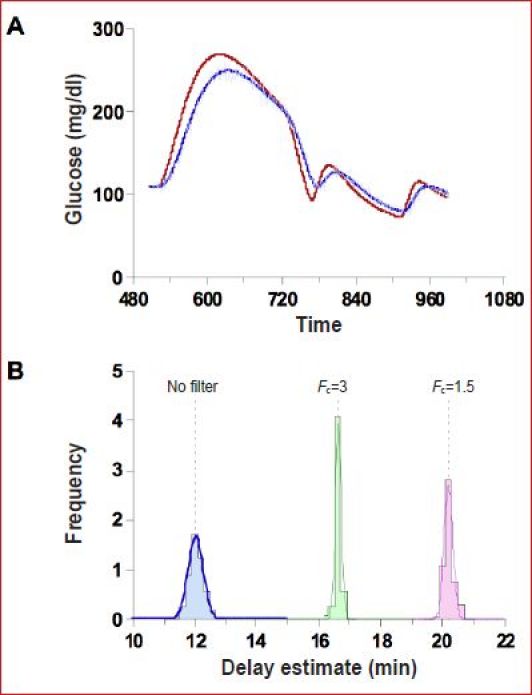
(A) One of 500 simulated blood and ISF glucose profiles assuming a sensor measuring 20 nA at 100 mg/dl of which 2 nA is OS together with noise. (B) Distribution of delay estimates assuming no filter (blue), assuming the noise is filtered with an IIR filter with cutoff frequency FC=1.5 c/h (green) or 3.0 c/h (magenta).
Impact of Interstitial Fluid Delay on Continuous Glucose Monitoring Performance
The 12-min time constant simulated here represents an upper bound to the true ISF delay previously reported, with shorter delays of 5–10 min being more commonly observed19,20 and targeted by Medtronic for correction.9 It can be argued that a 5–10 min ISF time constant is unlikely to have a substantial impact on the day-to-day treatment decisions made by individuals with type 1 diabetes. Still, the ISF delay can introduce substantial errors in calibration, making it particularly difficult to estimate OS. On the latter point, it is noteworthy that, if the OS is estimated from a random sample of BG and ISIG values in the example here, the OS can be estimated as 6 nA or more even when the simulated value is zero (Figure 4). The average OS current in the Medtronic MiniMed Guardian monitor was estimated to be 5.3 nA26 using a similar linear regression to that shown in Figure 4, but it is unclear in that study if the OS is related to delay per se (as simulated in Figure 4) or intrinsic to the sensor (i.e., would exist if all glucose measures were taken at steady state). Also unclear is whether the current used was filtered or unfiltered.
Figure 4.
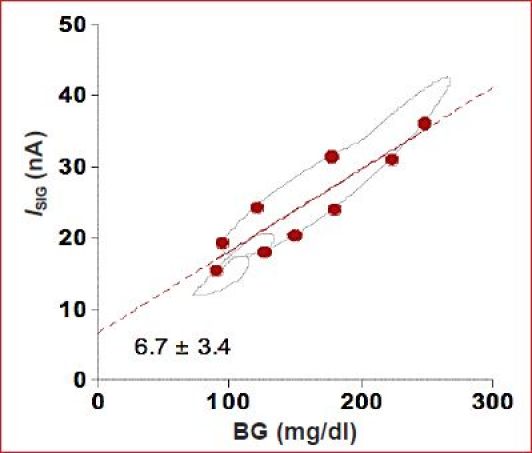
Linear regression estimate of OS current using BG–ISIG pairs (circles) randomly selected from all possible pairs (line). Regression artificially indicates the OS to be 6.7 nA even though the true (simulation) vale was zero.
Effectively, in the presence a 5–10 min time constant, the OS is virtually impossible to estimate without a substantial number of reference BG values taken under near-steady-state conditions spanning high and low values. When estimating sensor CFs and OS, a correction for transport lag is often made by simply pairing BG values with future ISIG values. This was done in the report by Youssef and coworkers26 and is common to many calibration algorithms. It is not clear, however, that such a shift will allow an unbiased estimate of either the CF or OS if the system responds with a time constant rather than a transport lag. If the OS cannot be estimated in real time, it can be set to a value that generates the lowest sensor error in the population. Using this latter approach, Youssef et al.26 estimated the optimal OS to be 4 nA. The value is not typically reported by device manufacturers. Device manufacturers may set the value in proportion to sensor sensitivity (see Figure 13 of Reference 10). Still, any mismatch between the true OS and the value used in the calibration algorithm will result in a CGM sensor that is unbiased at the calibration value (by definition) but underestimates BG above the calibration point and over-estimates the value below the point. For example, a sensor reading 20 nA at 100 mg/dl but with 5 nA OS, calibrated at 150 mg/dl, would yield the BG versus SG regression shown in Figure 5 (data points simulated with 3% glucose error and 5% signal error). Regions of over-estimation and underestimation (shaded and unshaded) can be obtained by comparing the regression line to the unbiased SG = BG line. Although the regression line shown in Figure 5 was obtained using standard least squares analysis, the expected slope and intercept can readily be derived from the algebraic steps used in calibration. That is, for a one-point calibration with an assumed OS of 0 nA, SG is calculated as
Figure 5.
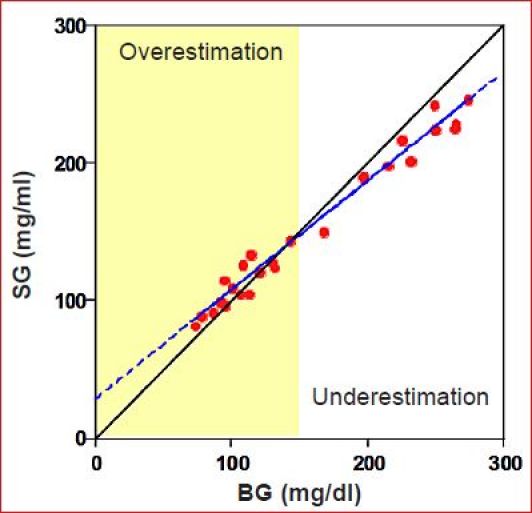
Effect of sensor OS on the BG–SG regression. Sensor is unbiased at the calibration point (150 mg/dl) but underestimates glucose above the calibration and overestimates it below the calibration point.
| (5) |
where BGCAL and ICAL refer to the calibration values. If the sensor has an OS, both the calibration current (ICAL) and sensor signal (ISIG) can be replaced by the relation in Equation (2):
| (6) |
where the expected straight-line relation between BG and SG is
| (7) |
Here it is easily seen that the slope is less than 1 and intercept greater than zero whenever the OS is greater than zero and that, if the OS is zero, the desired SG = BG relation is obtained. The bias in slope and OS can have substantial impact on the ability of a CGM system to detect hypoglycemia. For example, the current relationship estimated by Youssef and coworkers26 (ISIG = 0.0904 BG + 5.33) would be expected to yield an SG-BG regression with slope 0.63 and intercept 37 mg/dl. Thus, to obtain a 50% detection rate for glucose less than 60 mg/dl, the alarm would need to be set at ∼75 mg/dl (0.63 × 60 + 37), which can be expected to result in a substantial number of false alarms. It is difficult to determine how significant the OS problem is among manufacturers as, for the most part, studies reporting the relationship between BG and SG have replaced regression analysis with Clarke error grid analysis (see References 27–29 for examples of the DexCom,27 Abbott,28 and Medtronic29).
How Has Industry Responded?
This section reviews how sensor manufacturers have approached OS and delay correction. Virtually all sensor manufactures filter their sensor signals. As many readers may not be familiar with the design and implementation of filters, a brief review of some of the underlying concepts and technology is provided here. A critical design concept underlying classical filter design is “bandwidth.” A signal's bandwidth can be obtained by describing the signal as the sum of individual frequency components (ΣAi sin(2πfi + ϕi) where Ai is the magnitude of each component and fi and ϕi are frequency and phase, respectively. Values for Ai can be obtained from Fourier analysis (Ai shown in Figure 6B with signal reconstruction shown in Figure 6A). From this analysis, the signal bandwidth can be estimated as ∼1.5 c/h. Glucose profiles that change more rapidly than the example would require a higher cutoff.
Figure 6.
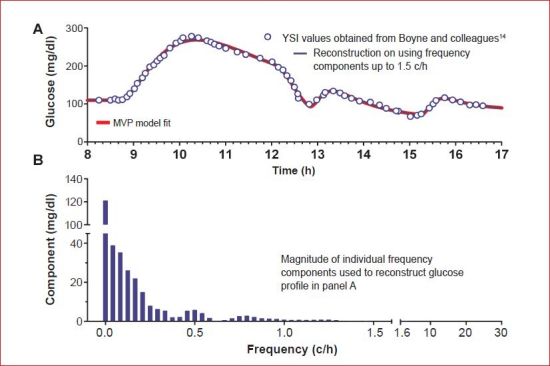
(A) Glucose data obtained from Boyne and colleagues14 together with Medtronic Virtual Patient model fit (red line) and reconstruction based on frequency components in the bandwidth <1.5 c/h. (B) Magnitude of frequency components assuming the sensor signal is sampled at 60 c/h (1/min). MVP, Medtronic Virtual Patient.
The bandwidth, or cutoff frequency, forms a key component in designing filters as the objective is to “pass” bands that are below the cutoff and “reject” those above as noise. Generally, filters with lower cutoff frequencies produce smoother signals but are less likely to follow rapid changes in glucose and more likely to introduce large delays. DexCom reports a preferred IIR embodiment with cutoff of 1.5 c/h (passes signals with 40 min period).11 Medtronic reports a preferred FIR embodiment with cutoff specified between 1.5 and 3 c/h.9 Abbott reports a FIR structure averaging 15 min of data but with the ability to switch to a 2 min back in time when glucose is changing rapidly (corresponding to cutoff frequencies of 1.675 and 9.325 c/h, respectively).25 All of these filters will pass the required components to reconstruct the example profile used in this article but will introduce delay. Generally, FIR filters delay each frequency component a fixed amount, referred to as phase delay, whereas IIR filters delay each component by slightly different amounts, referred to as phase distortion and quantified as group delay. Structurally, FIR filters are weighted averages of past sensor values, whereas IIR filters are weighted averages of past sensor values and past filtered sensor values (see Reference 7 for added discussion).
To obtain a filter that removes noise and compensates for ISF delay, Medtronic has patented a filter that infers G1 from the ISF glucose (G2 in Figure 2A) (compare Figure 21 of Reference 9 and the Appendix of Reference 18). The design follows Wiener filter theory in which FIR filter coefficients are obtained by minimizing the sum square error between SG and BG in the presence of noise.30 That is, Wiener filter theory works by obtaining FIR filter coefficients [c0, c1, … cp] that minimize the difference between SG(t),
| (8) |
and the corresponding BG values [BG(t1), BG(t2) … BG(tN)]. Filter coefficients can be chosen to suppress frequency components above the signal bandwidth (1.5 c/h; Figure 6); for example, if noise is added at frequencies above 1.5 c/h to the example sensor profile in this report, the filter coefficients [c0, c1, … cp] can be obtained as [ATA]−1AT BG, where A is the N × p + 1 matrix of sensor current values in Equation (8). In the simulation environment, all values of current and BG are known, making it relatively straightforward to obtain a filter that satisfies given design parameters (e.g., correct frequencies below 1.5 c/h for an ISF delay of 12 min and remove frequency components above 1.5 c/h). In practice, the filter coefficients are more likely to be obtained in a large population of real subjects, some of whom may require higher bandwidth to reconstruct their glucose excursions and have different ISF delays. Nonetheless, the simulation example works to demonstrate that critical aspects of the design depend only on the specified bandwidth (1.5 c/h for the example data) and ISF delay (simulated as 12 min). Choosing p = 13 (arbitrary) shows the resulting filter corrects delay and removes noise (Figure 7B, black line largely superimposing of the red BG line). While the example serves to demonstrate the design method, more optimal choices for p, bandwidth, and ISF delay may exist, and other design methods may be used to obtain the filter coefficients (see Reference 13).
Figure 7.
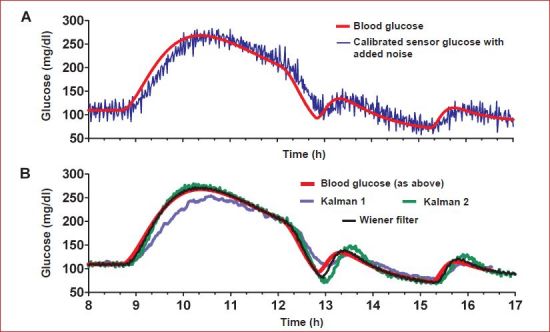
(A) Simulated blood and SG in the presence of noise. (B) Sensor glucose calculated after applying Wiener or two different Kalman filter designs.
The Wiener filter is generally considered to be one of the first “model-based” filters and is closely related to the better known Kalman filter. As the Kalman filter is frequently advocated by leading research groups,6–8 we review what the relationship is. Briefly, both approaches incorporate models in their design. The salient difference between the Kalman and Wiener filters is that the Wiener filter looks only to estimate the current glucose value whereas the Kalman filter looks to predict a future glucose value. In the Kalman filter, the idea is to switch between the prediction and the measurement depending on a time-varying estimate of statistical certainty. Kalman filters typically use models based on previous values of the measurement to make the prediction of the future measurement. However, if the sensor overestimates or underestimates BG (see Figure 5), the model may make a good prediction of the future sensor value without necessarily having a good estimation of the true blood value. In the Wiener filter presented here, which is typical of the Wiener approach,30 the model does not characterize the future sensor value as a function of prior sensor values; rather the model describes ISF glucose as a function of BG. The Wiener filter then performs what is essentially an inverse model calculation30 on frequency components within the glucose bandwidth to obtain an estimate of the current BG from the past and current ISF glucose values. The filter itself is actually no more than a fixed coefficient FIR filter; it does not make a prediction of future glucose, and its behavior does not vary with time.
Both the Wiener and Kalman filters can remove noise from a signal depending on how they are configured, and both can correct for delay depending on the model used. We show this by applying the Kalman filters proposed by Bequette and colleagues7 (labeled Kalman 1 in Figure 7) and by Facchinetti and associates8 (labeled Kalman 2) to our example profile. In the first case (Kalman 1), noise in the ISF signal is removed, but the delay is not corrected (blue line, panel B) as no internal model of ISF glucose delay is incorporated in the design. This result can be compared to the approach put forth by Facchinetti and associates,8 where a discrete version of Equation (4) was used as the model and the delay was corrected (Figure 7B, green line, for the most part superimposing over the BG and Wiener filter lines). A more comprehensive evaluation in which all the filters are compared using a large clinical data set is, however, necessary to avoid any bias introduced by using a single data set to both derive and evaluate the filter.
In addition to being able to switch between measurement and prediction, Kalman filters can be configured to adapt to changes in the model. For example, the Kalman filter by Facchinetti and associates8 adapts to changes in the sensor calibration as does a version of the Kalman filter proposed by Kuure-Kinsey and coworkers.31 A third Kalman filter, proposed by Knobbe and Buckingham6 (not simulated here), includes components that adapt to both changes in sensitivity and changes in time delay. None of the Kalman designs reviewed here, however, attempted to adapt to different or time-varying changes in OS. In the Wiener approach, changes in sensor sensitivity and OS would most likely be tracked by the calibration algorithm. This strategy tends to be more common in the existing CGM monitors, where the sensor current signal is first filtered and then calibrated. The calibration algorithm can be configured to use a recursive least squares32 procedure to estimate the regression shown in Figure 4 once the confounding effect of the delay is removed. In doing so, it may also be possible to modify the regression to include errors in both the sensor current and measured BG.33 Wiener filter coefficients can be made to adapt to changes in the ISF time constant by recasting Equation (8) in recursive form. However, the recursive least squares formulation requires a gain similar to the Kalman gain. A high gain can potentially result in complete adaptation as the number of new blood samples approaches the number of coefficients in the filter; however, in practice, this is not done, as it makes the parameter updates very sensitive to noise. This is pointed out here to emphasize that any adaptive process is unlikely to perform well, if CGM systems strive to reduce the number of calibration points.
Generally, model-based approaches to filtering that rely on prediction of future values can be expected to improve performance whenever those values are well estimated. For systems described by deterministic equations, for example, falling objects described by laws governing gravity, the future prediction can be quite accurate, with the benefit being achieved whenever the model is more accurate than the measurement. In other systems, for example, daily weather patterns or the DOW Jones industrial average, the prediction of future values may never be more reliable than the measurement. Of the CGM patent literature reviewed here, the only medical device manufacturer to describe a specific embodiment of the Kalman filter is Abbott Diabetes Care, who describes the use of the Bergman minimal model to predict glucose from knowledge of meals and insulin25 (i.e., the model used here to fit the Boyne data in Figure 1). To our knowledge, no medical device company has implemented a Kalman filter to improve glucose estimation.
Conclusions
In this article, we reexamined the arguments that the glucose response in the SC ISF is delayed by any more than 5–10 min with respect to BG, taking care to review methods being pursued in the medical device industry, as described in patents, together with proposals from engineers in academia. Our focus on industry was motivated by the observation that clinical researchers are often unaware of how different CGM devices process the ISF glucose signal and how these processes might be contributing to their conclusions regarding ISF glucose delay. Our findings and arguments can be summarized as follows:
There is no evidence that the ISF glucose time constant is longer than 5–10 min. Delay estimates longer than this can typically be explained by the delay associated with the device filters (Figure 3).
The impact of a 5–10 min time constant on treatment decisions is unlikely to be of major importance; however, if the delay is compounded by an additional 5–15 min filter delay, the impact to the patient could be substantial.
The ISF delay creates problems in obtaining an accurate calibration, making the real-time estimate of OS particularly difficult (Figure 4) and reducing the ability to detect hypoglycemia (Figure 5).
Signal processing algorithms advocated to reconstruct BG from the ISF glucose using linear deconvolution25 will have error if applied to systems that have nonlinear filters (e.g., filters described in patents10,25).
Undoubtedly, part of the problem academic research groups face when attempting to use CGM devices for research purposes is that device manufacturers may not provide the necessary details to reconstruct what the device does outside its intended use. Device manufacturers may be reluctant to provide the unfiltered current values needed to identify delays. Advances in metabolic modeling techniques can potentially circumvent some of these issues; we note, for example, that the extended Kalman filter proposed by Facchinetti et al.8 was derived entirely from simulated data as were all the examples presented in this report. We believe the simulation environment may actually be superior in some ways to having “real” sensor signals in which the signal has been preprocessed with an unknown filter. The simulation environment provides clear advantages as a starting point for developing new filter and calibration algorithms in that theoretical properties of a filter can be easily validated and an infinite number of subjects can be simulated. Simulation studies never lack power to detect differences between algorithms.
Although the simulation environment has many ideal properties, we believe it is essential that the simulated glucose profiles have a signal bandwidth not statistically different from the general population and that the model used to simulate ISF glucose have delays not statistically different from those observed in studies in which it has been measured without device delay. Thus we would rather have seen the Facchinetti filter derived using a 5–10 minute ISF delay and have seen results in which OS was identified. Once clinical data does become available, a comparison of different filters should be conducted on the clinical rather than the model-simulated data. Simulations should be considered a training or developmental step, and clinical data should be used for final evaluation and validation. When comparing filter algorithms, it will also be important to ensure each algorithm is optimally configured; for example, we draw no conclusions regarding the comparison in Figure 7, as we did not derive an optimal Wiener filter and expect that each of the Kalman filters might undergo further refinement.
Although patents provide a substantial amount of information, algorithms described in them may not necessarily be the same algorithms that exist in the product. Algorithms may be patented well before they appear in a product. If a product is to be evaluated outside of its intended use, academic researchers should be willing to involve industry when designing and/or conducting the studies. We believe the reluctance of investigators to involve industry has resulted in a substantial number of studies in which the conclusions are predicated on an incomplete understanding of what the devices actually do. Further, if academic investigators were to compare their algorithms to approaches described in the patent literature, the potential impact of their work would be enhanced. Clearly, many investigators believe new calibration and filtering strategies can be developed to address problems with the sensor signals. Many of these investigators (41%) believe that, if such improvements are made, the existing sensor technology would be sufficient to achieve closed-loop control.5 It remains to be determined what the actual level of sensor performance will need to be to create a product.
Abbreviations
- BG
blood glucose
- CF
calibration factor
- CGM
continuous glucose monitoring
- FIR
finite impulse response
- IIR
infinite impulse response
- ISF
interstitial fluid
- OS
offset
- SC
subcutaneous
- SG
sensor glucose
References
- 1.Velho G, Froguel P, Thevenot DR, Reach G. Strategies for calibrating a subcutaneous glucose sensor. Biomed Biochem Acta. 1989;48(11–12):957–964. [PubMed] [Google Scholar]
- 2.Choleau C, Klein JC, Reach G, Aussedat B, Demaria-Pesce V, Wilson GS, Gifford R, Ward WK. Calibration of a subcutaneous amperometric glucose sensor implanted for 7 days in diabetic patients. Part 2. Superiority of the one-point calibration method. Biosens Bioelectron. 2002;17(8):647–654. doi: 10.1016/s0956-5663(01)00304-9. [DOI] [PubMed] [Google Scholar]
- 3.Schmidtke DW, Freeland AC, Heller A, Bonnecaze RT. Measure-ment and modeling of the transient difference between blood and subcutaneous glucose concentrations in the rat after injection of insulin. Proc Natl Acad Sci U S A. 1998;95(1):294–299. doi: 10.1073/pnas.95.1.294. [DOI] [PMC free article] [PubMed] [Google Scholar]
- 4.Facchinetti A, Sparacino G, Cobelli C. Reconstruction of glucose in plasma from interstitial fluid continuous glucose monitoring data: role of sensor calibration. J Diabetes Sci Technol. 2007;1(5):617–623. doi: 10.1177/193229680700100504. [DOI] [PMC free article] [PubMed] [Google Scholar]
- 5.Steil GM, Hipszer B, Reifman J. Update on mathematical modeling research to support the development of automated insulin delivery systems. J Diabetes Sci Technol. 2010;4(3):759–769. doi: 10.1177/193229681000400334. [DOI] [PMC free article] [PubMed] [Google Scholar]
- 6.Knobbe EJ, Buckingham B. The extended Kalman filter for continuous glucose monitoring. Diabetes Technol Ther. 2005;7(1):15–27. doi: 10.1089/dia.2005.7.15. [DOI] [PubMed] [Google Scholar]
- 7.Bequette BW. Continuous glucose monitoring: real-time algorithms for calibration, filtering, and alarms. J Diabetes Sci Technol. 2010;4(2):404–418. doi: 10.1177/193229681000400222. [DOI] [PMC free article] [PubMed] [Google Scholar]
- 8.Facchinetti A, Sparacino G, Cobelli C. Enhanced accuracy of continuous glucose monitoring by online extended kalman filtering. Diabetes Technol Ther. 2010;12(5):353–363. doi: 10.1089/dia.2009.0158. [DOI] [PubMed] [Google Scholar]
- 9.Steil GM, Kanderian SS., Jr Apparatus and method for controlling insulin infusion with state variable feedback. U.S. Patent Application 2010/0114015. Filed May 1, 2009.
- 10.Mastrototaro JJ, Gross TM, Shin JJ. Glucose monitor calibration methods. U.S. Patent Application 09/511580. Filed February 23, 2000.
- 11.Goode PV, Jr, Brauker JH, Kamath AU, Carr-Brendel V. System and methods for processing analyte sensor data. U.S. Patent Application 12/102729. Filed April 14, 2008.
- 12.Budiman ES. Method and system for providing analyte monitoring. U.S. Patent Application 12/506227. Filed July 20, 2009.
- 13.Kovatchev BP, Breton M, Man CD, Cobelli C. In silico preclinical trials: a proof of concept in closed-loop control of type 1 diabetes. J Diabetes Sci Technol. 2009;3(1):44–55. doi: 10.1177/193229680900300106. [DOI] [PMC free article] [PubMed] [Google Scholar]
- 14.Boyne MS, Silver DM, Kaplan J, Saudek CD. Timing of changes in interstitial and venous blood glucose measured with a continuous subcutaneous glucose sensor. Diabetes. 2003;52(11):2790–2794. doi: 10.2337/diabetes.52.11.2790. [DOI] [PubMed] [Google Scholar]
- 15.Kanderian SS, Weinzimer S, Voskanyan G, Steil GM. Identification of intraday metabolic profiles during closed-loop glucose control in individuals with type 1 diabetes. J Diabetes Sci Technol. 2009;3(5):1047–1057. doi: 10.1177/193229680900300508. [DOI] [PMC free article] [PubMed] [Google Scholar]
- 16.Stocker DN, Kanderian S, Cortina GJ, Nitzan T, Plummer J, Steil GM, Mastrototaro JJ. Virtual patient software system for educating and treating individuals with diabetes. U.S. Patent Application 2006/0272652. Filed June 3, 2005.
- 17.Rebrin K, Steil GM. Can interstitial glucose assessment replace blood glucose measurements? Diabetes Technol Ther. 2000;2(3):461–472. doi: 10.1089/15209150050194332. [DOI] [PubMed] [Google Scholar]
- 18.Rebrin K, Steil GM, Van Antwerp WP, Mastrototaro JJ. Subcutaneous glucose predicts plasma glucose independent of insulin: implications for continuous monitoring. Am J Physiol. 1999;277(3 Pt 1):E561–571. doi: 10.1152/ajpendo.1999.277.3.E561. [DOI] [PubMed] [Google Scholar]
- 19.Steil GM, Rebrin K, Mastrototaro J, Bernaba B, Saad MF. Determination of plasma glucose during rapid glucose excursions with a subcutaneous glucose sensor. Diabetes Technol Ther. 2003;5(1):27–31. doi: 10.1089/152091503763816436. [DOI] [PubMed] [Google Scholar]
- 20.Steil GM, Rebrin K, Hariri F, Jinagonda S, Tadros S, Darwin C, Saad MF. Interstitial fluid glucose dynamics during insulin-induced hypoglycaemia. Diabetologia. 2005;48(9):1833–1840. doi: 10.1007/s00125-005-1852-x. [DOI] [PubMed] [Google Scholar]
- 21.Voskanyan G, Barry Keenan D, Mastrototaro JJ, Steil GM. Putative delays in interstitial fluid (ISF) glucose kinetics can be attributed to the glucose sensing systems used to measure them rather than the delay in ISF glucose itself. J Diabetes Sci Technol. 2007;1(5):639–644. doi: 10.1177/193229680700100507. [DOI] [PMC free article] [PubMed] [Google Scholar]
- 22.Facchinetti A, Sparacino G, Cobelli C. Modeling the error of continuous glucose monitoring sensor data: critical aspects discussed through simulation studies. J Diabetes Sci Technol. 2010;4(1):4–14. doi: 10.1177/193229681000400102. [DOI] [PMC free article] [PubMed] [Google Scholar]
- 23.Wei C, Lunn DJ, Acerini CL, Allen JM, Larsen AM, Wilinska ME, Dunger DB, Hovorka R. Measurement delay associated with the Guardian RT continuous glucose monitoring system. Diabet Med. 2010;27(1):117–122. doi: 10.1111/j.1464-5491.2009.02887.x. [DOI] [PMC free article] [PubMed] [Google Scholar]
- 24.Monsod TP, Flanagan DE, Rife F, Saenz R, Caprio S, Sherwin RS, Tamborlane WV. Do sensor glucose levels accurately predict plasma glucose concentrations during hypoglycemia and hyper-insulinemia? Diabetes Care. 2002;25(5):889–893. doi: 10.2337/diacare.25.5.889. [DOI] [PubMed] [Google Scholar]
- 25.Hayter G, McGarraugh GV, Naegeli AH, Mazza JC, Feldman BJ. Method and apparatus for providing data processing and control in a medical communication system. U.S. Patent 7768386. Issued August 3, 2010.
- 26.Youssef JE, Castle JR, Engle JM, Massoud RG, Ward WK. Continuous glucose monitoring in subjects with type 1 diabetes: improvement in accuracy by correcting for background current. Diabetes Technol Ther. doi: 10.1089/dia.2010.0020. To be published. [DOI] [PMC free article] [PubMed] [Google Scholar]
- 27.Zisser HC, Bailey TS, Schwartz S, Ratner RE, Wise J. Accuracy of the SEVEN continuous glucose monitoring system: comparison with frequently sampled venous glucose measurements. J Diabetes Sci Technol. 2009;3(5):1146–1154. doi: 10.1177/193229680900300519. [DOI] [PMC free article] [PubMed] [Google Scholar]
- 28.Weinstein RL, Schwartz SL, Brazg RL, Bugler JR, Peyser TA, McGarraugh GV. Accuracy of the 5-day FreeStyle Navigator Continuous Glucose Monitoring System: comparison with frequent laboratory reference measurements. Diabetes Care. 2007;30(5):1125–1130. doi: 10.2337/dc06-1602. [DOI] [PubMed] [Google Scholar]
- 29.Mastrototaro J, Shin J, Marcus A, Sulur G. STAR 1 Clinical Trial Investigators. The accuracy and efficacy of real-time continuous glucose monitoring sensor in patients with type 1 diabetes. Diabetes Technol Ther. 2008;10(5):385–390. doi: 10.1089/dia.2007.0291. [DOI] [PubMed] [Google Scholar]
- 30.Proakis JG, Manolakis DG. Digital signal processing: principles, algorithms, and applications. New Delhi: Prentice-Hall; 1996. [Google Scholar]
- 31.Kuure-Kinsey M, Palerm CC, Bequette BW. A dual-rate Kalman filter for continuous glucose monitoring. Conf Proc IEEE Eng Med Biol Soc. 2006;1:63–66. doi: 10.1109/IEMBS.2006.260057. [DOI] [PubMed] [Google Scholar]
- 32.Franklin GF, Powell JD. Digital control of dynamic systems. Reading: Addison-Wesley; 1981. [Google Scholar]
- 33.Panteleon AE, Rebrin K, Steil GM. The role of the independent variable to glucose sensor calibration. Diabetes Technol Ther. 2003;5(3):401–410. doi: 10.1089/152091503765691901. [DOI] [PubMed] [Google Scholar]


