

Abstract
Background
The bioluminescence technique was used to quantify the local glucose concentration in the tissue surrounding subcutaneously implanted polyurethane material and surrounding glucose sensors. In addition, some implants were coated with a single layer of adipose-derived stromal cells (ASCs) because these cells improve the wound-healing response around biomaterials.
Methods
Control and ASC-coated implants were implanted subcutaneously in rats for 1 or 8 weeks (polyurethane) or for 1 week only (glucose sensors). Tissue biopsies adjacent to the implant were immediately frozen at the time of explant. Cryosections were assayed for glucose concentration profile using the bioluminescence technique.
Results
For the polyurethane samples, no significant differences in glucose concentration within 100 μm of the implant surface were found between bare and ASC-coated implants at 1 or 8 weeks. A glucose concentration gradient was demonstrated around the glucose sensors. For all sensors, the minimum glucose concentration of approximately 4 mM was found at the implant surface and increased with distance from the sensor surface until the glucose concentration peaked at approximately 7 mM at 100 μm. Then the glucose concentration decreased to 5.5–6.5 mM more than 100 μmm from the surface.
Conclusions
The ASC attachment to polyurethane and to glucose sensors did not change the glucose profiles in the tissue surrounding the implants. Although most glucose sensors incorporate a diffusion barrier to reduce the gradient of glucose and oxygen in the tissue, it is typically assumed that there is no steep glucose gradient around the sensors. However, a glucose gradient was observed around the sensors. A more complete understanding of glucose transport and concentration gradients around sensors is critical.
Keywords: adipose-derived stromal cells, bioluminescence, glucose profile, glucose sensor
Introduction
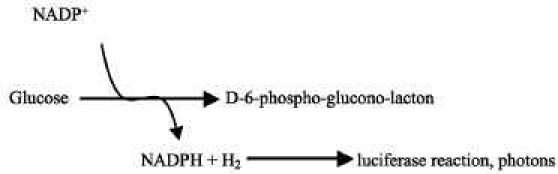
Quantitative bioluminescence has been used for metabolite mapping in tumors and other patho-physiological tissues.1,2 The bioluminescence technique requires that tissue be rapidly frozen, which yields a “snapshot” of the metabolite concentrations. Briefly, as depicted in Figure 1, cryosections are immersed in an enzyme solution using a specifically designed sandwich array that is positioned on a thermostatically controlled microscope stage. The solution contains a mixture of enzymes and cofactors that link the substrate of interest, such as glucose, to a reduced nicotinamide adenine dinucleotide phosphate (NADPH)-dependent light reaction, in which the rate of light emission is dependent on the substrate concentration. The necessary light-producing enzyme is a bacterial luciferase (complete description is given by Mueller-Klieser and Walenta1).
Figure 1.
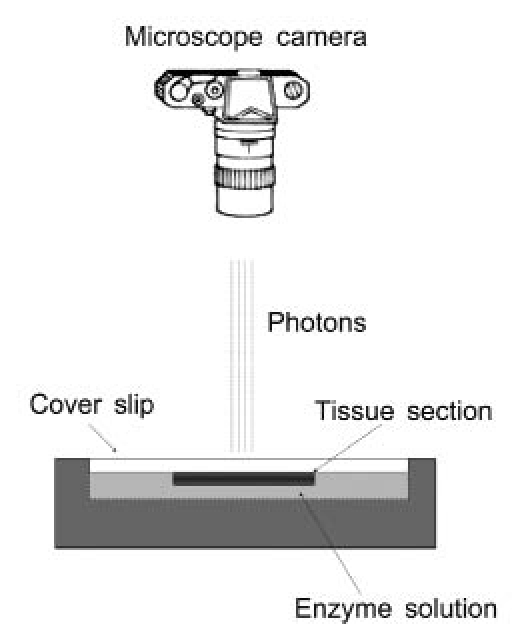
Bioluminescence setup: frozen tissue is brought into contact with an enzyme solution, and upon warming, glucose reacts with luciferase-emitting photons, which are captured by the camera.
 |
The integration time is adjusted to cover the peak activity of the enzyme mixture, which, for glucose, has been a 60 s interval. Using appropriate standards (cryosectioning embedding medium, spiked with known concentrations of glucose, sliced and imaged), distributions can be quantified and displayed as color-coded images to illustrate spatial distribution.
The experiments described herein used the bio-luminescence technique to image the tissue surrounding adipose-derived stromal cell (ASC)-coated implants. Prior research showed that implants placed in adipose tissue generate less fibrous encapsulation and more microvessels in the surrounding tissue than implants placed in lean tissue.3,4 Additionally, the pre-implantation attachment of ASCs has been shown to ameliorate the wound-healing response around implants by reducing the thickness of the fibrous capsule and the amount of collagen contained in the capsule in addition to increasing the microvasculature in the surrounding tissue.5
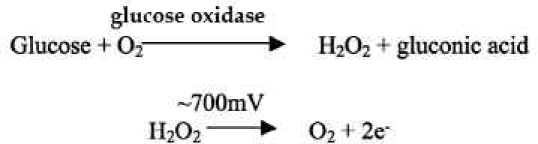
Additionally, Medtronic MiniMed® glucose sensors were implanted, and the adjacent tissue was evaluated with the bioluminescence technique. A picture of the MiniMed sensor and transmitter is shown in Figure 2A, and a more detailed schematic of the sensor tip is shown in Figure 2B. The system consists of a subcutaneously implanted needle-type amperometric enzyme electrode coupled to a portable data recorder. The sensor tip, which is the active site, is 15 mm long and 0.5 mm in diameter. An outer coating of polyurethane protects the sensor, which is very fragile. The actual sensor has a polyimide backing that is gold plated with platinum and silver chloride electroplated electrodes. The sensor is based on the long-established technology of glucose oxidase immobilized at a positively charged base electrode, with electrochemical detection of hydrogen peroxide production:6
Figure 2.
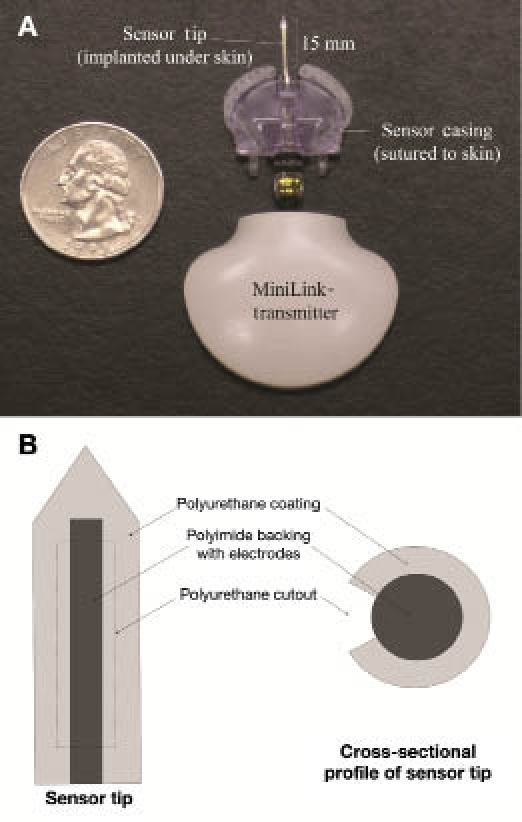
(A) MiniMed sensor and transmitter and (B) diagram of sensor tip. In vivo, the sensor tip is implanted dorsally under the skin, and the sensor casing is sutured to the skin. The transmitter is contained within a pocket in a rat jacket.
 |
The glucose oxidase layer is exposed only in the cut-out region and therefore not distributed evenly around the sensor.
The purpose of the current study was to image glucose in the tissue surrounding ASC-coated implants, both polyurethane materials and actual glucose sensors. These experiments will determine if the functional sensor or the attached cells are consuming a large amount of glucose, which could be detrimental to the glucose sensor. In addition, the control materials provide a means of evaluating the homogeneity of glucose distribution in the tissue surrounding a bare implant.
Materials and Methods
Cell Isolation
Adult ASCs were aseptically isolated from the inguinal fat pad of syngeneic male Lewis rats (Charles River Laboratories, Wilmington, MA) as described previously.7 All solutions used were sterile, as consistent with aseptic technique. Briefly, the fat was surgically isolated, rinsed, minced, incubated in collagenase A, separated by centrifugation, and treated for 1 min with red cell lysis buffer. The isolated cells were plated at a density of 1 × 10⁶ cells per T75 flask and subsequently frozen at a density of 5 × 10⁵ cells/ml of freezing media [α-MEM (minimum essential medium, alpha medium), 20% fetal bovine serum (FBS), and 10% dimethyl sulfoxide]. The cells were frozen to allow the same isolation to provide cells for all experiments. Cells were thawed two days prior to attachment at a density of 7.5 × 10⁵ viable cells per T75 flask. The differentiation potential of both fresh isolates and frozen cells was confirmed to ensure the cells retained their multipotent potential after freezing. Briefly, cells were differentiated into adipocytes and osteoblasts to confirm that an ASC population was truly isolated. Adipogenic media contained Dulbecco's modified Eagle's media (DMEM), 10% FBS, 0.5 mM isobutylmethylxanthine, 10 μmM insulin, 0.5 μmM dexamethasone, and 1% penicillin/streptomycin.8 Osteogenic media contained DMEM, 10% FBS, 10 mM b-glycerol phosphate, 50 μmg/ml ascorbate 2-phosphate, 10 nM dexamethasone, 100 U/ml penicillin, and 0.1 mg/ml streptomycin.9 Oil Red O staining after 28 days in culture was used to confirm adipose differentiation, and von Kossa staining after 28 days was used to confirm osteoblast differentiation.
Cell Attachment to Materials
Previous experiments focused on optimizing an attach-ment method for adipose stem cells on polyurethane.7 For the polyurethane samples, medical-grade polyurethane Pellethane 2363-80AE-050824, a soft segment polyurethane based on polyether and aromatic isocyanate (Polyzen, Inc., Apex, NC) was cut into 1 × 1 cm squares of 0.8 mm thickness and sterilized by ethylene oxide. One day prior to implant, the materials were assigned to one of the following treatment groups:
Control (bare): The control materials were simply washed in poly(butylene succinate) (PBS) and then incubated in media (α-MEM + 10% FBS) for 24 h prior to implantation.
ASC-coated materials: ASC-coated materials were washed in PBS and incubated for 2 h at 37 °C in 600 μml of 25 μmg/ml fibronectin in PBS followed by a PBS rinse. Then a cell suspension of 1.6 × 10⁵ ASCs in α-MEM + 10% FBS was added to each well and incubated for 24 h prior to implantation.
For the MiniMed glucose sensors, six sensors were tested. Three of the sensors were used as controls and soaked in media overnight prior to implantation. For all sensor soakings, the sensor tip was placed through a small hole in a Parafilm cover over a 24-well plate with 3 ml of solution, which was placed on a rocker at medium speed for the allotted time at 37 °C. The remaining three sensors had ASCs attached on the day prior to implantation using the fibronectin attachment. The sensors were soaked in fibronectin for 2 h at 37 °C, followed by a cell solution, 1 × 10⁶ cells/well, for 24 h. Cell coverage was assessed after labeling ASCs with calcein and viewing under fluorescent microscopy. The three-dimensional surface made quantification difficult, but polyurethane samples had approximately 90% coverage, while the MiniMed sensors had approximately 50% coverage.
In Vivo Studies
The animal protocol was approved by the Institutional Animal Care and Use Committee at Duke University prior to initiation of any studies. The polyurethane samples were implanted for 1 and 8 weeks (five rats per time point). Rats were anesthetized with isoflurane (2.5–3%) and shaved, and the skin was prepared with chlorhexidine and alcohol. Two polyurethane implants were placed in each rat. A 1 cm lateral incision was made, and a small subcutaneous pocket was formed. The implant position for each animal was rotated so that the implants at each time point occupied all possible positions. Each implant was inserted with the treated side toward the skin, and the incision was closed with wound clips. The wound clips were removed seven days after surgery. At the time of explant, rats were anesthetized with isoflurane (2.5–3%) and shaved. For each sample, the implant and tissue surrounding the implant were removed, embedded in optimal cutting temperature (OCT) compound using aluminum base molds, and immediately snap frozen. The material was located, and using blunt dissection, a large area of tissue, approximately 5 × 5 cm, around the material was isolated. This tissue was then trimmed to smaller dimensions, approximately 2 × 2 cm, and the tissue was placed in a mold in a liquid nitrogen and dry ice slurry for freezing. The tissue remained frozen until it was sectioned. The tissue was used for foreign body response analysis5 as well as for bioluminescence experiments.
For the MiniMed glucose sensor experiments, rats were acclimated to wearing the rat jackets (Harvard apparatus) with dummy transmitters for five days prior to implantation. The jacket fits around the rat's chest, and the transmitter, shown in Figure 2A, fits into a pocket on the jacket directly above the sensor between the scapulae and neck of the rat. Rats were anesthetized and prepared as discussed. One sensor was implanted into each rat. A 16 G needle along with a 2.5 cm introducer were inserted between the scapulae. The needle was withdrawn and the sensor inserted. Figure 2 shows an example of the MiniMed sensors and transmitters that were used. Sensors were sutured to the skin and connected to the transmitter. After one week, the sensors were explanted and blood from the tail vein used to determine the blood glucose. Each implant was removed along with the adjacent tissue, embedded in OCT compound using aluminum base molds, and immediately snap frozen. The sensor was located, and using blunt dissection, a large area of tissue, approximately 5 × 5 cm, around the sensor was isolated. This tissue was then trimmed to smaller dimensions, approximately 1 × 2 cm around the sensor tip. Then the sensor connection to the plastic casing was severed, and the tissue was placed in a mold in a liquid nitrogen and dry ice slurry for freezing. The time from cutting the sensor connection to freezing was less than 30 s. The tissue remained frozen until it was sectioned. During sectioning, the working electrode on the sensor was located by geometry, and sections were cut.
Bioluminescence Imaging
All tissue remained frozen and was sectioned at −25 to −30 °C, 20 μmm thickness using a cryostat, transferred to a glass cover slip while still frozen, and allowed to attach. Sections were dehydrated using a lyophilizer and stored at −80 °C until microscopic analysis. The bioluminescence reaction was carried out in a temperature-stabilized stainless-steel reaction chamber at 25 °C in a light-protected environment using a fluorescence microscope (Zeiss, Thornwood, NY) with a cooled 16-bit charge-coupled device camera with photon counting capability (Andor, South Windsor, CT). The sections were brought into contact with glucose reaction solutions following a previously published protocol.2,10 Photon flux was integrated at an overall magnification level of X50 over a time interval of 60 s after a 10 s incubation. Resolution was approximately 50 μm, although higher magnification (and smaller field width) could increase resolution to 20 μm.1 Analyte concentrations within images were calibrated using analyte standards. Image analysis was performed using ImageJ (National Institutes of Health imaging software). All figures depict mean ± standard error of the mean. Differences between groups were assessed parametrically using a Student's t-test.
Results
Figure 3 is a macro photo of the ASC-coated sensor with visible cells attached to the sensor tip. Although the sensor exhibits some autofluorescence, the cells stained with cell tracker green (Molecular Probes/Invitrogen, Carlsbad, CA) are clearly visible on the polyurethane coating. No skin irritation, inflammation, or infection was seen in any of the implant sites at the time of explant.
Figure 3.
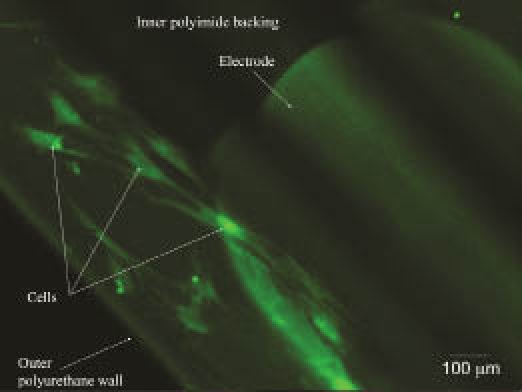
Fluorescent micrograph of ASCs labeled with calcein attached to a MiniMed sensor.
The results from the bioluminescence imaging of the polyurethane samples are summarized in Figure 4. Tissue average glucose concentrations within 100 μm of the implant surface are shown. Typical glucose concentration in rat subcutis tissue is 5–7 mM. There were no significant differences between bare and ASC-coated implants at 1 or 8 weeks.
Figure 4.
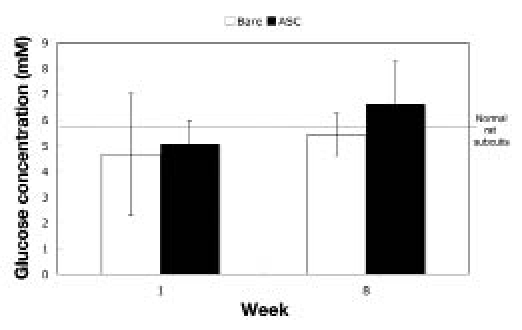
Glucose concentration in tissue surrounding polyurethane implants. Glucose measurements were taken 100 μm from the implant surface (N = 5 for each sample at each time; mean ± standard error of the mean). Gray horizontal line indicates overall mean.
The glucose concentration profile in the tissue surrounding glucose sensors is shown in Figures 5 and 6. Five sensors were evaluated (one sample did not freeze properly and was deleted). Concentric rings were selected, and an average glucose concentration was determined for each ring. As depicted in Figure 5, the first ring had a radius of approximately 50 μm from the implant surface, and the second ring continued another 50 μm from the outer edge of the first ring. The third measurement was taken in a 1 mm2 area away from the implant. In addition, the blood glucose of the animals was taken within 10 min of explant. In all cases, the blood glucose was 6–7 mM.
Figure 5.
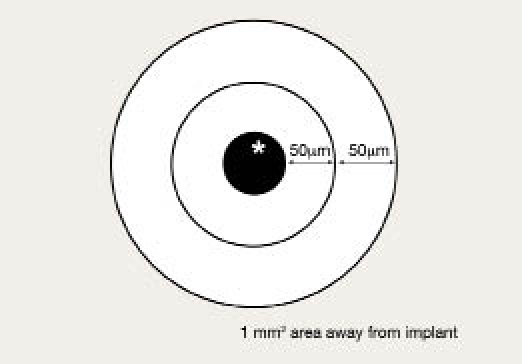
Schematic of bioluminescence measurements around glucose sensors.
Figure 6.
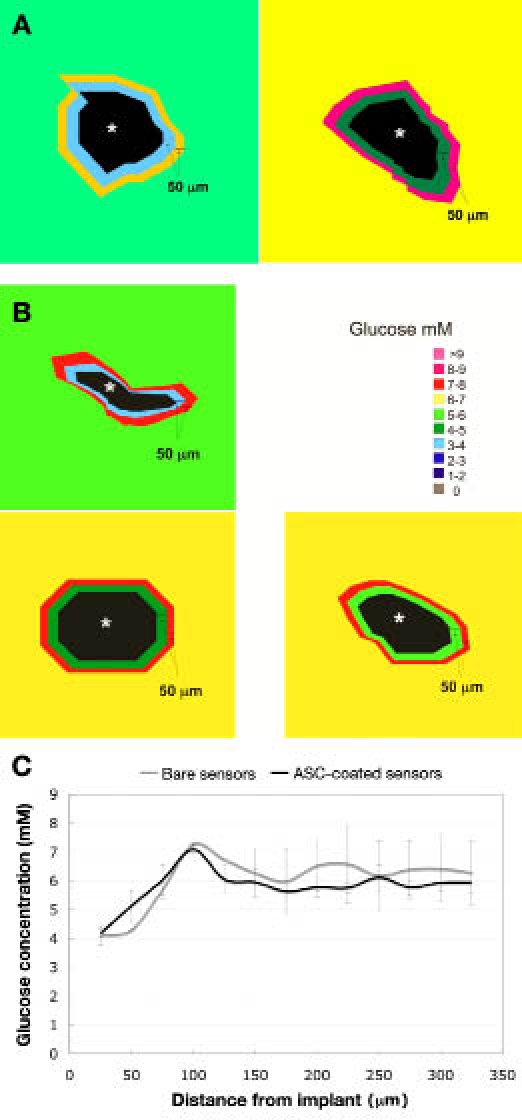
Glucose concentration profile in tissue surrounding (A) bare glucose sensors and (B) ASC-coated glucose sensors (sensor denoted by the asterisk). Each concentric ring in 50 μm and outside area is the overall tissue concentration. Normal rat subcutis glucose is 5–7 mM. (C) Radial profile of tissue glucose concentration as a function of distance from the implant (mean ± standard error of the mean).
The radial profile of tissue glucose is also shown in Figure 6. For both the bare and ASC-coated glucose sensors, the minimum glucose concentration was at the implant surface followed by an increase that reached approximately 7 mM at 100 μm from the surface then decreased to approximately 6 mM.
Discussion
These experiments used the bioluminescence technique to image the tissue surrounding bare and ASC-coated polyurethane, as well as bare and ASC-coated MiniMed glucose sensors. The choice of ASCs was based on previous findings that adipose tissue initiates a less aggressive response to implants3,4 and specifically that ASC coating of materials improves the foreign body response around implants.5
The bioluminescence technique produces a profile of metabolite concentration from which it could be determined if the ASCs attached consumed a large amount of glucose that could be detrimental for a glucose sensor. In addition, the glucose profile around glucose sensors could be used to determine if the sensors induced a steep glucose gradient in the surrounding tissue due to their glucose consumption.
Figure 3 displays pictures of ASCs that have been attached to sensors using the fibronectin protocol. The cells were attached 24 h prior to imaging. The pictures show that the cells did attach and spread to the polyurethane coating on the sensor tip during the 24 h incubation.
As seen in Figure 4 for the polyurethane implants, no significant differences were observed in glucose concentration within 100 μm of the implant surface. This observation suggests that the attached ASCs were not consuming a high amount of glucose at the material surface. Additionally, the glucose concentration was evenly distributed in the tissue surrounding both the bare and ASC-coated polyurethane, which indicates that the gradient observed around the sensors was not an artifact of the technique.
The current of the sensors increased after the glucose injection with an approximately 10 min greater delay than the delay seen in glucose from tail vein blood samples. It then returned to baseline approximately 10 min after the tail vein blood glucose values. This was seen in absolute current readings of the sensor, but conversion of current to absolute glucose was not possible without the proprietary software.
Bioluminescence images from the glucose sensors are shown in Figure 6. In the first ring around the sensor tip, the glucose concentration ranged from 3–5 mM for the bare sensors and 3–6 mM for the ASC-coated sensors. Additionally, no glucose was detected in the area occupied by the sensor. For all five sensors, the lowest glucose concentration was found in the first ring at the edge of the sensor tip, and the second ring had a slightly higher glucose concentration. In addition, the radial profile of the tissue glucose concentration as a function of distance from the sensor is also shown in Figure 6. For both the bare and ASC-coated glucose sensors, the minimum glucose concentration was at the implant surface. The glucose concentration then increased and peaked at approximately 7 mM at 100 μm from the implant surface. Beyond the 100 μm distance, the glucose concentration decreased to a baseline of approximately 6 mM.
Additionally, blood glucose measurements were taken within 10 min of tissue harvest by withdrawing blood from a tail vein and using a OneStep® blood glucose monitor. The overall tissue concentrations determined by bioluminescence averaged 6.2 ± 0.4 mM, which corresponds well to the tail vein glucose measurements of 6.7 ± 0.4 mM. Since the blood glucose measurements were taken after an intraperitoneal glucose injection, a small change in glucose could have occurred during the 5–10 min between the last blood glucose measurement and tissue harvest.
It should be noted that the complex geometry of the sensor tip and glucose oxidase layer lead to the enzyme being exposed only in the cut-out region of the polyurethane coating. All measurements were taken in this exposed region.
The angle of cut during sectioning of the tissue, as is visible in the sensor images, was important to estimate since oblique cuts will falsely increase the apparent distance from the implant surface. While ImageJ does take nonuniformity into account when calculating the radial profile, some artifact may still remain. Second, as depicted in the glucose sensor images, there was some deformation and distortion of the tissue during cryo-sectioning. Deformation of the tissue leads to difficulty in analyzing the glucose profile spatially, because the tissue may shift. Also, air-bubble formation beneath the cover slip was a complicating factor when the tissue and enzyme solution were combined.
The glucose gradient observed around the sensors was unexpected since the cell membrane provides the main barrier to glucose along its path from blood to cytosol, typically leading to a glucose gradient of near zero. Also, glucose is a small molecule that has a relatively high diffusion coefficient in the interstitium. Thus there is usually relative homogeneity of glucose throughout tissues. Although most glucose sensors incorporate a diffusion barrier to reduce the gradient of glucose and oxygen in the tissue, a more complete understanding of efficiency of glucose transport versus its consumption is critical for glucose sensors.
Diffusion of glucose around sensors may be altered by several factors, including capillary density and permeability, cell types and cell density in the vicinity of the sensor, sensor membrane thickness, collagen content and thickness of the collagen capsule, and glucose consumption both of the cells in the vicinity of the sensor and of the sensor itself.11 Many of these factors have been studied to determine their effect on glucose diffusion, and a few simple calculations can quantify the effect of various factors on glucose transport. Because vessels are the source of glucose in tissues, the number and permeability of microvessels plays an important role in establishing the glucose profile. Sharkawy and colleagues12,13 found that the tissue response time was decreased 2–4-fold by a significant increase in microvascular density around implants but that vessel permeability did not greatly affect the glucose profile since permeability is already high through microvessel walls. In addition, the density and organization of collagen could reduce the diffusion of glucose to the sensor. Sharkawy and colleagues14 also studied small molecule transport through the tissue encapsulating implants and found that a significant increase in the amount of collagen in the capsule reduces the diffusion coefficients of low molecular weight analytes by half.
Consumption of glucose by both the tissue and the sensor itself is also important. The sensor consumption can be estimated from the sensor current since one glucose molecule produces two electrons in the glucose oxidase reaction. With a typical sensor current of 15 nA (15 × 10−9 electrons/s), the glucose consumption by the sensor is estimated at 8 × 10⁻¹⁵ mol/s. This calculation assumes 100% efficiency of the electrochemical conversion of peroxide, which is highly reactive, and therefore the actual consumption by the sensor is likely much higher. The consumption of glucose by cells, either attached ASCs or surrounding immune cells, depends on a number of variables, including cell type, cell activation, and the availability of oxygen. Anaerobic metabolism uses 18 times the glucose per adenosine triphosphate generated compared to aerobic metabolism. Many groups have studied monocytes, neutrophils, macrophages, and fibroblasts under different conditions and found the consumption of glucose per cell to range from 2–10 × 10−17 mol/s.15–18 Assuming the cell density around glucose sensors at one week is similar to that around polyurethane implants, the cell density within 100 μm of the implant can be assumed to be approximately 900 cells/mm2 at one week versus 600 cells/mm2 in normal subcutaneous tissue.5 Based on this cell density and assuming a 5 mM glucose concentration in the tissue and a cellular consumption of 10 × 10−17 mol/s, activated and well-oxygenated cells would consume all glucose within the tissue (100 μm diameter ring around the implant) in approximately 30 min if glucose was not replenished. Additionally, if the tissue was hypoxic, the cells would consume the glucose in slightly under 2 min. Finally, the consumption of glucose by ASCs attached to polystyrene and polyurethane has been measured as approximately 1 mM/day.7 Because the cell density was known, the consumption of glucose per cell was calculated to be 1 × 10⁻¹⁷ mol/s. Assuming 1000 cells were attached to the sensor tip, 1 × 10⁻¹⁴ mol/s of glucose is consumed by these cells. Without glucose replacement, the cells would consume 5 mM glucose in the surrounding tissue in approximately 10 min. Therefore, while collagen content can be important to the diffusion of glucose through the tissue, microvessel density and consumption of glucose are the major determinants of the glucose profile around implanted materials.
Conclusions
The ASC attachment to polyurethane and to glucose sensors did not alter the glucose profiles in the surrounding tissue. Since these cells are highly metabolically active (similar to activated macrophages), it was important to demonstrate that they would not interfere with the glucose profile around the sensors. The lowest glucose readings were at the sensor edge, which is a local sink for glucose. Although most glucose sensors incorporate a diffusion barrier to reduce the formation of a gradient of glucose and oxygen in the tissue, it is not well-known whether glucose, which diffuses relatively well through the interstitium, could establish a gradient around implanted sensors. This study demonstrates that a gradient does exist adjacent to chronically implanted glucose sensors in rats.
Abbreviation
- ASC
adipose-derived stromal cell
- DMEM
Dulbecco's modified Eagle's media
- FBS
fetal bovine serum
- MEM
minimum essential medium
- NADPH
reduced nicotinamide adenine dinucleotide phosphate
- OCT
optimal cutting temperature
- PBS
poly(butylene succinate)
References
- 1.Mueller-Klieser W, Walenta S. Geographical mapping of metabolites in biological tissue with quantitative bioluminescence and single-photon imaging. Histochem J. 1993;25(6):407–420. doi: 10.1007/BF00157805. [DOI] [PubMed] [Google Scholar]
- 2.Schroeder T, Yuan H, Viglianti BL, Peltz C, Asopa S, Vujaskovic Z, Dewhirst MW. Spatial heterogeneity and oxygen dependence of glucose consumption in R3230Ac and fibrosarcomas of the Fischer 344 rat. Cancer Res. 2005;65(12):5163–5171. doi: 10.1158/0008-5472.CAN-04-3900. [DOI] [PubMed] [Google Scholar]
- 3.Williams SK, Berman SS, Kleinert LB. Differential healing and neovascularization of ePTFE implants in subcutaneous versus adipose tissue. J Biomed Mater Res. 1997;35(4):473–481. doi: 10.1002/(sici)1097-4636(19970615)35:4<473::aid-jbm7>3.0.co;2-e. [DOI] [PubMed] [Google Scholar]
- 4.Wisniewski N, Rajamand N, Adamsson U, Lins PE, Reichert WM, Klitzman B, Ungerstedt U. Analyte flux through chronically implanted subcutaneous polyamide membranes differs in humans and rats. Am J Physiol Endocrinol Metab. 2002;282(6):E1316–E1323. doi: 10.1152/ajpendo.00259.2001. [DOI] [PubMed] [Google Scholar]
- 5.Prichard HL, Reichert W, Klitzman B. IFATS collection: adipose-derived stromal cells improve the foreign body response. Stem Cells. 2008;26(10):2691–2695. doi: 10.1634/stemcells.2008-0140. [DOI] [PMC free article] [PubMed] [Google Scholar]
- 6.Pickup JC, Hussain F, Evans ND, Sachedina N. In vivo glucose monitoring: the clinical reality and the promise. Biosens Bioelectron. 2005;20(10):1897–1902. doi: 10.1016/j.bios.2004.08.016. [DOI] [PubMed] [Google Scholar]
- 7.Prichard HL, Reichert WM, Klitzman B. Adult adipose-derived stem cell attachment to biomaterials. Biomaterials. 2007;28(6):936–946. doi: 10.1016/j.biomaterials.2006.09.012. [DOI] [PMC free article] [PubMed] [Google Scholar]
- 8.Zuk PA, Zhu M, Mizuno H, Huang J, Futrell JW, Katz AJ, Benhaim P, Lorenz HP, Hedrick MH. Multilineage cells from human adipose tissue: implications for cell-based therapies. Tissue Eng. 2001;7(2):211–228. doi: 10.1089/107632701300062859. [DOI] [PubMed] [Google Scholar]
- 9.Lee JA, Parrett BM, Conejero JA, Laser J, Chen J, Kogon AJ, Nanda D, Grant RT, Breitbart AS. Biological alchemy: engineering bone and fat from fat-derived stem cells. Ann Plast Surg. 2003;50(6):610–617. doi: 10.1097/01.SAP.0000069069.23266.35. [DOI] [PubMed] [Google Scholar]
- 10.Walenta S, Schroeder T, Mueller-Klieser W. Metabolic mapping with bioluminescence: basic and clinical relevance. Biomol Eng. 2002;18(6):249–262. doi: 10.1016/s1389-0344(01)00107-1. [DOI] [PubMed] [Google Scholar]
- 11.Kvist PH, Iburg T, Bielecki M, Gerstenberg M, Buch-Rasmussen T, Hasselager E, Jensen HE. Biocompatibility of electrochemical glucose sensors implanted in the subcutis of pigs. Diabetes Technol Ther. 2006;8(4):463–475. doi: 10.1089/dia.2006.8.463. [DOI] [PubMed] [Google Scholar]
- 12.Sharkawy AA, Klitzman B, Truskey GA, Reichert WM. Engineering the tissue which encapsulates subcutaneous implants. III. Effective tissue response times. J Biomed Mater Res. 1998;40(4):598–605. doi: 10.1002/(sici)1097-4636(19980615)40:4<598::aid-jbm11>3.0.co;2-c. [DOI] [PubMed] [Google Scholar]
- 13.Sharkawy AA, Klitzman B, Truskey GA, Reichert WM. Engineering the tissue which encapsulates subcutaneous implants. II. Plasma-tissue exchange properties. J Biomed Mater Res. 1998;40(4):586–597. doi: 10.1002/(sici)1097-4636(19980615)40:4<586::aid-jbm10>3.0.co;2-e. [DOI] [PubMed] [Google Scholar]
- 14.Sharkawy AA, Klitzman B, Truskey GA, Reichert WM. Engineering the tissue which encapsulates subcutaneous implants. I. Diffusion properties. J Biomed Mater Res. 1997;37(3):401–412. doi: 10.1002/(sici)1097-4636(19971205)37:3<401::aid-jbm11>3.0.co;2-e. [DOI] [PubMed] [Google Scholar]
- 15.Garcia C, de Oliveira MC, Verlengia R, Curi R, Pithon-Curi TC. Effect of dexamethasone on neutrophil metabolism. Cell Biochem Funct. 2003;21(2):105–111. doi: 10.1002/cbf.1002. [DOI] [PubMed] [Google Scholar]
- 16.Fujita Y, Homma KJ, Natori S. Activation of murine macrophage-like cells by granulocytin. Biochem Biophys Res Commun. 2000;275(3):850–853. doi: 10.1006/bbrc.2000.3381. [DOI] [PubMed] [Google Scholar]
- 17.Magae J, Munemura K, Ichikawa C, Osada K, Hanada T, Tsuji RF, Yamashita M, Hino A, Horiuchi T, Uramoto M. Effects of microbial products on glucose consumption and morphology of macrophages. Biosci Biotechnol Biochem. 1993;57(10):1628–1631. doi: 10.1271/bbb.57.1628. [DOI] [PubMed] [Google Scholar]
- 18.Goldstein S, Ballantyne SR, Robson AL, Moerman EJ. Energy-metabolism in cultured human fibroblasts during aging in vitro. J Cell Physiol. 1982;112(3):419–424. doi: 10.1002/jcp.1041120316. [DOI] [PubMed] [Google Scholar]