Abstract
Premature delivery is the leading cause of infant mortality in the United States. Currently, premature delivery cannot be prevented and new treatments are difficult to develop due to the inability to diagnose symptoms prior to uterine contractions. Cervical ripening is a long period that precedes the active phase of uterine contractions and cervical dilation. The changes in the microstructure of the cervix during cervical ripening suggest that the ultrasonic attenuation should decrease. The objective of this study is to use the reference phantom algorithm to estimate the ultrasonic attenuation in the cervix of pregnant human patients. Prior to applying the algorithm to in vivo human data, two homogeneous phantoms with known attenuation coefficients were used to validate the algorithm and to find the length and the width of the region of interest (ROI) that achieves the smallest error in the attenuation coefficient estimates. In the phantom data, we found that the errors in the attenuation coefficients estimates are less than 12% for ROIs that contain 40 wavelengths or more axially and 30 echo lines or more laterally. The reference phantom algorithm was then used to obtain attenuation maps of the echoes from two human pregnant cervices at different gestational ages. It was observed that the mean of the attenuation coefficient estimates in the cervix of the patient at a more advanced gestational age is smaller than the mean of the attenuation coefficient estimates in the cervix of the patient at an earlier gestational age which suggests that ultrasonic attenuation decreases with increasing gestational age. We also observed a large variance between the attenuation coefficient estimates in the different regions of the cervix due to the natural variation in tissue microstructures across the cervix. The preliminary results indicate that the algorithm could potentially provide an important diagnostic tool for diagnosing the risk of premature delivery.
I. INTRODUCTION
Premature delivery is the leading cause of infant mortality in the United States and it is estimated that neonatal care costs 10 billion dollars annually [1]. Therefore there is an urgent need for the development of noninvasive diagnostic tools to predict premature delivery. Prior to uterine contractions, the cervix undergoes a long period of phasic changes in the microstructure and composition [2]. During this period often referred to as cervical ripening, the concentration of collagen decreases as more space is created between the fibrils. Water and other enzymes occupy this space and act to loosen collagen fibrils and soften elastin in preparation for delivery [3]. If preterm cervical ripening is accurately diagnosed, new drugs could potentially be developed to delay cervical ripening and prevent early delivery.
Historically, ultrasound has been used as an imaging modality that relies on the reflection of acoustic waves from tissue microstructures creating speckle patterns of various intensities in the B-mode images. The images formed provide sufficient information for qualitatively visualizing the anatomy of soft tissue structures. However, investigators have shown that statistical analysis of the backscattered power spectrum can provide quantitative, system independent estimates of tissue properties such as attenuation and the size/composition of the tissue microstructures [4–9]. Due to the increased water content of the cervix during ripening, it is hypothesized that ultrasonic attenuation will decrease with increasing gestational ages. A preliminary in vivo study on rats showed that the ultrasonic attenuation coefficients are less in the cervices of pregnant rats than those of non pregnant ones [10]. However, the variances of the attenuation estimates of the rats that were at the same gestation age were as high as 0.7 dB/cm-MHz which are too large to deduce a trend in the attenuation slope with increasing gestational ages.
Since the attenuation increases with frequency, the high frequency components are more attenuated than the low frequency components when an ultrasonic pulse passes through tissue. This dispersion in attenuation results in a spectral distortion of the pulse. Specifically the power spectrum of the pulse experiences a downshift in its center frequency, which is related to attenuation [11]. The frequency downshift is usually determined in the frequency domain by measuring the difference in the center frequencies of the received and incident power spectra [11–13]. An alternate method is to determine the frequency downshift in the time domain by measuring the density of zero crossings of the rf signal [14]. Other techniques for determining the frequency downshift of backscattered signals are based on parametric spectral analysis and more precisely the autoregressive (AR) spectral analysis. This analysis consists in modeling the backscattered signal as the output of a linear filter driven by White Gaussian noise and computes AR parameters. These parameters can be used to estimate the power spectrum of a gated window of the backscattered signal and hence determine the frequency downshift [13, 15]. Tu et al proposed a method called video signal analysis (VSA) for measuring the attenuation coefficient of a sample based on a reference phantom. This method compares the intensity of the sample B-mode image to the intensity of the reference B-mode image at different depths. However, this method assumes that the ultrasound waves are planar and that the attenuation depends linearly on frequency [16].
In this paper, we use the reference phantom algorithm to estimate attenuation of a region of interest (ROI) in tissue based on a reference phantom [17]. This algorithm accounts for the effects of the spectrum of the transmit pulse, diffraction, scattering, and attenuation of intervening tissues. The algorithm assumes the ROI is statistically homogeneous. The precision of the algorithm is validated by an experiment performed on two phantoms with known attenuation coefficients. The two phantoms are scanned multiple times and several sets of RF waveforms corresponding to B-mode images are obtained. One set of waveforms is chosen as a reference image, and the algorithm is used to estimate the attenuation coefficient in the rest of the scans based on the reference set. In order to minimize the error in attenuation estimates, parameters such as ROI length, window size and number of echoes per ROI are optimized. The optimized algorithm is then used to estimate attenuation in images obtained from the cervixes of pregnant women at different gestation ages.
II. SUMMARY OF REFERENCE PHANTOM ALOGIRTHM
In order to estimate attenuation in a ROI of a sample, the same transducer and power settings are used to obtain backscattered signals from the sample, and from a phantom with known frequency dependent attenuation. Each RF echo line of the ROI is portioned into several overlapping time gated windows. The Fourier Transform is applied to every window, and the power spectra of the windows corresponding to the same depth from each RF echo line in the ROI are averaged. The same procedure is performed on the region of the reference phantom that corresponds to the ROI of the sample. In standard pulse echo imaging, the measured power spectrum of a windowed region in a statistically homogeneous tissue is the Fourier Transform of the time gated signal [11] and can be written as:
| (1) |
This equation assumes that the windows used to gate the echoes are small compared to the depth of focus for the transducer so that the variations of the field within each gated region could be ignored [18]. A(f) is the Power spectrum of the transmitted pulse. D(x, y, z) is a diffraction term that results from focusing. Fs(f) is a frequency dependent term that results from the scattering properties of the ROI. H(f) is the transfer function of the ultrasound source. αs is the slope of the attenuation coefficient in the ROI with frequency dependence ns, and d0 is the distance from the center of the transducer to the center of the first time gated region of the ROI. d is the distance to the center of a particular time-gated region within the ROI. Recall that changes in the power spectrum with depth (i.e., different time-gated regions) within the ROI have been traditionally used to determine the attenuation slope of a particular ROI [11, 19, 20]. Lastly, Fatt is the total frequency-dependent attenuation along the path and can be written as:
| (2) |
where di is the distance from the center of the transducer to the start of the ith intervening tissue and (α1, α2,…, αN) are the attenuation coefficients of the intervening tissues each having a frequency dependence of ni. Similarly, the power spectrum of the backscattered signal from the reference phantom is:
| (3) |
where, αr is the slope of the attenuation coefficient of the phantom which has a frequency dependence of nr and Fr(f) is a term that results from ultrasound scattering in the phantom.
Dividing the power spectra of the sample by those of the reference phantom yields:
| (4) |
Computing the natural logarithm of the above equation gives:
| (5) |
If we then take the derivative with respect to d, we have:
| (6) |
Since the slope of the attenuation coefficients αr and its frequency dependence nr are known, the slope of the attenuation coefficient αs and its frequency dependence ns in the sample can be estimated by using a nonlinear least squares optimization routine such as the Levenberg-Marquardt routine [21].
In this paper, we assume that the powers of frequency dependence nr and ns are equal to 1 in order to initially verify our algorithm. This is a reasonable initial simplification since the frequency dependence of attenuation for most tissue has a linear dependence on frequency at least over the bandwidth of most sources [22]. This approximation is also reasonable in our initial studies because the tissue mimicking phantoms used have a linear frequency dependent attenuation. Under this approximation, equation (6) becomes:
| (7) |
where
| (8) |
For every frequency component, this derivative can be estimated by the slope of the line that fits the data as illustrated in Figure 1. The solid line of Figure 1 is a plot of the logarithm of the power spectra ratio S with respect to depth for a single frequency (4.74 MHz) for one of the sample data sets. The deviation of the spectrum S from a straight line is due to stochastic nature of the backscattered signals. The dashed line represents a line that fits the data points of S with least mean square error. The slope of this line can be used to estimate the derivative of S and hence compute Δα for a single frequency component according to equation (7). An estimate of the attenuation coefficient in the ROI of the sample is obtained by finding and adding the attenuation coefficient of the reference phantom (i.e. ).
Fig. 1.
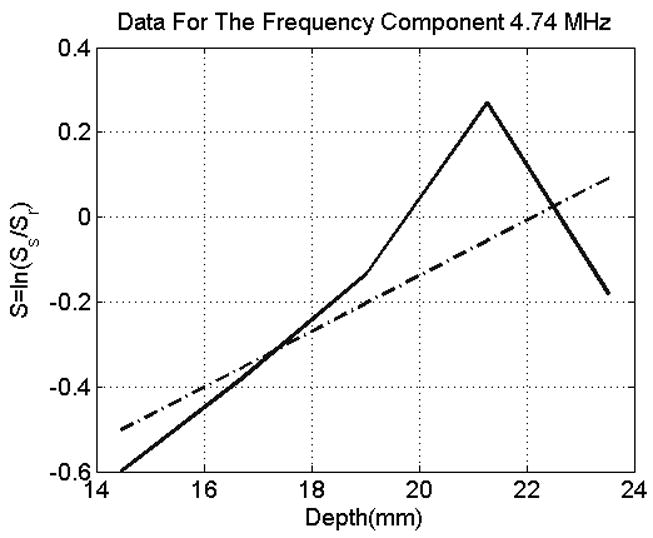
The Logarithm of the ratio of power spectra with respect to depth for a single frequency component. The solid line is a plot of the logarithm of the power spectra ratio S with respect to depth for a single frequency (4.74 MHz) for one of the sample data sets (Window Size =10λ). The dashed line represents a line that fits the data points of S with least mean square error.
III. ANALYSIS OF MEASURMENT DATA
Prior to applying the reference phantom algorithm to in vivo data, it was validated by using two homogeneous tissue mimicking phantoms with attenuation coefficients 0.64 dB/cm-MHz (phantom 1) and 0.5 dB/cm-MHz (phantom 2) respectively. Both phantoms have a sound propagation speed of 1540 m/s which is similar to the propagation speed in soft tissue. The scattering targets in the phantoms are glass beads with a number density of 5 mm−3. The mean scatterer diameters in phantom 1 and in phantom 2 are 45 μm and 75 μm, respectively. Both phantoms were custom fabricated at the University of Wisconsin Madison by Ernest L. Madsen. Using a 6.8 MHZ trans-vaginal array transducer (E9-4, z.one Ultrasound System, ZONARE Medical Systems, Inc., Mountain View, CA) and the same power settings, the two phantoms are exposed to ultrasound and 5 RF data sets corresponding to 5 different B-mode images are obtained for each phantom. One of the data sets from phantom 1 is chosen as the reference and the reference phantom algorithm is utilized to estimate the attenuation coefficients in the remaining 9 data sets.
In order to obtain the least error in attenuation coefficient estimates (ACEs), parameters such as the ROI length, the size of the time gated window used to compute the Fourier Transform at each depth within the ROI, and the number of echoes per ROI must be optimized. In order to do this, we first took ROIs that consisted of 50 echo lines and varied the size of the time gated window, within each ROI, from 5λ to 25λ with increments of 1λ. The length of the ROI was also varied from 10λ to 75λ by varying the number of time gated windows per ROI. We chose 50% overlapping between the time gated windows. For every combination of window size and ROI length, one ROI was selected from each B-mode image so that the center of the ROI corresponds to the center of the B-mode. The selected ROIs correspond to the same depth. The reference phantom algorithm was then used to estimate the attenuation coefficient in the selected ROI of each data set. Subsequently, the error in the attenuation coefficient estimate of each ROI was calculated according to equation.
| (9) |
In this equation, αtrue is the true attenuation coefficient of the sample and αest is the estimated attenuation coefficient of the ROI. Lastly, for every combination of window size and ROI length, the mean and standard deviation of the errors in ACEs of the nine ROIs were calculated.
Figure 2 shows graphs of the mean and Standard Deviation (STD) of the errors in the ACEs versus ROI size, for all window sizes. It is apparent from Figure 2 that for a specific ROI size, the magnitudes of the mean and STD of the errors in the ACEs exhibit little variation with respect to window size (i.e., different symbols). It is also observed that the mean and STD of the errors in the ACEs decrease with increasing ROI size. For ROI sizes that are greater than 30 to 40λ, there is little or no decrease in the mean and STD of the errors in the ACEs.
Fig. 2.
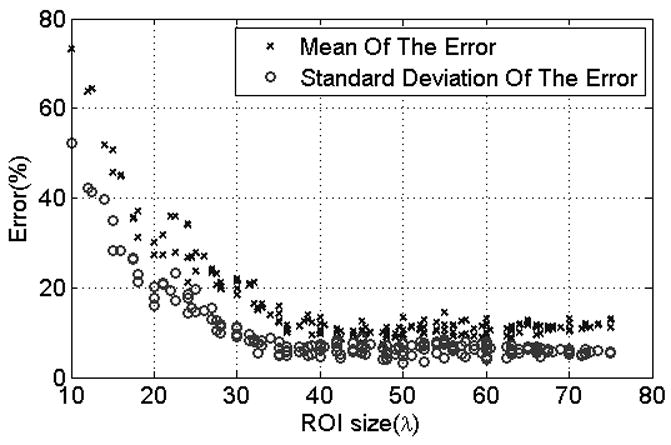
Scatter plot of the mean and standard deviation of the error in the attenuation coefficient estiamtes versus ROI size. Each symbol represents a different window length used to gate the time domain waveforms prior to taking the Fourier Transform within each ROI.
In order to explore the dependence on ROI length and window size in greater detail, we generated surface plots of the mean and STD of the errors in the ACEs with respect to ROI length and window size. The two plots are shown in Figures 3 and 4 respectively. Visually assessing the two plots, it is observed that for ROI lengths less than 35 to 40λ, the mean and STD of the errors in the ACEs decrease sharply with increasing ROI length; however, they stay nearly constant with respect to ROI length for ROI lengths greater than 35 to 40λ. For a specific ROI length, the mean and STD of the errors in the ACEs are nearly constant with respect to window size for window sizes greater than 5λ. The mean and STD of the errors in the ACEs are less than 15% and 10% respectively for ROI lengths greater than 35λ and for all window sizes. Based on these observations, we concluded that the precision of the attenuation estimates are independent of window size for window sizes greater than 5λ. We also concluded that ROI lengths greater than 35λ are optimal for attenuation estimation. In the rest of the analysis, we used ROI lengths of 40λ and window sizes of 10λ.
Fig. 3.
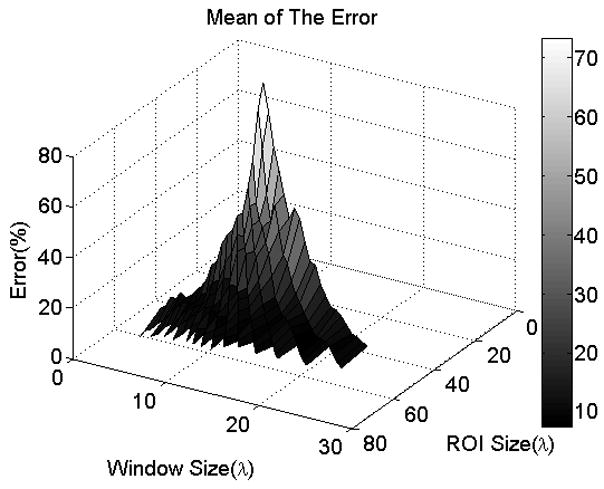
Surface plot of the mean of the error in the ACEs versus window size and ROI length
Fig. 4.
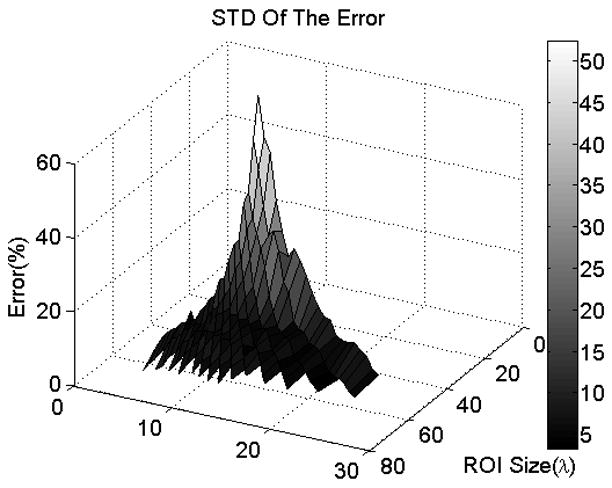
Surface plot of the STD of the error in the ACEs versus window size and ROI length
After determining the optimal ROI length, we determined the optimal number of echoes per ROI. For this analysis, we fixed the window size to 10λ and the ROI length to 40λ and varied the number of echoes per ROI from 3 to 140. For every choice of number of echoes per ROI, one ROI was selected from each B-mode image so that the center of the ROI corresponds to the center of the B-mode. The attenuation coefficient was estimated in the selected ROI of each data set, and the error in the estimate was calculated according to equation(9). For every choice of number of echoes per ROI, the mean and standard deviation of the errors in the ACEs of the nine ROIs were then calculated.
Figure 5 shows plots of the mean and STD of the errors in the ACEs with respect to the number of echoes per ROI. It is apparent that both the mean and STD of the errors in the ACEs decrease with increasing number of echoes per ROI. However, there is no decrease in the mean and STD of the errors in the ACEs for ROIs that contain more than 30 echo lines. It is also observed that ROIs that contain 30 echo lines or more guarantee that the mean and STD of the errors in the ACEs are less than 12% and 8% respectively. Based on these observations, we concluded that ROIs that contain 30 echo lines or more are optimal of attenuation estimation.
Fig. 5.
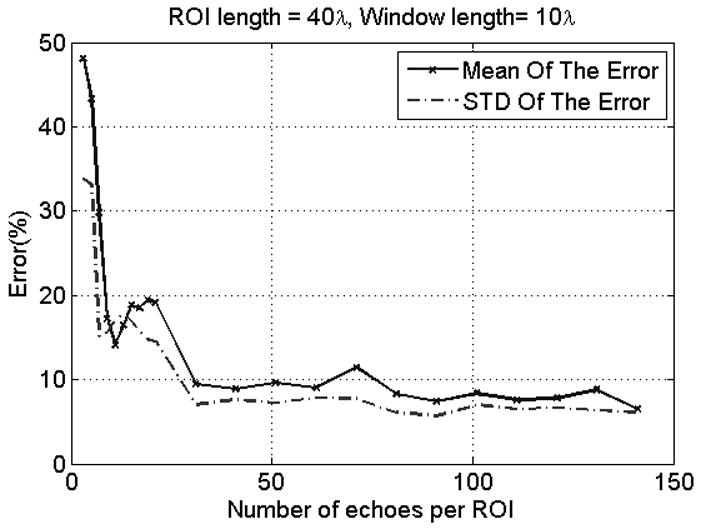
Plot of the mean and STD of the errors in the ACEs with respect to the number of echoes per ROI
Using an ROI length of 40λ, a window size of 10λ and 30 echo lines per ROI, the reference phantom algorithm was applied to RF data corresponding to one B-mode image of the black phantom (0.64dB/cm-MHz) in order to estimate attenuation is several regions of the B-mode image. To generate an attenuation map, a color is assigned to each value of attenuation and the regions of the B-mode image are then colored according to their estimated value of attenuation. Figure 6 shows the resulting attenuation map. The mean and standard deviation of the attenuation coefficient estimates of all ROIs in the B-mode image are 0.6437 dB/cm-MHz and 0.131 dB/cm-MHz, respectively (true attenuation coefficient = 0.64 dB/cm-MHz). We observed that the attenuation coefficients in the selected ROIs were estimated with high precision. Furthermore, the variance of the attenuation coefficient estimates across the B-mode image was small. Based on these observations, we concluded that the reference phantom algorithm can be used to estimate the attenuation throughout the entire field of view of a sample.
Fig. 6.
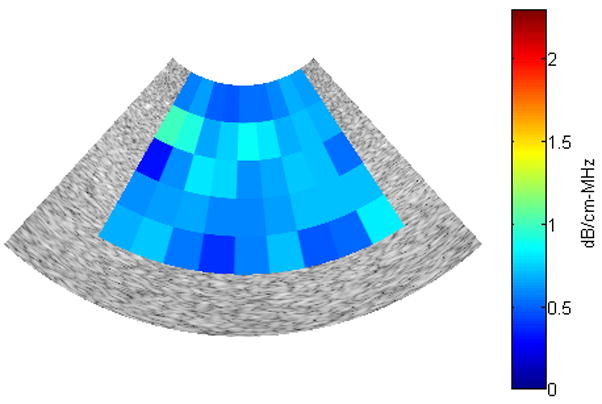
Attenuation map for a B-mode image obtained from the black phantom (0.64dB/cm-MHz)
IV. PRELIMINARY IN VIVO RESULSTS
Using an ROI length of 40λ, a window size of 10λ and 30 echo lines per ROI, the reference phantom algorithm was used to obtain attenuation maps in 2 B-mode images of human cervixes. Figure 7 and 8 show the B-mode image and the attenuation map respectively, for the cervix of a pregnant patient with 38 weeks gestation. Figure 9 and 10 show the B-mode image and the attenuation map respectively, for the cervix of a pregnant patient with 13 weeks gestation. The ACEs of the cervix of the 38 week pregnant patient and the cervix of the 13 week pregnant patient are 0.582±0.61 dB/cm-MHz and 1.14±0.45 dB/cm-MHz, respectively. Based on these two attenuation maps, we observed that the attenuation coefficient at longer gestational ages (near delivery) is smaller than the attenuation coefficient at shorter gestational ages. At this point, we are now ready to implement our algorithm on a larger number of patients in order to assess its ability to predict preterm delivery.
Fig. 7.
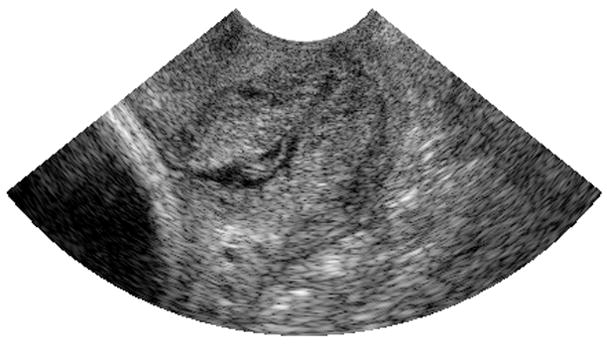
B-mode image obtained from the cervix of a 38 week pregnant patient
Fig. 8.
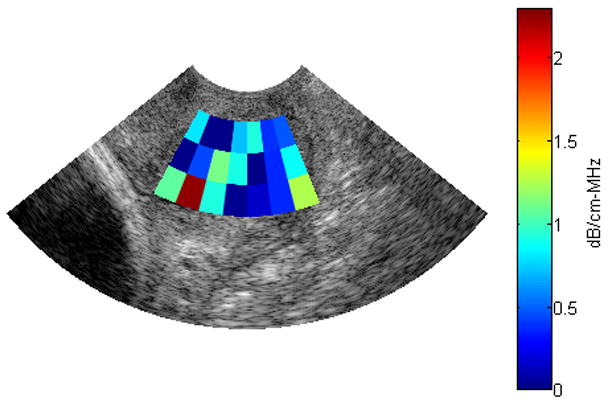
Attenuation map for a B-mode image obtained from the cervix of a 38 week pregnant patient
Fig. 9.
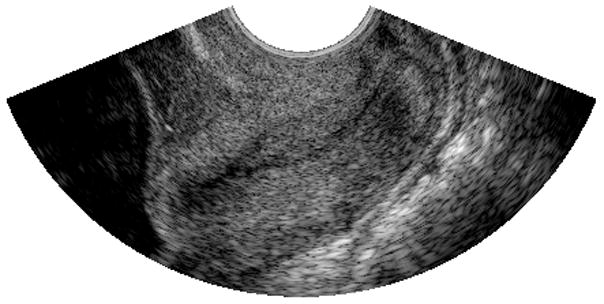
B-mode image obtained from the cervix of a 13 week pregnant patient
Fig. 10.
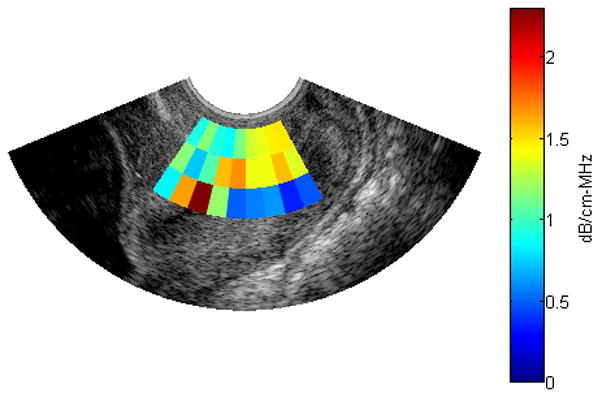
Attenuation map for a B-mode image obtained from the cervix of a 13 week pregnant patient
V. CONCLUSION AND DISCUSSION
In this paper, the reference phantom algorithm was used for determining the attenuation of the cervix during pregnancy. This algorithm has several advantages over existing methods to determine the attenuation within a region of interest (ROI). First, in most algorithms, the attenuation coefficient is assumed to depend linearly on frequency, and the power spectrum of the transmit pulse is approximated by a Gaussian function [11, 16, 23]. As a result, there is an increase in the error of the estimates when the approximations are only marginally satisfied. Second, while some algorithms also use a phantom reference to deal with the effects of diffraction [5, 23], others neglect diffraction entirely [13, 24] or incorporate a correction term into the power spectrum which is difficult to obtain for clinical array sources [18]. The reference phantom algorithm doesn’t assume that the power spectrum is approximated by a Gaussian function while still accounting for the influence of diffraction, scattering, and attenuation in the intervening tissues. In addition, the algorithm could be potentially extended to give the complete frequency dependent attenuation rather than assuming linear dependence on frequency as is currently done for most algorithms. While this possibility needs further exploration in the future, it certainly extends the potential usefulness of our algorithm well beyond our original intent of measuring the attenuation coefficient of the cervix during pregnancy.
The implementation of the reference phantom algorithm to estimate the attenuation within a ROI requires the knowledge of three parameters; the size of the time gated window, the length of the ROI, and the number of echoes in the ROI. In this paper, we found the values of these parameters that give the least error in the attenuation coefficient estimates (ACEs). We performed data analysis on 9 data sets acquired from two phantoms with known attenuation coefficients. It was observed that for a specific ROI size, the mean and STD of the errors in the ACEs stays nearly constant with respect to window size for window sizes greater than 5λ. It was also observed that for ROI lengths less than 35 to 40λ, the mean and STD of the errors in the ACEs decrease sharply with increasing ROI length; however they stay nearly constant for ROIs greater than 35 to 40λ. The decrease in the error with increasing ROI lengths is due to the increase in the number of windows per ROI which in turn results in a better estimate of the slope described in equation(6). Time gated windows that are larger than 5λ capture all spectral content of the backscattered signal, and that explains why the mean and STD of the errors in the ACEs didn’t change with respect to window size. Based on these observations, we concluded that ROI lengths greater than 35λ and window sizes greater than 5λ are optimal for attenuation estimation.
We then set the window size to 10λ and the ROI length to 40λ and examined how the number of echoes per ROI affect the mean and STD of the errors in the ACEs. We observed that the mean and STD of the errors in the ACEs decrease with increasing number of echoes per ROI up to approximately 30 echoes per ROI where they stay nearly constant. This was expected, because increasing the number of echoes provides better averaging of the noisy power spectra that result from the random nature of the inhomogeneities. The mean and STD of the errors in the ACEs are less than 12% and 8% respectively when the number of echoes is greater than 30. Based on these observations, we concluded that 30 echoes per ROI are optimal for attenuation estimation.
After finding the optimal parameters for the reference phantom algorithm, we obtained attenuation maps of the echoes from two human pregnant cervices at different gestational ages. We observed that the mean of the attenuation coefficient estimates in the cervix of the patient at a more advanced gestational age is smaller than the mean of the attenuation coefficient estimates in the cervix of the patient at an earlier gestational age. This suggests that ultrasonic attenuation decreases with increasing gestational age. We also observed a large variance between the attenuation coefficient estimates in the different regions of the cervix. This is most likely due the natural variation in tissue micro-structures across the cervix. For example, the endocervical canal is lined with cervical mucus which has a water content of more than 99%. These results imply that the reference phantom algorithm could potentially provide an important diagnostic tool for diagnosing the risk of premature delivery
Footnotes
Publisher's Disclaimer: This is a PDF file of an unedited manuscript that has been accepted for publication. As a service to our customers we are providing this early version of the manuscript. The manuscript will undergo copyediting, typesetting, and review of the resulting proof before it is published in its final citable form. Please note that during the production process errors may be discovered which could affect the content, and all legal disclaimers that apply to the journal pertain.
References
- 1.Callaghan WM, et al. The Contribution of Preterm Birth to Infant Mortality Rates in the United States. Pediatrics. 2006;118(4):1566–1573. doi: 10.1542/peds.2006-0860. [DOI] [PubMed] [Google Scholar]
- 2.Leppert PC. Anatomy and physiology of cervical ripening. Clin Obstet Gynecol. 1995;38(2):267–279. doi: 10.1097/00003081-199506000-00009. [DOI] [PubMed] [Google Scholar]
- 3.Leppert PC, et al. Further evidence of a decorin-collagen interaction in the disruption of cervical collagen fibers during rat gestation. American Journal of Obstetrics and Gynecology. 2000;182(4):805–812. doi: 10.1016/s0002-9378(00)70329-2. [DOI] [PubMed] [Google Scholar]
- 4.Bigelow TA, O’Brien WD., Jr Scatterer size estimation in pulse-echo ultrasound using focused sources: Calibration measurements and phantom experiments. The Journal of the Acoustical Society of America. 2004;116(1):594–602. doi: 10.1121/1.1757453. [DOI] [PubMed] [Google Scholar]
- 5.Gerig A, Zagzebski J, Varghese T. Statistics of ultrasonic scatterer size estimation with a reference phantom. The Journal of the Acoustical Society of America. 2003;113(6):3430–3437. doi: 10.1121/1.1568945. [DOI] [PubMed] [Google Scholar]
- 6.Insana MF, et al. Describing small-scale structure in random media using pulse-echo ultrasound. The Journal of the Acoustical Society of America. 1990;87(1):179–192. doi: 10.1121/1.399283. [DOI] [PMC free article] [PubMed] [Google Scholar]
- 7.Morse PM, Ingard KU. Theoretical Acoustics. Vol. 927. Princeton University Press; 1986. pp. 400–462. Ch 8. [Google Scholar]
- 8.Oelze ML, Zachary JF, William J, O’Brien D. Characterization of tissue microstructure using ultrasonic backscatter: Theory and technique for optimization using a Gaussian form factor. The Journal of the Acoustical Society of America. 2002;112(3):1202–1211. doi: 10.1121/1.1501278. [DOI] [PubMed] [Google Scholar]
- 9.Shung KK, Thieme GA. Ultrasonic Scattering in Biological Tissues. 1. Vol. 512. CRC; 1993. pp. 291–312. Ch 9. [Google Scholar]
- 10.Bigelow TA, et al. In vivo ultrasonic attenuation slope estimates for detecting cervical ripening in rats: Preliminary results. The Journal of the Acoustical Society of America. 2008;123(3):1794–1800. doi: 10.1121/1.2832317. [DOI] [PMC free article] [PubMed] [Google Scholar]
- 11.Wear KA. A Gaussian framework for modeling effects of frequency-dependent attenuation, frequency-dependent scattering, and gating. Ultrasonics, Ferroelectrics and Frequency Control, IEEE Transactions on. 2002;49(11):1572–1582. doi: 10.1109/tuffc.2002.1049739. [DOI] [PubMed] [Google Scholar]
- 12.Bigelow TA, Oelze ML, William J, O’Brien D. Estimation of total attenuation and scatterer size from backscattered ultrasound waveforms. The Journal of the Acoustical Society of America. 2005;117(3):1431–1439. doi: 10.1121/1.1858192. [DOI] [PubMed] [Google Scholar]
- 13.Girault JM, et al. Time-varying autoregressive spectral estimation for ultrasound attenuation in tissue characterization. Ultrasonics, Ferroelectrics and Frequency Control, IEEE Transactions on. 1998;45(3):650–659. doi: 10.1109/58.677609. [DOI] [PubMed] [Google Scholar]
- 14.Flax SW, et al. Spectral Characterization and Attenuation Measurements in Ultrasound. Ultrason Imaging. 1983;5(2):95–116. doi: 10.1177/016173468300500201. [DOI] [PubMed] [Google Scholar]
- 15.Baldeweck T, et al. Application of autoregressive spectral analysis for ultrasound attenuation: interest in highly attenuating medium. Ultrasonics Symposium, 1993. Proceedings., IEEE. 1993;2(1):1181–1186. [Google Scholar]
- 16.Tu H, Zagzebski J, Chen Q. Attenuation estimations using envelope echo data: Analysis and simulations. Ultrasound in Medicine & Biology. 2006;32(3):377–386. doi: 10.1016/j.ultrasmedbio.2005.12.001. [DOI] [PubMed] [Google Scholar]
- 17.Yao LX, Zagzebski JA, Madsen EL. Backscatter coefficient measurements using a reference phantom to extract depth-dependent instrumentation factors. Ultrasonic Imaging. 1990;12(1):58–70. doi: 10.1177/016173469001200105. [DOI] [PubMed] [Google Scholar]
- 18.Bigelow TA, O’Brien WD., Jr Impact of local attenuation approximations when estimating correlation length from backscattered ultrasound echoes. The Journal of the Acoustical Society of America. 2006;120(1):546–553. doi: 10.1121/1.2208456. [DOI] [PubMed] [Google Scholar]
- 19.Baldeweck T, et al. Attenuation estimation in highly attenuating media using high frequencies: a comparison study between different mean frequency estimators. Ultrasonics Symposium, 1994. Proceedings. 1990;3(1):1783–1786. [Google Scholar]
- 20.Bigelow TA. Ultrasound attenuation estimation using backscattered echoes from multiple sources. The Journal of the Acoustical Society of America. 2008;124(2):1367–1373. doi: 10.1121/1.2949519. [DOI] [PMC free article] [PubMed] [Google Scholar]
- 21.Heath MT. Scientific Computing. 2. Ch 6. The McGraw-Hill Companies; 2002. pp. 287–288. [Google Scholar]
- 22.Jongen HAH, et al. A general model for the absorption of ultrasound by biological tissues and experimental verification. The Journal of the Acoustical Society of America. 1986;79(2):535–540. doi: 10.1121/1.393541. [DOI] [PubMed] [Google Scholar]
- 23.Hyungsuk K, Varghese T. Attenuation estimation using spectral cross-correlation. Ultrasonics, Ferroelectrics and Frequency Control, IEEE Transactions on. 2007;54(3):510–519. doi: 10.1109/tuffc.2007.274. [DOI] [PubMed] [Google Scholar]
- 24.St John EB, et al. Cost of neonatal care according to gestational age at birth and survival status. American Journal of Obstetrics and Gynecology. 2000;182(1):170–175. doi: 10.1016/s0002-9378(00)70509-6. [DOI] [PubMed] [Google Scholar]


