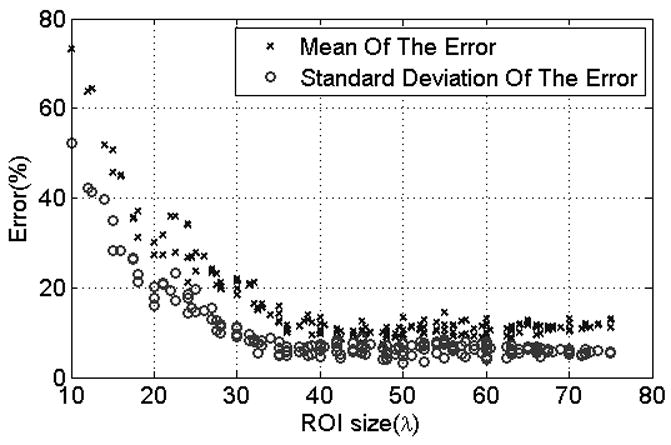
Fig. 2.

Scatter plot of the mean and standard deviation of the error in the attenuation coefficient estiamtes versus ROI size. Each symbol represents a different window length used to gate the time domain waveforms prior to taking the Fourier Transform within each ROI.
