Abstract
We introduce atomic hydrogen trapped in an octaisobutylsilsesquioxane nanocage (H@iBuT8) as a new molecular high-precision magnetic field standard for high-field EPR spectroscopy of organic radicals and other systems with signals around g = 2. Its solid-state EPR spectrum consists of two narrow lines separated by about 51 mT and centered at g ≈ 2. The isotropic g factor is 2.00294(3) and essentially temperature independent. The isotopic 1H hyperfine coupling constant is 1416.8(2) MHz below 70 K and decreases slightly with increasing temperature to 1413.7(1) MHz at room temperature. The spectrum of the standard does not overlap with those of most organic radicals, and it can be easily prepared and is stable at room temperature.
Keywords: High-field EPR, field standard, g standard, atomic hydrogen
Introduction
Many paramagnetic systems feature relatively narrow spectra centered around g = 2. Among these, organic radicals form a major subgroup. They are pervasive in biological systems, fulfilling crucial roles in electron transfer and in enzymatic redox reactions. Such radicals can occur on substrates, cofactors (flavins, quinones), and amino acids (tyrosine, tryptophan, cysteine, glycine).
The g tensors of these organic radicals can be resolved and determined with high-field EPR, acquired at frequencies at and above about 95 GHz. High-resolution high-field EPR spectra of organic radicals were reported up to 670 GHz and 24 T [1–3].
The g-tensor components are sensitive to structural details such as the microenvironment, protonation state, electron spin density distribution and total charge of the radical [4–8]. In combination with quantum chemical modeling based on density functional theory, they are an important structural diagnostic tool that can reveal these details [9–11].
To this end, precise g values are needed, ideally with a relative uncertainty of 10−5 or less. Such levels can only be obtained if both the magnetic field and the microwave frequency of the EPR experiment are precisely known. Whereas the frequency can be routinely measured to a relative precision of 10−9, the relative uncertainty associated with the magnetic field is much larger, sometimes up to 10−2. This has two reasons: First, due to hysteresis effects, the magnetic field at the sample resulting from a given current input into the coils of a resistive or superconducting magnet depends on the prior history of the magnetic field sweep. As the magnetic field is varied during an EPR experiment, this can vary substantially from sweep to sweep. Second, the spatial inhomogeneity of high-field magnets may cause a non-negligible offset between the fields at the sample position and the point where the field is measured. Field measurement can be done to high precision with NMR-based teslameters such as described in [12] or developed commercially. However, the use of these teslameters in high-field EPR still remains limited.
Ideally, the magnetic field is measured at the same point in time and space as the sample of interest. To this end, one can add a well-characterized paramagnetic compound as a field standard to the sample container. Its spectrum should have a few sharp lines that preferably do not overlap with the spectrum of interest. Its magnetic parameters should be accurately known for all temperatures of interest. Also, it should be an easily available, inert and stable compound. A variety of paramagnetic field standards are currently being employed for high-field EPR, satisfying some of these criteria. The most common are LiF:Li [13],with one very narrow metallic resonance line with g = 2.002293(2) at room temperature, and MgO:Mn2+ [14], with six hyperfine lines with g = 2.00101(5) and A = –243.9(1) MHz. Other standards occasionally used include Si:P (featuring one line with g = 1.998 at high P donor concentrations, and two lines separated by 4.4 mT at low donor concentration) [15–17], CaO:Mn2+, 2,2-diphenyl-1-picrylhydrazyl (DPPH) [18–20], potassium nitrosodisulfonate (Frémy’s salt) [21; 22], aromatic hydrocarbon radicals such as the perylene radical cation[23], and K3CrO8 [24]. Mn2+ in MgO and CaO as well as DPPH suffer from poor sample-to-sample and lab-to-lab reproducibility [19]. Standards with a single line (LiF:Li and Si:P) cannot be used directly to calibrate the magnetic field axis over a field range. Frémy’s salt and perylene radical cations are only used in solution, so they are limited to room-temperature measurements. The spectra of most field standards overlap with the g ≈ 2 signals of interest. In addition, for all of these standards, the temperature dependence of the magnetic parameters has not been characterized.
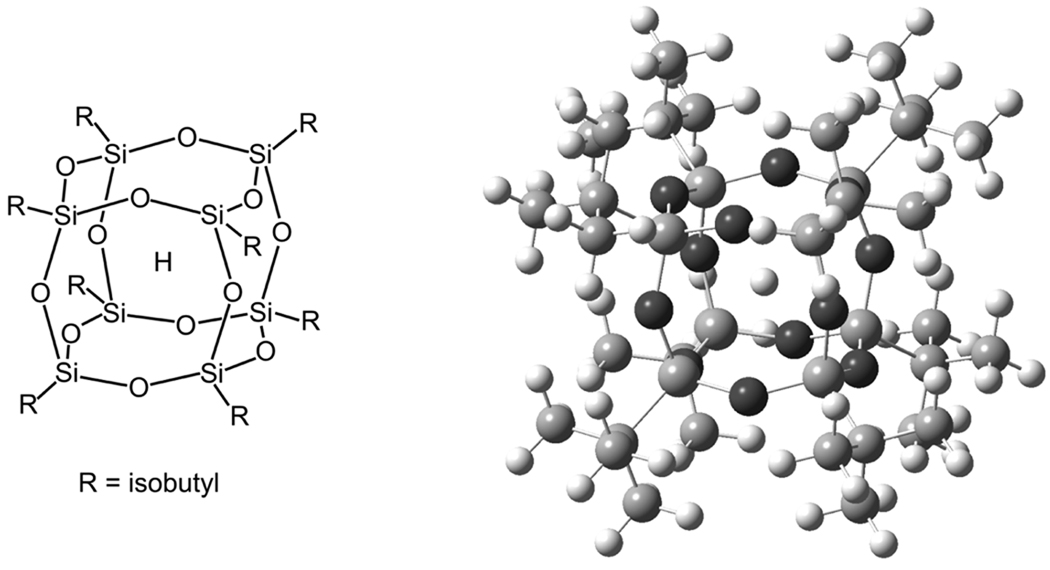
Here, we introduce H@iBuT8 as a new high-precision field standard for high-field EPR that has distinct advantages compared to the standards mentioned above. It is atomic hydrogen trapped in octaisobutylsilsesquioxane iBuT8 [25], a cuboidal silicate cage part of the POSS (polyhedral oligosilsesquioxane) family [26; 27]. Its molecular structure is shown in Fig. 1. In the following, we precisely determine the g value and the hyperfine coupling constant of the trapped hydrogen atom and characterize the temperature dependence of these parameters, both of which are isotropic. We then discuss the utility of this standard and illustrate it with high-field EPR spectra from some systems of current biological interest.
Fig. 1.
Structure of H trapped in the cage cavity of octaisobutylsilsesquioxane (H@iBuT8).
Experimental
Octaisobutylsilsesquioxane (iBuT8, (C4H9)8Si8O12, CAS 221326-46-1) was purchased from Sigma-Aldrich and used without further purification. Hybrid Plastics Inc (Hattiesburg, MS) is an alternative supplier. Trapped atomic hydrogen was generated according to published procedures [28; 29]. 42 mg of iBuT8 together with 4.5 mg of I2(s) was dissolved in cyclohexane andirradiated in a home-made cave-type 60Co source of the “Wisconsin type” described earlier [30] at a dose rate of 50.5 Gy/min for a full week (165h). The iodine was added to quench unwanted secondary radicals that develop during irradiation. The solution was sealed in a 25 mL round bottom Pyrex test tube with a rubber stopper and Parafilm. The tube was placed into a custom-made sample holder which was then inserted into the irradiation chamber of the source. The tube had an OD of 0.5 inch and its center was placed at a distance of 22.9 mm from the source. The dose rate at that distance was determined using the standard Fricke dosimetry approach[31; 32]. After γ-irradiation the solution was purified over a silica column using cyclohexane as the mobile phase. The fractions containing the paramagnetic H@iBuT8 compound as determined by EPR spectroscopy were recovered and the solvent dried off at ambient pressure in a fume hood before sealing the compound in small Teflon capsules which are stored in the freezer at −20°C when not in use. The compound was found to show a stable EPR signal over more than two years under these conditions.
Two different samples of LiF:Li were used (kindly provided by Andre Stesmans, University of Leuven, and Roger Isaacson, University of California San Diego). The spectra of the two samples consist of one line and are identical, with a g value of 2.002293(2) as determined by Stesmans in 1989 [13]. Commercial MgO with a Mn2+ impurity was used (>95% fused MgO, Aldrich), with a g value of 2.00100(5), and a 55Mn hyperfine coupling constant of −243.6(5) MHz, as determined previously [33].
X-band cw EPR measurements were performed at the CalEPR center at UC Davis, with a Bruker ECS106 cw EPR spectrometer equipped with a rectangular TE102 cavity (flushed with N2), an EIP 548A frequency counter and an Oxford ESR900 liquid-helium cryostat. The magnetic field was calibrated using a Bruker ER036TM proton NMR teslameter with an in-cavity probe and an accuracy of about 1 µT. All spectra were recorded after a spectrometer warm-up period of at least 12 h to ensure stability. Q-band cw EPR measurements were performed with a Bruker EleXsys 580 spectrometer equipped with an ER5106QT probe. The magnetic field was calibrated with the teslameter after removal of the probe.
High-field EPR spectra above 400 GHz were recorded at the National High Magnetic Field Laboratory (NHMFL) in Tallahassee FL, using a homodyne transmission-mode spectrometer with a non-resonant probe and a 17 T superconducting magnet [34].
Results
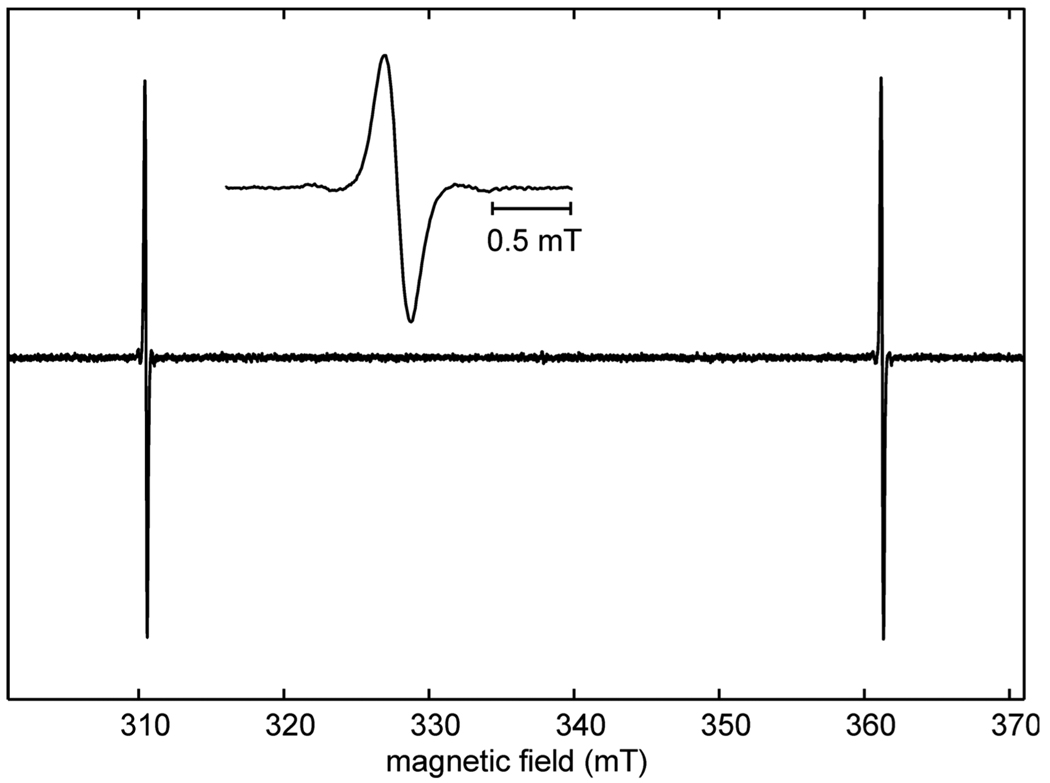
The X-band spectrum of H@iBuT8 at room temperature is shown in Fig. 2. It exhibits two intense lines separated by about 50.7 mT, corresponding to the EPR transitions for the mI = ±1/2 states of the trapped hydrogen atom. Each line is flanked by two satellite peaks separated from the central line by the 1H Larmor frequency (0.47 mT for the low-field line and 0.55 mT for the high-field line). These lines are due to forbidden transitions involving spin-flips of the alkyl ligand protons [28]. Since there are 72 protons in iBuT8, the transitions are quite intense. They saturate less easily than the central line. At fields higher than X band, the satellite lines vanish, since the transition moments become negligibly small. Hyperfine splittings due to 29Si (I = 1/2, 4.7% natural abundance) are not resolved, since they are smaller than the line width: The silicon nuclei are about 2.8 Å from the atomic hydrogen nucleus, corresponding to a dipolar hyperfine coupling below 1 MHz in the point-dipolar approximation. The isotropic 29Si coupling is about 4.2–4.5 MHz [28; 35; 36].
Fig. 2.
Experimental X-band spectrum of H@iBuT8, acquired at 9.4801 GHz and 292 K with 0.1 mT modulation amplitude. Inset: enlarged low-field line.
The g factor and hyperfine coupling constant at room temperature (292 K) were determined from X-band cw EPR spectra of a sample containing both H@iBuT8 and LiF:Li simultaneously as follows. Separate narrow (2 mT) and slow field (25 µT/s) sweeps with 0.01 mT modulation amplitude gave the two resonance lines of the hydrogen standard, at measured spectrometer frequencies ν1 and ν2. A similar sweep was applied to the resonance line of LiF:Li, giving B0 and ν0. The lines were least-squares fitted with Gaussian lineshapes and gave nominal line centers B1nom, B2nom and B0nom. After removing the sample, the probe of the teslameter was placed in the cavity at the sample position and the field set to B1nom, B2nom and B0nom. The field values B1tm, B2tm and B0tm were read from the teslameter with an accuracy of about 1 µT. The g factor and hyperfine coupling were obtained by least-squares fitting the Breit-Rabi expression for the energy levels of an isotropic S = I = 1/2 spin system [37; 38] to (ν1, B1tm) and (ν2, B2tm), yielding gtm and A. The g factor of LiF:Li was obtained from νLi and BLi,tm, yielding a value gLi,tm very close but not identical to the literature value of gLi = 2.002293(2) [13]. Over several independent measurements, the deviation of gLi,tm from gLi varied randomly but correlated with the variation in gtm. To reduce the impact of the error, we added the deviation gLi,tm – gLi to gtm and averaged over several measurements. The final analysis gave g = 2.00294(3) and A = 1413.7(1) MHz, practically identical to the literature values for H in other octaalkylsilsesquioxane hosts [39]. The largest source of uncertainty are the determination of the line centers, the positioning of the teslameter probe in the cavity, and instrumental drifts in the time between spectral acquisitions and teslameter calibrations. Uncertainties in the teslameter readout (3×10⁻⁶, relative), the measured microwave frequency (<10−8, relative) and the physical constants used (<5×10⁻⁸, relative) [40] are negligible.
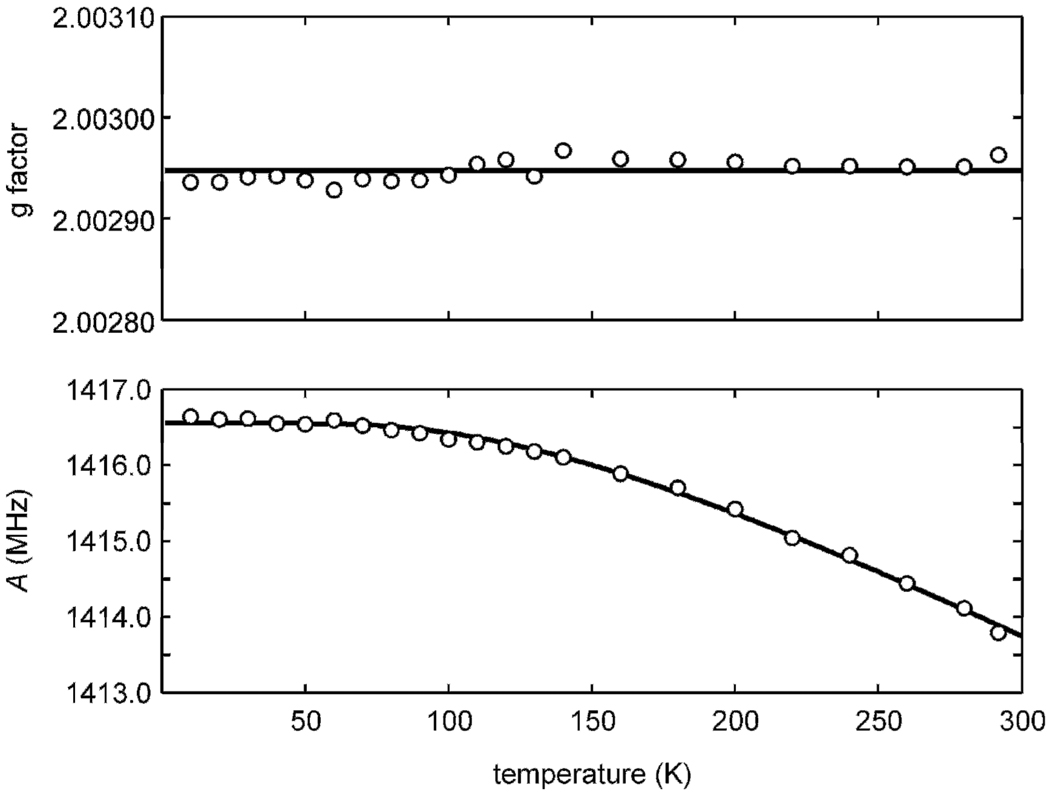
For determining the temperature dependence of g and A below room temperature, the teslameter could not be used, and the hyperfine splittings and g factors were obtained as follows. For each temperature, line centers B1nom, B2nom and B0nom were determined as above. These field values were corrected using a field calibration curve Bnom vs. Btm obtained with the teslameter at room temperature, yielding B1tm, B2tm and B0tm. g and A were determined by least-squares fitting, and the g factor was again adjusted by comparison of the measured gLi,tm to the literature value. The results are shown in Fig. 3. The values at room temperature of this temperature-dependent series coincide within experimental error with the independently measured room temperature values from above.
Fig. 3.
Temperature dependence of the g factor and the hyperfine coupling of H@iBuT8, measured at 9.48 GHz and 1 µW. Dots: Experimental values with errors ±0.00006 for g and ±0.2 MHz for A. Lines: average of g values (2.00294), fit of three-dimensional oscillator model [39] to A values (c0 = 0.00332, c2 = –0.89 nm–2, k = 5.1 N m–1).
In our measurements, the g factor is temperature independent within experimental error. This is consistent with previous measurements on similar systems [39] and with theoretical calculations [41] that predict an increase of only about 3 ppm between 0 and 300 K. The g factor is always larger than the g value of the free hydrogen atom, 2.00228384(3) [42]. This deviation is almost entirely due to the unpaired spin partially delocalized onto the twelve oxygen atoms of the cage [41], which give a large spin-orbit contribution to the g shift (deviation of g from the free-electron value ge = 2.0023193…). The temperature independence is due to the fact that any displacement of the hydrogen atom from the cube center will bring it closer to one group of oxygens, but at the same time take it away from another group, so the effect of spin density loss on one group is compensated by the gain on the other.
The hyperfine coupling is temperature independent within experimental error between 10 K and 70 K (1415.8(2) MHz), consistent with previous reports [39; 43]. Above 70 K, the hyperfine coupling starts to decrease noticeably with increasing temperature [35; 39] until it reaches 1413.7(1) MHz at room temperature. Across the entire temperature range, it is slightly smaller than the free hydrogen atom value (1420.405751768(1) MHz [44]). Several effects contribute to this temperature-dependent deviation. Spin delocalization from the hydrogen atom onto the cage reduces the spin density at the nucleus and consequently the hyperfine coupling, but this is partly compensated by the cage-induced compression of the hydrogen atom 1s orbital. The non-zero average displacement of the hydrogen atom from the cube center due to vibrations also reduces the hyperfine coupling compared to the free-atom value, even at zero temperature. At temperatures above about 70 K, higher vibrational states are thermally populated, and the hyperfine coupling decreases linearly with temperature [43].
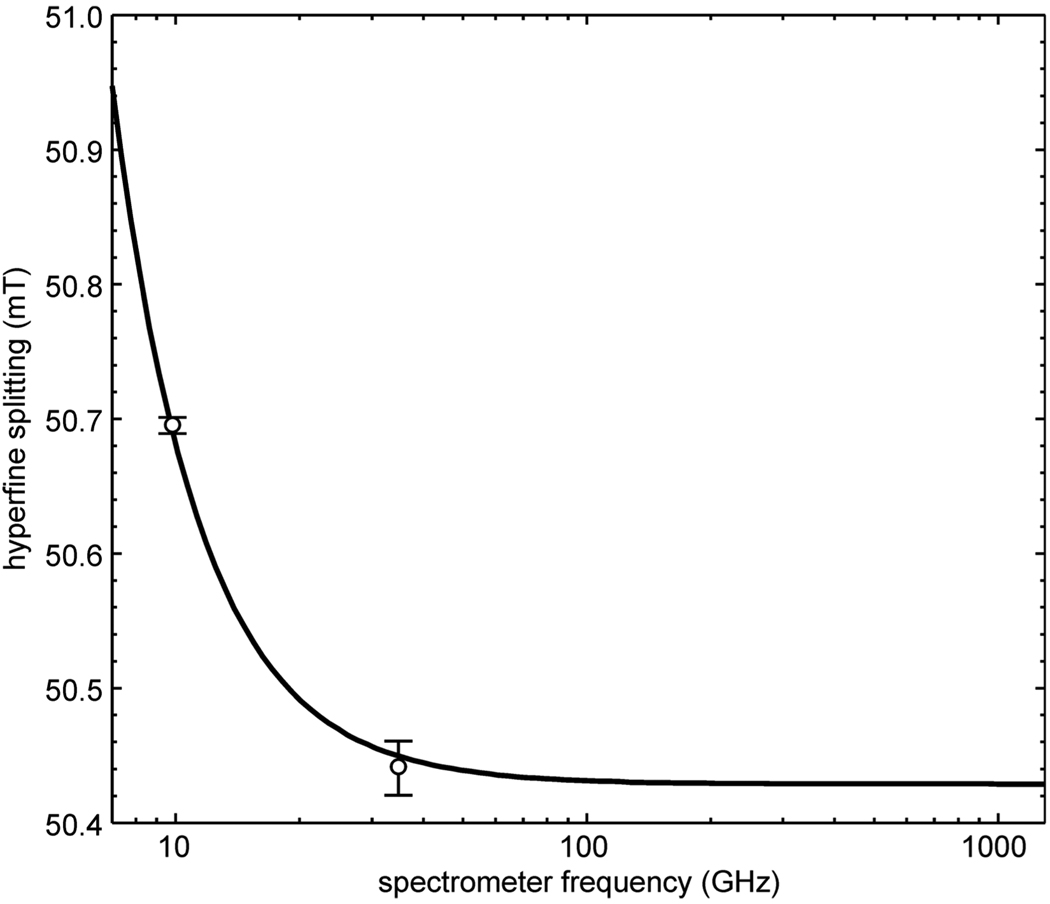
The hyperfine coupling leads to a splitting of 50.4 to 51 mT (at room temperature) depending on the spectrometer frequency, as illustrated in Fig. 4. In the high-frequency limit, it approaches its first-order value of 50.428 mT. The deviation from this value at lower frequencies is due to higher-order effects. For an accuracy of less than 3µT (10−5 relative), second-order effects are relevant below 80 GHz. Below about 20 GHz, fourth-order terms are significant as well (third-order effects are zero for spin-1/2 nuclei).
Fig. 4.
Spectrometer frequency dependence of the splitting between the two lines of H@iBuT8. Circles with error bars: experimental values at room temperature, X and Q band. Solid line: Breit-Rabi computation with A(1H) = 1413.7 MHz and g = 2.00294.
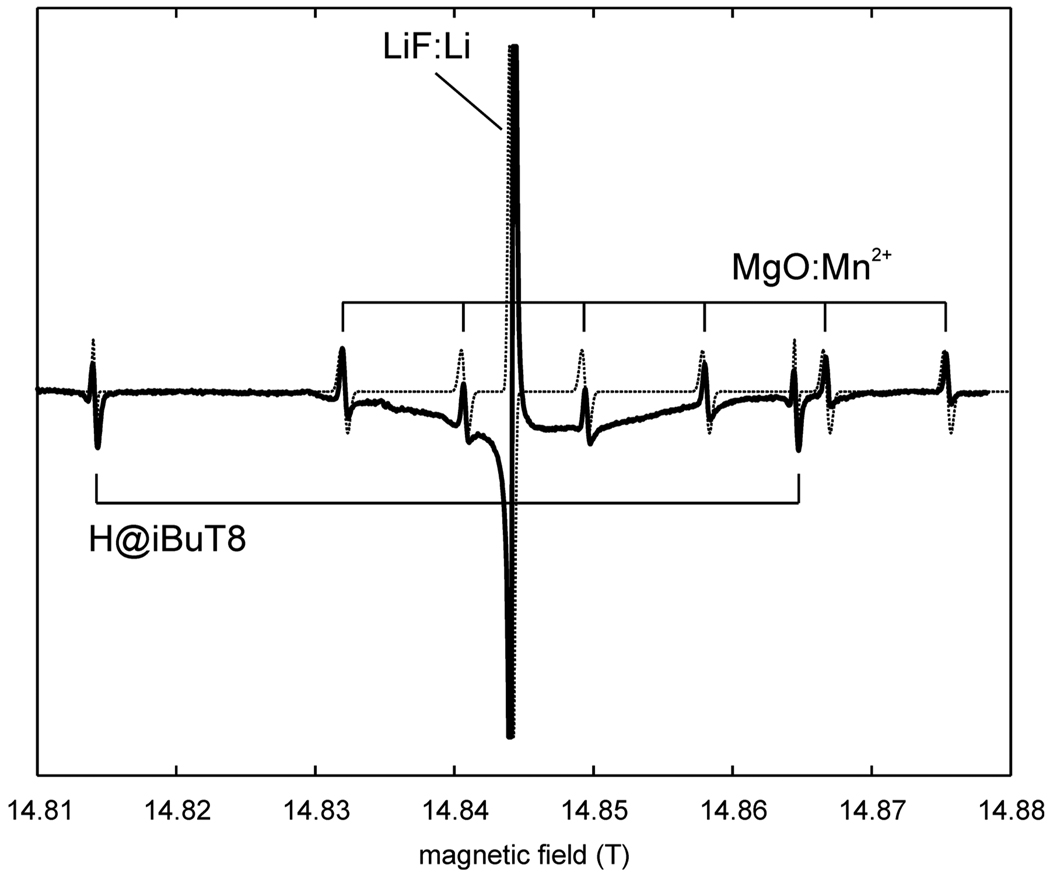
An important question is whether the g value is field independent. Since no high-precision NMR teslameters working above 1.5 T are available, this can only be assessed by comparison of the high-field spectrum of the hydrogen standard to those of other EPR standards for which parameters have also been determined at X band. Fig. 5 shows the 416 GHz spectrum of a sample containing H@iBuT8, LiF:Li and MgO:Mn2+. Rapid passage effects distort the individual line shapes as if often the case in high-field EPR at cryogenic temperatures. However, the positions of all the lines could be accurately simulated using the parameters determined at X band. This shows that the magnetic parameters at X band and at high field of the three standards are internally consistent. A field dependence of the g and A values of the hydrogen standard can therefore be excluded, unless these field dependencies are identical for the three standards. This in turn is not likely given the very different chemical nature of the paramagnetic species (an isolated H atom, a transition metal ion, and a metallic nanocluster). However, further verification of the field independence above 1.5 T has to await the development of high-precision high-field NMR teslameters.
Fig. 5.
416.000 GHz spectra of H@iBuT8, together with LiF:Li and MgO:Mn2+, recorded at 60 K. Sweep rate 0.1 mT/s, modulation 0.1 mT at 50 kHz. Dashed line: simulation.
With the Mn2+ standard, we could assess the linearity of the field sweep, which could be compromised due to hysteresis effects. The six lines are equally spaced, and they are centered at a position corresponding to the known g value. Therefore, in the range covered by the six Mn lines, the sweep is linear within experimental error. Note that this assessment is not possible with a standard with only one (LiF:Li) or two (H@iBuT8) lines.
Apart from unresolved hyperfine splittings from distant 1H, the lines are broadened by the inhomogeneity of the magnetic field over the sample volume in the magnet of the given spectrometer. Whereas magnets for W-band spectrometers are very homogeneous (giving LiF:Li line widths as small as 0.03 mT), magnets used for measurements above that frequency are less so. The field homogeneity in the magnet used for our 400 GHz measurements is about 0.3 mT over the sample volume which is contained in a cylinder of 2 mm diameter and 3 mm length.
Discussion
The H@iBuT8 standard is superior to other field standards commonly employed in several respects.
Compared to the “gold” standard LiF:Li, it has broader lines, but the definite advantage that a 51 mT wide field range between its two spectral lines can be calibrated. This is not possible with the one-line standard LiF:Li.
Probably the most distinctive advantage of H@iBuT8 over other field standards is that it can be measured simultaneously with samples containing organic radicals without overlapping their spectra. The spectra of most biological organic radicals do not overlap with the spectrum of the hydrogen standard until above 650 GHz. Only the spectra of tyrosyl radicals overlap with the low-field line of the H standard above 200–300 GHz, depending on the radical. Even if the low-field line overlaps with part of the spectrum, often the spectrometer frequency can be chosen such that it does not fall on a principal axis feature (gx) of the spectrum. Due to the large hyperfine splitting of 51 mT, the hydrogen standard is not ideal for organic radicals at low frequencies (X and Q band), since their spectra are usually much narrower than that, and the hydrogen standard would require sweeps much wider than necessary.
Yet another advantage of the hydrogen standard is that the temperature dependences of g and A are known and well understood. In contrast, little is known about the temperature dependence of the magnetic parameters in MgO:Mn2+ and in LiF:Li.
H@iBuT8 is exceptionally stable. Atomic hydrogen atoms have been trapped in many matrices at cryogenic temperatures, but only in octasilsesquioxane are they stable for years. In alkali halides they are unstable above 165 K [45], and in quartz they disappear above 100–120 K [46; 47]. In calcium phosphate their half life at room temperature is about 4 days [48]. In CaF2 and other alkali-earth fluorides, the signals from interstitial atomic H decay within a few months [49; 50]. Endohedral 1H atoms in fullerene C60 have been elusive so far [51].
The substituent choice R (see Fig. 1) determines the solubility of the compound. Most alkyl substituted T8 are soluble in non-polar solvents like cyclohexane and CCl4. Hydrido-, methyl-and phenyl-T8 are poorly soluble [28]. The substituent choice also affects the trapping yield. In hydrido-, methyl-, phenyl- and vinyl-T8, it cannot be increased by addition of scavenger [28]. Ethyl- and propyl-T8 give the highest yields. Our choice of isobutyl substituents maximizes the amount of substituent protons, which also maximizes the trapping yield. The many ligand protons also enhance relaxation [25], which helps avoid saturation at low temperature. By using per-deuterated substituents, the lines could be narrowed substantially. However, as the trapped hydrogen atoms are partially originating from the substituents and partially from the solvent, it is not possible to produce 100% trapped H (without any D) with perdeuterated substituents. Of course, the use of perdeuterated substituents and/or solvents will allow trapping of 2D in the silica cage [28]. This would be useful in cases where field sweep nonlinearity is an issue and overlap between the signals of the standard and the organic radical to be tested can be tolerated. One would be able to utilize up to five well-defined lines, two from H@iBuT8 and three from D@iBuT8 for the field calibration. Trimethylsilyl-D4R (Q8M8, used as standard in 29Si solid-state NMR) is an alternative as well, as it gives decent trapping yields [28] and an EPR line width smaller than in H@iBuT8, at the cost of reduced relaxation. We have not explored this.
On a side note, it is not by chance that the two most reliable g = 2 field standards are based on hydrogen (H@RT8) and Li (LiF:Li): They are the lightest elements and have very small spin-orbit coupling constants, so that their g shifts are very small.
A class of compounds giving spectra similar to the hydrogen standard are fullerenes encapsulating atomic nitrogen or phosphorous with S = 3/2. However, the hyperfine splittings due to the trapped nuclei, 0.74 mT for 15N@C60 [52; 53] and 4.92 mT for 31P@C60 [54–56], are much smaller than the 50–51 mT observed for the hydrogen standard. Therefore, although endohedral fullerenes could be used as field standards, they do not offer the advantage of not overlapping with the high-field spectra of organic radicals.
Examples
To illustrate the utility of H@iBuT8, we show two examples of spectra recorded at >400 GHz.
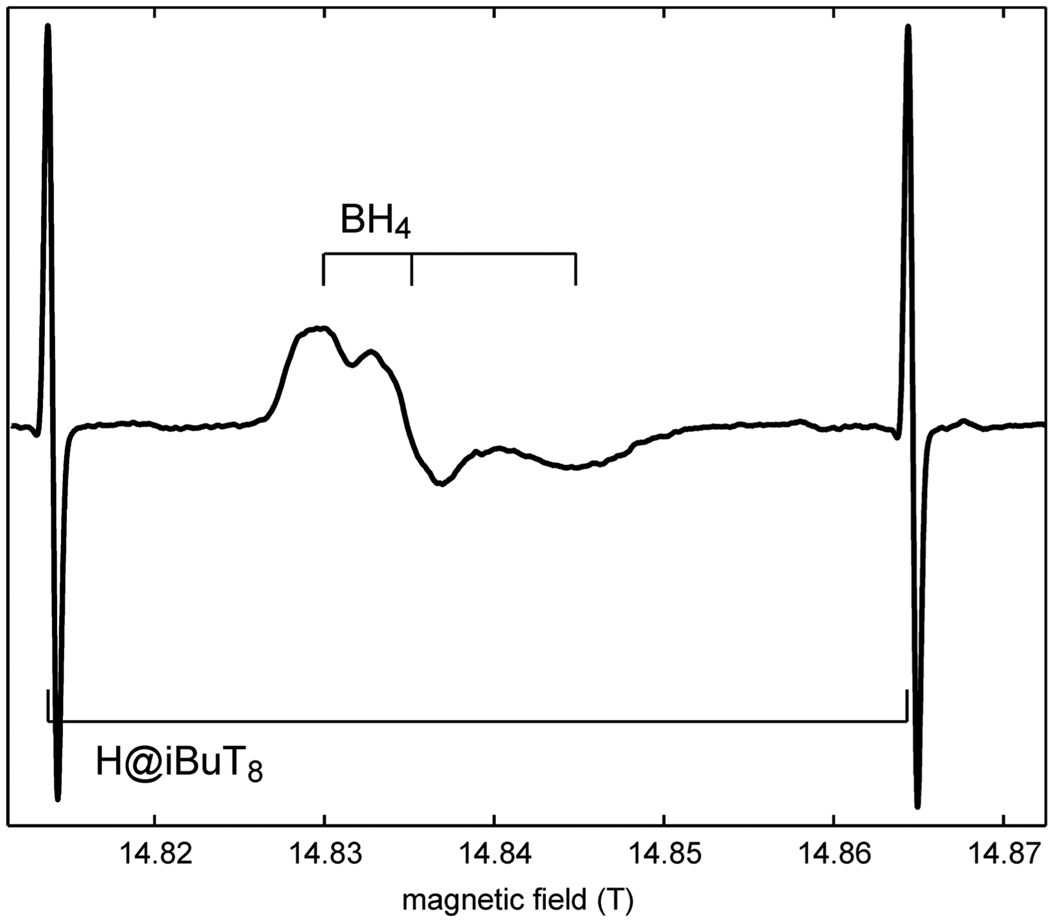
Fig. 6 shows the spectrum of the freeze-quenched transient tetrahydrobiopterin cofactor radical observed during turnover in nitric oxide synthase [57]. This cofactor acts as a reversible electron donor to the heme active site. The hydrogen standard lines frame the radical spectrum without overlapping with it. The g tensor is rhombic, and with the help of the hydrogen standard the principal values were determined as 2.00430(5), 2.00353(5) and 2.00210(9), values very similar to those of anionic flavin radicals (e.g. [58; 59]). From these accurate g values, the protonation state of the cofactor can be determined [60]. Apart from the g anisotropy, the spectrum is broadened due to several unresolved 1H and 14N hyperfine couplings.
Fig. 6.
cw EPR spectrum of the tetrahydrobiopterin (BH4) radical in the heme domain of inducible nitric oxide synthase (iNOS), measured at 416 GHz and 50 K, sweep rate 0.021 mT/s, modulation 10 mA at 50 kHz.
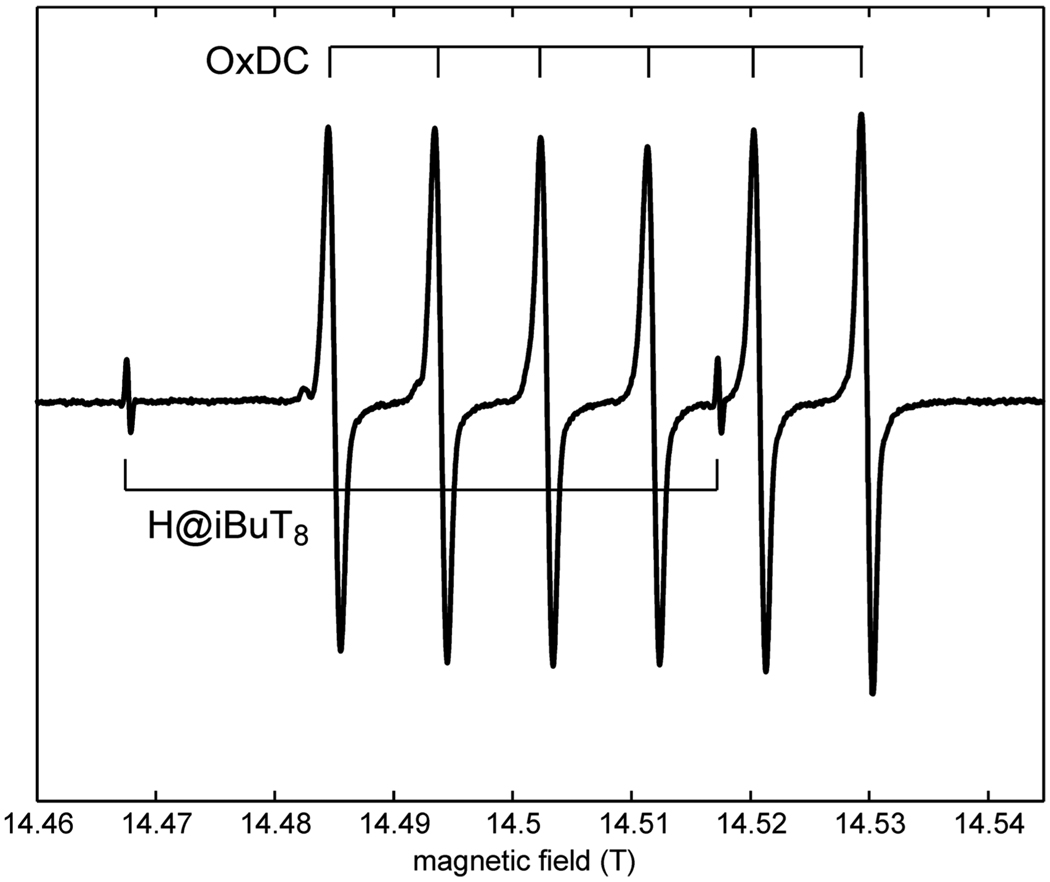
The second example, in Fig. 7, shows the spectrum of oxalate decarboxylase, a Mn-dependent bicupin enzyme. It contains two distinct Mn-binding sites both of which have to be populated for enzymatic activity [61]. High-field EPR has revealed a remarkable number of distinct Mn(II) species dependent on pH and buffer conditions [62; 63]. The obvious advantage of using the H@ iBuT8 standard in this case over the commonly used Mn(II) standard lies in the fact that it shows only little overlap with the spectrum of interest. By a proper choice of the field/frequency combination the high-field line of the standard can be made to appear between the Mn(II) hyperfine lines as seen in Fig. 7.
Fig. 7.
cw EPR spectrum of oxalate decarboxylase (OxDC) in piperazine buffer at pH 6.3, measured at 406.4 GHz and 20 K, sweep rate 0.1 mT/s, modulation 0.05 mT at 50 kHz.
Conclusions
Atomic hydrogen trapped in octaisobutylsilsesquioxane is an excellent precision internal field standard for high-field EPR since (1) its EPR spectrum has two (and not one) lines allowing the calibration of the field range between the two lines, (2) its two lines are centered at g ≈ 2 and separated about 51 mT and do therefore not overlap with spectra of most organic radicals at high field, (3) its EPR spectrum depends only on two isotropic parameters (g and A) whose values and temperature dependences are accurately known, (4) it can easily be prepared and is a stable solid. A disadvantage of H@iBuT8 is that it cannot be used to assess field sweep linearity because it only shows two lines. However, this can be easily remedied by the use of a perdeuterated solvent during γ-irradiation.
Acknowledgments
This work was supported by NIH grant GM73789 (R.D.B.), by NSF grant CHE-0809725 (A.A.), and by the NHMFL (UCGP program, A.A.), which is funded by the NSF (DMR-0654118), the State of Florida and the DOE. We wish to thank Mr. Brian Nocito for his help in preparing the H@iBuT8 samples, Prof. Luis Muga for the use of the 60Co source, and Dr. Troy Stich for useful discussions.
Footnotes
Publisher's Disclaimer: This is a PDF file of an unedited manuscript that has been accepted for publication. As a service to our customers we are providing this early version of the manuscript. The manuscript will undergo copyediting, typesetting, and review of the resulting proof before it is published in its final citable form. Please note that during the production process errors maybe discovered which could affect the content, and all legal disclaimers that apply to the journal pertain.
References
- 1.Bratt PJ, Ringus E, Hassan AK, van Tol J, Maniero AL, Brunel L-C, Rohrer M, Bubenzer-Hange C, Scheer H, Angerhofer A. EPR on Biological Samples beyond the Limits of Superconducting Magnets - The Primary Donor Cation of Purple Bacterial Photosynthesis. J. Phys. Chem. B. 1999;103:10973–10982. [Google Scholar]
- 2.Konovalova TA, Krzystek J, Bratt PJ, van Tol J, Brunel L-C, Kispert LD. 95–670 GHz EPR Studies of Canthaxanthin Radical Cation Stabilized on a Silica-Alumina Surface. J. Phys. Chem. B. 1999;103:5782–5786. [Google Scholar]
- 3.Bratt PJ, Heathcote P, Hassan A, van Tol J, Brunel LC, Schrier J, Angerhofer A. EPR at 24 T of the primary donor radical cation from Blastochloris viridis. Chem. Phys. 2003;294:277–284. [Google Scholar]
- 4.Un S, Dorlet P, Rutherford AW. A high-field EPR tour of radicals in photosystems I and II. Appl. Magn. Reson. 2001;21:341–361. [Google Scholar]
- 5.Faller P, Coussias C, Rutherford AW, Un S. Resolving intermediates in biological proton-coupled electron transfer: A tyrosyl radical prior to proton movement. Proc. Nat. Acad. Sci. USA. 2003;100:8732–8735. doi: 10.1073/pnas.1530926100. [DOI] [PMC free article] [PubMed] [Google Scholar]
- 6.Un S. The g-value and hyperfine coupling of amino acid radicals in proteins: comparison of experimental measurements with ab initio calculations. Magn. Reson. Chem. 2005;43:S229–S236. doi: 10.1002/mrc.1660. [DOI] [PubMed] [Google Scholar]
- 7.Lendzian F. Structure and interactions of amino acid radicals in class I ribonucleotide reductase studied by ENDOR and high-field EPR spectroscopy. Biochim. Biophys. Acta. 2005;1707:67–90. doi: 10.1016/j.bbabio.2004.02.011. [DOI] [PubMed] [Google Scholar]
- 8.Wilson JC, Wu G, Tsai A-L, Gerfen GJ. Determination of the Structural Environment of the Tyrosyl Radical in Prostaglandin H2 Synthase-1: A High Frequency ENDOR/EPR Study. J. Am. Chem. Soc. 2005;127:1618–1619. doi: 10.1021/ja043853q. [DOI] [PMC free article] [PubMed] [Google Scholar]
- 9.Kacprzak S, Kaupp M. Electronic g-Tensors of Semiquinones in Photosynthetic Reaction Centers. A Density Functional Study. J. Phys. Chem. B. 2004;108:2464–2469. [Google Scholar]
- 10.Benisvy L, Bittl R, Bothe E, Garner CD, McMaster J, Ross S, Teutloff C, Neese F. Phenoxyl Radicals Hydrogen-Bonded to Imidazolium: Analogues of Tyrosyl DC of Photosystem II: High-Field EPR and DFT Studies. Angew. Chem. Int. Ed. 2005;44:5314–5317. doi: 10.1002/anie.200501132. [DOI] [PubMed] [Google Scholar]
- 11.Sinnecker S, Flores M, Lubitz W. Protein-cofactor interactions in bacterial reaction centers from Rhodobacter sphaeroides R-26: Effect of hydrogen bonding on the electronic and geometric structure of the primary quinone. A density functional theory study. Phys. Chem. Chem. Phys. 2006;8:5659–5670. doi: 10.1039/b612568a. [DOI] [PubMed] [Google Scholar]
- 12.Un S, Bryant J, Griffin RG. Precision Field-Sweep System for Superconducting Solenoids and Its Application to High-Frequency EPR Spectroscopy. J. Magn. Reson. A. 1993;101:92–94. [Google Scholar]
- 13.Stesmans A, Van Gorp G. Improved measurement of the g-factor of conduction electrons in Li particles embedded in LiF-Li. Phys. Lett. A. 1989;139:95–98. [Google Scholar]
- 14.Burghaus O, Rohrer M, Götzinger T, Plato M, Möbius K. A novel high-field high-frequency EPR and ENDOR spectrometer operating at 3 mm wavelength. Meas. Sci. Technol. 1992;3:765–774. [Google Scholar]
- 15.Feher G. Electron Spin Resonance Experiments on Donors in Silicon. I. Electronic Structure of Donors by the Electron Nuclear Double Resonance Technique. Phys. Rev. 1959;114:1219–1244. [Google Scholar]
- 16.Stesmans A, De Vos G. ESR observation of temperature-dependent g shifts in subbmetallic P-doped Si at low temperatures. Phys. Rev. B. 1986;34:6499–6502. doi: 10.1103/physrevb.34.6499. [DOI] [PubMed] [Google Scholar]
- 17.Isaacson R, Lendzian F, Abresch E, Lubitz W, Feher G. Electronic structure of QA− in reaction centers from Rhodobacter sphaeroides. I. Electron paramagnetic resonance in single crystals. Biophys. J. 1995;69:311–322. doi: 10.1016/S0006-3495(95)79936-2. [DOI] [PMC free article] [PubMed] [Google Scholar]
- 18.Krzystek J, Sienkiewicz A, Pardi LA, Brunel L-C. DPPH as Standard for High-Field EPR. J. Magn. Reson. 1997;125:207–211. doi: 10.1006/jmre.1996.1098. [DOI] [PubMed] [Google Scholar]
- 19.Yordanov ND. Is Our Knowledge about the Chemical and Physical Properties of DPPH Enough to Consider It as a Primary Standard for Quantitative EPR Spectroscopy? Appl. Magn. Reson. 1996;10:339–350. [Google Scholar]
- 20.Kolaczkowski SV, Cardin JT, Budil DE. Some Remarks on Reported Inconsistencies in the High-Field EPR Spectrum of DPPH. Appl. Magn. Reson. 1999;16:293–298. [Google Scholar]
- 21.Goldman SA, Bruno GV, Polnaszek CF, Freed JH. An ESR Study of Anisotropic Rotational Reorientation and Slow Tumbling in Liquid and Frozen Media. J. Chem. Phys. 1972;56:716–735. [Google Scholar]
- 22.Poluektov OG, Utschig LM, Schlesselman SL, Lakshmi KV, Brudvig GW, Kothe G, Thurnauer MC. Electronic Structure of the P700 Special Pair from High-Frequency EPR Spectroscopy. J. Phys. Chem. B. 2002;106:8911–8916. [Google Scholar]
- 23.Möbius K. Untersuchung von einfachen π-Elektronensystemen mit Hilfe von Elektronenspin-Resonanz und Polarographie. Z. Naturforsch. A. 1965;20:1102–1116. [Google Scholar]
- 24.Cage B, Weekley A, Brunel L-C, Dalal NS. K3CrO8 in K3NbO8 as a Proposed Standard for g-Factor, Spin Concentration, and Field Calibration in High-Field EPR Spectroscopy. Anal. Chem. 1999;71:1951–1957. [Google Scholar]
- 25.Sasamori R, Okaue Y, Isobe T, Matsuda Y. Stabilization of Atomic Hydrogen in Both Solution and Crystal at Room Temperature. Science. 1994;265:1691–1693. doi: 10.1126/science.265.5179.1691. [DOI] [PubMed] [Google Scholar]
- 26.Baney RH, Itoh M, Sakakibara A, Suzuki T. Silsesquioxanes. Chem. Rev. 1995;95:1409–1430. [Google Scholar]
- 27.Li G, Wang L, Ni H, Pittman CU., Jr Polyhedral Oligomeric Silsesquioxane (POSS) Polymers and Copolymers: A Review. Journal of Inorganic and Organometallic Polymers. 2001;11:123–154. [Google Scholar]
- 28.Paech M, Stösser R. Scavenger Assisted Trapping of Atomic Hydrogen in Si8O12-Cages. J. Phys. Chem. A. 1997;101:8360–8365. [Google Scholar]
- 29.Hayashino Y, Isobe T, Matsuda Y. Simple Simultaneous Encapsulation of Both Single H Atoms and Single D Atoms in Octasilsesquioxane, Double Four-Ring Cages Using a Deuterated Solvent. Inorg. Chem. 2001;40:2218–2219. doi: 10.1021/ic000803n. [DOI] [PubMed] [Google Scholar]
- 30.Hanrahan RJ. A Co60 Gamma Irradiator for Chemical Research. Int. J. Appl. Rad. Isotopes. 1962;13:254–255. [Google Scholar]
- 31.Fricke H, Morse S. The action of x-rays on ferrous sulfate solutions. Phil. Mag. 1929;7:129–141. [Google Scholar]
- 32.Vereshchinskii IV, Pikaev AK. Introduction to Radiation Chemistry, Israel Program for Scientific Translations. Jerusalem. 1964 [Google Scholar]
- 33.Stoll S, Gunn A, Brynda M, Sughrue W, Kohler AC, Ozarowski A, Fisher AJ, Lagarias JC, Britt RD. Structure of the Biliverdin Radical Intermediate in Phycocyanobilin:Ferredoxin Oxidoreductase Identified by High-Field EPR and DFT. J. Am. Chem. Soc. 2009;131:1986–1995. doi: 10.1021/ja808573f. [DOI] [PMC free article] [PubMed] [Google Scholar]
- 34.Hassan AK, Pardi LA, Krzystek J, Sienkiewicz A, Goy P, Rohrer M, Brunel L-C. Ultrawide band multifrequency high-field EMR technique: A methodology for increasing spectroscopic information. J. Magn. Reson. 2000;142:300–312. doi: 10.1006/jmre.1999.1952. [DOI] [PubMed] [Google Scholar]
- 35.Weiden N, Paech M, Dinse K-P. Pulsed EPR and ENDOR Investigation of Hydrogen Atoms in Silsesquioxane Cages. Appl. Magn. Reson. 2001;21:507–516. [Google Scholar]
- 36.Schoenfeld RS, Harneit W, Paech M. Pulsed and cw EPR studies on hydrogen atoms encaged in octasilsesquioxane molecules. Phys. Status Solidi B. 2006;243:3008–3012. [Google Scholar]
- 37.Weil JA. The Analysis of Large Hyperfine Splitting in Paramagnetic Resonance Spectroscopy. J. Magn. Reson. 1971;4:394–399. [Google Scholar]
- 38.Stoll S, Schweiger A. EasySpin, a comprehensive software package for spectral simulation and analysis in EPR. J. Magn. Reson. 2006;178:42–55. doi: 10.1016/j.jmr.2005.08.013. [DOI] [PubMed] [Google Scholar]
- 39.Gross B, Dilger H, Scheuermann R, Paech M, Roduner E. Electron Paramagnetic Resonance Study of the Dynamics of H and D Atoms Trapped in Substituted Silasesquioxane Cages. J. Phys. Chem. A. 2001;105:10012–10017. [Google Scholar]
- 40.Mohr PJ, Taylor BN, Newell DB. CODATA recommended values of the fundamental physical constants: 2006. Rev. Mod. Phys. 2008;80:633–730. doi: 10.1103/RevModPhys.93.025010. [DOI] [PMC free article] [PubMed] [Google Scholar]
- 41.Kaupp M, Asher J, Arbuznikov A, Patrakov A. Understanding the unusual g-values and the spin density distribution of hydrogen atoms trapped in silasesquioxanes. Phys. Chem. Chem. Phys. 2002;4:5458–5466. [Google Scholar]
- 42.Tiedeman JS, Robinson HG. Determination of gJ(1H, 12S1/2)/gs(e): Test of Mass-Independent Corrections. Phys. Rev. Lett. 1977;39:602–604. [Google Scholar]
- 43.Dilger H, Roduner E, Scheuermann R, Major J, Schefzik M, Stösser R, Paech M, Fleming DG. Mass and temperature effects on the hyperfine coupling of atomic hydrogen isotopes in cages. Physica B. 2000;289–290:482–486. [Google Scholar]
- 44.Karshenboim SG. Precision physics of simple atoms: QED tests, nuclear structure and fundamental constants. Phys. Rep. 2005;422:1–63. [Google Scholar]
- 45.Spaeth J-M. Atomic Hydrogen and Muonium in Alkali Halides. Hyperfine Interact. 1986;32:641–658. [Google Scholar]
- 46.Weeks RA, Abraham M. Electron Spin Resonance of Irradiated Quartz: Atomic Hydrogen. J. Chem. Phys. 1965;42:68–71. [Google Scholar]
- 47.Weil JA. Hydrogenic Atoms in Silicon Dioxide. Hyperfine Interact. 1981;8:371–374. [Google Scholar]
- 48.Virmani YP, Zimbrick JD, Zeller EJ. An Electron Paramagnetic Resonance Study of Hydrogen Atoms Trapped in γ-Irradiated Calcium Phosphate. J. Phys. Chem. 1971;75:1936–1941. [Google Scholar]
- 49.Hall JL, Schumacher RT. Electron Spin Resonance of Hydrogen Atoms in CaF2. Phys. Rev. 1962;127:1892–1912. [Google Scholar]
- 50.Pake GE, Estle TL. The Physical Principles of Electron Paramagnetic Resonance. Reading MA: Benjamin; 1973. [Google Scholar]
- 51.Beardmore K, Smith R, Richter A, Mertesacker B. The interaction of hydrogen with C60 fullerenes. J. Phys: Condens. Matter. 1994;6:7351–7364. [Google Scholar]
- 52.Almeida Murphy T, Pawlik T, Weidinger A, Höhne M, Alcala R, Spaeth J-M. Observation of Atomlike Nitrogen in Nitrogen-Implanted Solid C60. Phys. Rev. Lett. 1996;77:1075–1078. doi: 10.1103/PhysRevLett.77.1075. [DOI] [PubMed] [Google Scholar]
- 53.Kobayashi K, Nagase S, Dinse K-P. A theoretical study of spin density distributions and istropic hyperfine couplings of N and P atoms in N@C60, P@C60, N@C70, N@C60(CH2)6 and N@C60(SiH2)6. Chem. Phys. Lett. 2003;377:93–98. [Google Scholar]
- 54.Knapp C, Weiden N, Käss H, Dinse K-P, Pietzak B, Waiblinger M, Weidinger A. Electron paramagnetic resonance study of atomic phosphorous encapsulated in [60]fullerene. Mol. Phys. 1998;95:999–1004. [Google Scholar]
- 55.Larsson JA, Greer JC, Harneit W, Weidinger A. Phosphorous trapped within buckminsterfullerene. J. Chem. Phys. 2002;116:7849–7854. [Google Scholar]
- 56.Scheloske M, Naydenov B, Meyer C, Harneit W. Synthesis and Functionalization of Fullerenes Encapsulating Atomic Phosphorous. Isr. J. Chem. 2006;46:407–412. [Google Scholar]
- 57.Hurshman AR, Krebs C, Edmondson DE, Huynh BH, Marletta MA. Formation of a Pterin Radical in the Reaction of the Heme Domain of Inducible Nitric Oxide Synthase with Oxygen. Biochemistry. 1999;38:15689–15696. doi: 10.1021/bi992026c. [DOI] [PubMed] [Google Scholar]
- 58.Barquera B, Morgan JE, Lukoyanov D, Scholes CP, Gennis RB, Nilges MJ. X-and W-band EPR and Q-band ENDOR studies of the flavin radical in the Na+-translocating NADH: quinone oxidoreductase from Vibrio cholerae. J. Am. Chem. Soc. 2003;125:265–275. doi: 10.1021/ja0207201. [DOI] [PubMed] [Google Scholar]
- 59.Schleicher E, Bittl R, Weber S. New roles of flavoproteins in molecular cell biology: Blue-light active flavoproteins studied by electron paramagnetic resonance. FEBS J. 2009;276:4290–4303. doi: 10.1111/j.1742-4658.2009.07141.x. [DOI] [PubMed] [Google Scholar]
- 60.Stoll S, NejatyJahromy Y, Woodward JJ, Ozarowski A, Marletta MA, Britt RD. The Tetrahydrobiopterin Radical in Nitric Oxide Synthase, in preparation. 2010 doi: 10.1021/ja105372s. [DOI] [PubMed] [Google Scholar]
- 61.Moomaw EW, Angerhofer A, Moussatche P, Ozarowski A, García-Rubio I, Richards NGJ. Metal Dependence of Oxalate Decarboxylase Activity. Biochemistry. 2009;48:6116–6125. doi: 10.1021/bi801856k. [DOI] [PMC free article] [PubMed] [Google Scholar]
- 62.Angerhofer A, Moomaw EW, García-Rubio I, Ozarowski A, Krzystek J, Weber RT, Richards NGJ. Multifrequency EPR Studies on the Mn(II) Centers of Oxalate Decarboxylase. J. Phys. Chem. B. 2007;111:5043–5046. doi: 10.1021/jp0715326. [DOI] [PubMed] [Google Scholar]
- 63.Tabares LC, Gätjens J, Hureau C, Burrell MR, Bowater L, Pecoraro VL, Bornemann S, Un S. pH-Dependent Structures of the Manganese Binding Sites in Oxalate Decarboxylase as Revealed by High-Field Electron Paramagnetic Resonance. J. Phys. Chem. B. 2009;113:9016–9025. doi: 10.1021/jp9021807. [DOI] [PMC free article] [PubMed] [Google Scholar]


