

Abstract
An inexpensive, easily synthesized calixarene:fluorotoluene host:guest inclusion complex has been designed for optimization and calibration of solid-state NMR measurements of carbon-fluorine distances using Rotational Echo DOuble Resonance (REDOR). Complexation of the fluorotoluene with the calixarene host separates the molecules such that simple two-spin behavior is observed for one site with a 4.08 Å carbon-fluorine distance. Fluorotoluene dynamics within the calixarene matrix causes motional averaging of the dipolar couplings that make it possible to easily optimize REDOR experiments and test their accuracy for relatively long distance measurements (> 6.6 Å). This provides a new tool for accurate REDOR measurements of long carbon-fluorine distances, which have important applications in the characterization of fluorine-containing drugs, proteins, and polymers.
Keywords: carbon-fluorine distance measurements, REDOR, rotational echo double resonance, magic angle spinning, calixarene
Introduction
REDOR (Rotational Echo DOuble Resonance) is a solid-state NMR technique for measuring internuclear distances. Carbon-fluorine REDOR in particular is a powerful tool for studying macromolecules and supramolecular complexes due to its long effective range; literature reports include a >10 Å distance, measured with sub-Angstrom accuracy, in drug-bound microtubules.[1] Fluorine also represents a convenient handle on which to pin such measurements in some of the most interesting classes of organic compounds: it is a natural reporter in many drugs and polymers, and can be site-specifically introduced biosynthetically into proteins[2] and chemically into DNA.[3]
However, to measure long distances the REDOR pulse sequence (Figure 1) requires long evolution times and many pi pulses. Consequently it can be compromised by small missets of the pi pulse tip angle, which may result from B1 field inhomogeneity, instrumental drift, or miscalibration. This issue has long been recognized, and modifications to the pulse program have been proposed that make it more robust.[4–6] Ideally the pi pulses should be calibrated as precisely as possible, and then the REDOR performance should be validated in a control experiment on a standard compound. A suitable compound should have three characteristics. First, it should have a 13C-19F spin pair with known dipolar coupling. Second, the dipolar coupling should be weak so that the observed 13C spin dephases slowly enough that the same number of pi pulses are used in the control and the experiment; this ensures that pi pulse errors contribute equally to both. Third, the spin pair should be sufficiently isolated that it behaves as a two-spin system; this allows the REDOR curve to be fit to an analytical expression, giving a quantitative measure of the recoupling performance. The latter can be difficult to achieve in the case of fluorine. For other pairs of isotopes, this is routinely achieved by preparing an isotopically labeled molecule and diluting it in unlabeled material (e.g, 13C, 15N glycine in unlabeled glycine for carbon-nitrogen REDOR). However, because 19F is the only stable isotope of fluorine, simple self-dilution is not an option.
Figure 1.

The REDOR pulse sequence. The number of rotor cycles of dipolar dephasing, n, can exceed 64 for long distance measurements, making it critical to determine whether cumulative pulse imperfections compromise the accuracy of such measurements.
Instead, we turned to the tools of supramolecular chemistry to produce large molecular complexes with well-separated 19F nuclei. Calixarenes are well-studied macrocyclic compounds with central cavities known to be useful for incorporating smaller molecules; they have been investigated as potential sensors[7] and controlled chemical-release agents.[8] Here we make use, instead, of their substantial bulk and their tendency to form predictably structured, well-ordered crystals. We used tert-butylcalix[4]arene to encapsulate and separate smaller, fluorine-containing molecules with moderately long 19F-13C distances. The resulting complex is shown to be useful for optimization of REDOR experimental parameters and for testing the accuracy of long distance measurements
Results
Structure and dynamics of fluorotoluene:calixarene inclusion compound
tert-butylcalix[4]arene was incubated in a 70 °C water bath with excess 4-fluorotoluene and cooled to give crystals of the compound of interest. These materials are commercially available and inexpensive, and so the standard compound is readily accessible to laboratories without expertise in synthetic chemistry. The structure was solved by X-ray diffraction and is shown in Figure 2. The calixarene host forms an extended molecular framework with regularly spaced cavities (Figure 2B). The fluorotoluene guest inserts into these cavities, with the methyl peak pointing back toward the body of the host and the fluorine pointing away. This orientation is confirmed by the 13C NMR spectrum: the guest methyl peak appears ~5ppm upfield from its chemical shift in solution, due to its interaction with the ring currents of the host aromatic rings. This confirms a prediction about the structure that we made based on previous studies. Brouwer et al. studied the inclusion compound of tbuty-calix[4]arene with toluene and found that the guest inserted primarily with the methyl peak pointed toward the host, but that 10% inserted in the opposite direction.[9] A similar tendency in the fluorotoluene compound would have introduced heterogeneity into the system, and complicated interpretations of the data. However, Enright et al. investigated the properties of inclusion compounds with fluorine-substituted benzenes, and found that fluorine atoms display a strong preference to point out of the calixarene cavity.[10] Based on this, we predicted (correctly) that including a fluorine atom para to the methyl group would drive the toluene to insert wholly in the preferred direction.
Figure 2.

The host-guest inclusion compound. Guest 4-fluorotoluene carbons green, host tert-butylcalix[4]arene carbons black, oxygen red, fluorine cyan. (A) A single host-guest pair. Arrows indicate the dynamics as extracted from NMR (see text). The star indicates the most useful carbon atom for calibration of long-distance REDOR (see Fig.3). (B) Orthoscopic view of packing interaction within the crystal. Alternating rows are displaced slightly within the plane of the page. (The reader is referred to the web version of this article for interpretation of the references to color in this figure legend).
The fluorotoluene guest does display some disorder: the crystal structure shows it occupying four different positions, rotated by 90° about the 4-fold axis, and it has substantially larger temperature factors than most of the host. Previous studies of the inclusion compound with (deuterated, non-fluorinated) toluene found a similar disorder, which is dynamic rather than static and consists of two different types of motions: rapid rotation of the guest molecule around its own axis of symmetry, and the reorientation of that symmetry axis within the cone-shaped cavity of the host.[9, 11]
The disorder in the fluorotoluene compound reported here is also dynamic, as demonstrated by a 19F chemical shift anisotropy that is much smaller (anisotropy = 6.4 ppm) and more symmetric (η = 0) than expected for a static aromatic fluorine. Using static CSA parameters determined [12] for a similar compound (parafluorophenylalanine, anisotropy = 75 ppm, η = .67), we can quantitatively model the motion of the guest. According to Hiyama et al.,[12] the chemical shift parameters for 4-fluorophenylalanine are δ11 = 75 ppm, δ22 = 0 ppm, and δ33 = −50 ppm, with δ22 oriented along the C-F bond, δ33 perpendicular to plane of the aromatic ring, and δ11 perpendicular to the other components. We assume these values and orientations are a suitable model of the static 19F CSA for the 4-fluorotoluene guest in our inclusion compound. Rapid rotation around the C-F bond axis would average δ11 and δ33, leading to a new, axially symmetric CSA pattern where δ11 = δ22 = 12.5 ppm and δ33 = 0 ppm, with δ33 oriented along the C-F bond and δ11 and δ22 perpendicular. Expressed relative to the new isotropic shift, these values are δ11 = δ22 = 4.167 ppm and δ33 = −8.33. The measured CSA components for the inclusion compound are 74% of these values predicted for rotational averaging of the fluorophenylalanine ring, suggesting the fluorotoluene undergoes an additional motion that further reduces the CSA. For a second rank tensor such as the CSA, isotropic motion within a cone with a half angle of θ scales all of the components by a factor of (1 − cos3 θ)/[2 * (1 − cos θ)] − 1/2.[13] A cone with a half angle 35° provides a scaling factor of 74%. Therefore, the motionally averaged 19F CSA of the fluorotoluene guest in the inclusion compound can be accounted for by rapid rotation around the guest molecule’s internal axis of symmetry, along with the reorientation of that axis in a cone with a half-angle of 35°.
The motional model in which the fluorotoluene guest rapidly reorients around its axis of symmetry, and this axis itself reorients within the host cavity to sweep out a cone with a half-angle of 35°, is similar to that proposed for related inclusion complexes in previous studies. The corresponding angle in the toluene inclusion compound was found to be 8° or 11°, by NMR;[9, 11] the angle in the monofluorobenzene inclusion compound was suggested to be 78°, by X-ray diffraction.[10] The fact that the angle for fluorotoluene is between that for toluene and fluorobenzene likely reflects competing effects of sterics and electrostatics associated with the methyl and fluoro substituents. The methyl group introduces steric bulk, which limits the mobile range of the guest. The electron-withdrawing nature of the fluorine atom, on the other hand, should favor tilting of the guest to allow interactions between the electron-deficient guest ring and the electron-rich host rings.
Although alternate models of the motion can account for the reduced CSA, this does not affect the primary goal of this study: modeling the REDOR dephasing of the isolated two-spin 13C-19F spin pair (Figure 3). The off-axis motions needed to further scale the rotationally averaged CSA by 74% would similarly scale the dipolar couplings of 13C-19F pairs on the guest axis of symmetry by the same factor. The scaling factors for couplings to fluorines on neighboring molecules will be somewhat different in other motional models, affecting 13C-19F spin pairs that are not fully spin-dilute (Figures 4–5), but in our experience the dephasing curves for most sites do not depend strongly on the exact magnitude of the scaling of these couplings.
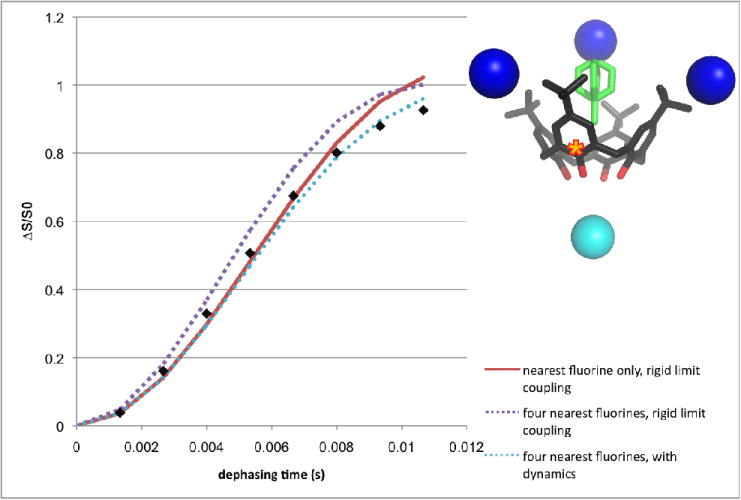
Figure 3.

REDOR data for the guest para aromatic 13C atom marked with a star (inset). The nearest (4.08 Å) fluorine is shown as a cyan sphere; the next nearest (9.16 Å) fluorines, from neighboring guest molecules, are blue spheres. REDOR pulse sequence shown in Figure 1 was used, but with pi pulses shifted from 0.5Tr to 0.15 Tr (rotor period) and up to 64 rotor cycles. (The reader is referred to the web version of this article for interpretation of the references to color in this figure legend).
Figure 4.

REDOR data for the guest methyl carbon marked with a star (inset). The nearest (5.59 Å) fluorine is shown as a cyan sphere; the next nearest (7.80 Å) fluorine is shown as a blue sphere. The “unshifted” REDOR pulse sequence shown in Figure 1 was used, with pi pulses at 0.5Tr (rotor period) and up to 64 rotor cycles. (The reader is referred to the web version of this article for interpretation of the references to color in this figure legend).
Figure 5.
REDOR data for the host hydroxide-bound carbon marked with a star (inset). The nearest (5.86 Å) fluorine (on a guest below the calixarene) is shown as a cyan sphere; the next nearest neighboring fluorines (at 7.96, 8.57, and 9.68 A) are shown as blue spheres. The “unshifted” REDOR pulse sequence was used with up to 64 rotor cycles. (The reader is referred to the web version of this article for interpretation of the references to color in this figure legend).
13C {19F} REDOR of fluorotoluene:calixarene demonstrates accurate measurement of weak dipolar couplings
With the crystal structure showing the average position of the atoms, and a working knowledge of the dynamics in the compound, multi-spin REDOR curves can be simulated for different carbon atoms in the compound. The experimentally obtained REDOR data agree very well with simulated curves that include a 33° cone motion for several sites, indicating that the guest dynamics are adequately captured by the model derived from the 19F CSA. We attribute the slight discrepancy in the cone half-angle (33° for REDOR vs 35° for CSA) to fluorophenylalanine being an imperfect model of the static 19F CSA parameters for this compound.
The site with the weakest 13C-19F dipolar coupling that behaves as a simple two-spin system is the guest aromatic carbon para to the fluorine, marked with a star in Figure 2A, as demonstrated by the equivalence of predicted curves in Figure 3 for dephasing due to a single fluorine vs the 5 nearest fluorines. The dipolar coupling between this carbon and the fluorine in the same molecule is 323 Hz (417 Hz, scaled to 77% by the motional averaging of the guest). As stated, the scaling of the CSA by the off-axis motion predicts an equivalent scaling of this two-spin dipolar coupling, regardless of the nature of the off-axis motion. The REDOR data shown in Figure 3 are obtained using a “shifted” version of the REDOR pulse program (the pi pulses are shifted away from the center of the rotor period) that recouples only a fraction of the dipolar coupling, which allows longer evolution times and so more pi pulses.[5] The data are in excellent agreement with the predicted dephasing curve for up to 64 rotor periods of dephasing (128 pi pulses). This dephasing curve is equivalent to that expected for a 100 Hz coupling or 6.6 Å distance. Use of a more pronounced shift or higher spinning speed can likely extend this out to 128 rotor cycles, as needed to test accuracy of even longer distance measurements.
This analysis is further supported by the fact that the same motional model also accounts for REDOR dephasing of other carbon sites in this complex. The guest methyl position (marked with a star in Figure 4) was analyzed using data acquired with the unshifted REDOR experiment. The nearest fluorine (5.59 Å) is the one colored cyan; the next nearest (7.80 Å) is directly below, colored blue. Inclusion of the “blue” fluorine in a simulated REDOR experiment perturbed the results, indicating the system is not spin dilute. However, simply including the additional fluorine did not accurately model the experimental results until the aforementioned motional model was incorporated in the simulation. Accordingly, the coupling to the cyan fluorine atom was scaled by 77%. To compute a scaling factor for the blue fluorine, we calculated that it would move laterally by up to 3.9 Å (assuming the methyl group of the guest molecule was anchored, and the molecule swept out a cone with a half angle of 33°). This lateral offset, and the crystal-structure derived distance between the star-marked carbon and the blue fluorine, suggested the vector between them occupied a cone with a half-angle of 26°. Accordingly, the coupling to the blue fluorine atom was scaled by 86%. Use of a different motional model might change the magnitude of the 86% scaling, but small changes in the scaling of this weaker coupling should not significantly change the calculated REDOR curve. As seen in Figure 4, this model successfully describes the dephasing of the guest methyl carbon, just as it does the previously discussed carbon para to the fluorine atom.
Additional carbon sites in the inclusion compound become increasingly difficult to model with the same degree of detail, as more spins become relevant and the influence of the compound’s dynamics become more difficult to address. Still, the details are roughly in keeping with the model where the crystal structure reflects the average position of the atoms and the guest molecule moves within a 33° cone. Consider the case of the host carbon bound to the hydroxide group (Figure 5). REDOR simulations based on the crystal structure show that the system is not spin dilute. The simulation with only the nearest fluorine (cyan, 5.86 Å) considered differs from that where sequentially more of the next-nearest neighbors (blue, 7.96, 8.57 and 9.68 Å) are included; the curve for the five spin rigid-limit spin system is shown. However, when the strongest of these couplings (to the cyan-colored fluorine) is attenuated by a geometrically-derived factor similar to that discussed for the guest methyl peak, the resulting simulation agrees well with the experimental data. A more complicated model (for example, with scaling factors for the additional fluorine couplings) was not considered, as the demonstrated lack of spin-diluteness precludes use of the site as an effective REDOR standard.
Fluorotoluene:calixarene enables rapid calibration of fluorine pi pulses
The fluorotoluene calixarene inclusion compound is useful not only for evaluating the performance of a REDOR experiment with a certain number of pi pulses, but also for quickly and easily calibrating the pi pulses to be used. Narrow, high signal-to-noise fluorine spectra of the compound can be acquired without proton decoupling, since the engineered fluorine-diluteness minimizes 19F-19F couplings and the motion of the guest attenuates both the 19F CSA and 1H-19F dipolar couplings. This allows the 19F nutation frequency at a given RF power level to be determined in a fluorine-observe experiment. The pi pulse duration can then be fine tuned using a REDOR experiment, by choosing the pulse length that gives maximum dephasing. As described above, the more pi pulses used, the more sensitive this experiment is to slight errors in the pulse length. The number of pulses that can be used is maximized by both a weak 13C-19F dipolar coupling (to minimize signal loss to dephasing) and a long T2* of the 13C atom being observed (to minimize signal loss to relaxation during the REDOR evolution time). The methyl groups of the calixarene host have a very long T2* (114 ms), most likely due to dynamics as reported for similar inclusion compounds.[9] They are also coupled fairly weakly to the guest fluorine, due to the distance between them and the dynamic nature of both the guest and the host. As a result, many rotor cycles of dephasing can be used in the pi pulse calibration experiment, rendering it sensitive to small tip angle missets, without greatly reducing the sensitivity of the experiment. Combined with the fact that this is the highest-signal peak in the NMR spectrum (there are 12 equivalent atoms per host/guest pair), this means the pulse length can be calibrated quickly. Figure 6 shows the results of such a calibration experiment: the percent dephasing of the host methyl peak is plotted as a function of the duration of the 19F pi pulse. This data shows a clear maximum and was collected with only 32 scans per S/S0 pair on a 300 MHz instrument; the entire experiment was completed in 15 minutes.
Figure 6.

Percent dephasing of the host methyl peak as a function of the 19F pulse duration. Sixty-four rotor periods of dephasing were used, with a “shift” of 0.16.
Conclusion
We have characterized the structure and dynamics of the 1:1 inclusion complex of 4-fluorotoluene and tert-butylcalix[4]arene and demonstrated its utility for optimization and calibration of REDOR measurements of long 13C to 19F distances. This inexpensive, easily synthesized supramolecular complex makes it possible to test spectrometer performance for distance measurements using as many as 128 or more pi pulses. This is a substantial improvement on a standard previously used in our lab and others, fluoropolycarbonate.[5] The strong dipolar couplings in fluoropolycarbonate (fluorine to resolved carbon distance of 2.4 Å and no significant dynamics) mean that, even with a “shifted,” attenuated REDOR experiment, only 48 pi pulses of dephasing can be applied before the observable signal has completely decayed. The new inclusion compound makes it possible to test REDOR performance under the many-pulse conditions used to measure very long distances.
The agreement of both 19F anisotropy measurements and REDOR distances with the motional model of the calixarene suggests that REDOR variations to compensate for imperfect pulses, such as using multiple refocusing pulses, additional phase cycling, or composite pulses,[4, 5] are not necessary under our experimental conditions. However, one limitation of the inclusion compound is that the guest dynamics average the CSAs of both the fluorine and carbon atoms. Thus this compound cannot be used to test for possible REDOR errors due to large chemical shift anisotropies; this is one source of error that might be removed by the REDOR pulse sequence variations mentioned above. We sought to address this issue by lowering the temperature of the calixarene compound, with the hope of freezing out any motion. However, at the lowest temperatures we could achieve with our instrument (−50 °C), we saw only a modest increase in the 19F CSA, indicating that the compound retained substantial dynamics. Alternately, it may be possible to design an inclusion complex with another fluorinated small-molecule guest, which has restricted motion, for testing REDOR performance at many rotor cycles in the face of large CSAs. Validating the accuracy of long-distance REDOR measurements is critical to applications which to date have included determining the structure of polymeric nanoparticles loaded with small molecules,[14] an important cancer drug bound to tubulin, [1] and receptor-receptor distances in bacterial signaling complexes[15]; the work presented here paves the way for even more applications in the future.
Experimental
Compound preparation
4-tert-butylcalix(4)arene and 4-fluorotoluene were purchased from Sigma-Aldrich and used as received. 100 mg of 4-tert-butylcalix(4)arene was placed in a vial with excess (~5 mL) 4-fluorotoluene and incubated overnight in a 70° C water bath. To obtain larger crystals, the vial was repeatedly heated to 70° C and cooled slowly to room temperature. Solid crystals were filtered extensively to remove excess guest/solvent (though the presence of some unincorporated solvent should not adversely affect the NMR experiments if crosspolarization is used). For NMR experiments crystals were ground to a fine powder prior to packing in the rotor.
NMR
All experiments were performed at 25 °C on a Varian Infinity Plus spectrometer operating at 300.1 MHz 1H frequency. Samples were packed in standard rotors with Vespel spacers to allow background-free detection of 19F. A slow-speed spinning (2 kHz) 19F spectrum of the inclusion compound was obtained with 50 kHz proton decoupling (see supplementary information).
13C observed spectra (both CP and REDOR) were acquired at an MAS rate of 6 kHz, as this minimized spectral overlap with spinning sidebands; 1H decoupling was 100 kHz for CP spectra and 85 kHz for REDOR. Chemical shift referencing for 13C was done with an external adamantane standard, with the adamantane CH2 shift taken to be 38.48 ppm relative to tetramethylsilane.[16] Pi pulse widths in REDOR experiments were 10.0 μs for 13C and 6.3 μs for 19F. The REDOR pulse sequence used a single 13C refocusing pulse and XY8 phase cycling of the 19F dephasing pulses.[17] Assignment of the peaks in the 13C spectrum (see supplementary information) is based on previously assigned shifts for 4-fluorotoluene in CDCl3 (Spectral Database for Organic Compounds, http://riodb01.ibase.aist.go.jp/sdbs/cgi-bin/cre_index.cgi?lang=eng) and for the inclusion compound of tert-butylcalix[4]arene with toluene.[9]
The CSA parameters were extracted from spinning sideband intensities by the Herzfeld-Berger method,[18] using the software HBA (HBA ver. 1.4, K. Eichele, R. E. Wasylishen, Dalhousie University, 2001). Principle components were: δ11 = 3.096 ppm, δ22 = 3.096 ppm, δ33= −6.191 ppm. The fits were found to be somewhat dependent on initial conditions, with the “rho” or skew parameter being more sensitive than the “mu” or span.
13C-observed, 19F -dephased REDOR data were obtained for the inclusion compound. Data obtained using the full coupling REDOR sequence (dephasing pulses centered in the rotor cycle at 0.5 Tr) were used in modeling slow-dephasing nuclei (Figures 4–5). For more quickly dephasing sites (Figure 3), a REDOR pulse sequence with dephasing pulses at 0.15Tr was used because it recouples only a fraction of the dipolar coupling, leading to longer dephasing times.[5] REDOR curves were checked for spin diluteness (and hence ready fitting by an analytical expression) and for conformance to the model of dynamics extracted from the 19F CSA. All models were generated using the SIMPSON/SIMMOL NMR simulation package.[19, 20]
Supplementary Material
Acknowledgments
We thank A. Chandrasekaran and Weiguo Hu for helpful discussions, and Bob Herbst for work on an initial crystal structure. The X-ray Structural Characterization Lab in the UMass Department of Chemistry is supported by the University of Massachusetts and the National Science Foundation (grant CHE-9974648). This research was supported by U.S. Public Health Service Grant GM47601. DJF was partially supported by National Research Service Award T32 GM08515 from the National Institutes of Health.
Footnotes
Supporting Information Available: X-ray crystallography experimental details, crystallographic information file, 13C resonance assignments, and 19F slow MAS spectrum.
Publisher's Disclaimer: This is a PDF file of an unedited manuscript that has been accepted for publication. As a service to our customers we are providing this early version of the manuscript. The manuscript will undergo copyediting, typesetting, and review of the resulting proof before it is published in its final citable form. Please note that during the production process errors may be discovered which could affect the content, and all legal disclaimers that apply to the journal pertain.
References
- 1.Paik Y, Yang C, Metaferia B, Tang S, Bane S, Ravindra R, Shanker N, Alcaraz AA, Johnson SA, Schaefer J, O’Connor RD, Cegelski L, Snyder JP, Kingston DG. Rotational-echo double-resonance NMR distance measurements for the tubulin-bound Paclitaxel conformation. J Am Chem Soc. 2007;129:361–370. doi: 10.1021/ja0656604. [DOI] [PMC free article] [PubMed] [Google Scholar]
- 2.Durr UH, Grage SL, Witter R, Ulrich AS. Solid state 19F NMR parameters of fluorine-labeled amino acids. Part I: aromatic substituents. J Magn Reson. 2008;191:7–15. doi: 10.1016/j.jmr.2007.11.017. [DOI] [PubMed] [Google Scholar]
- 3.Lai JS, Qu J, Kool ET. Fluorinated DNA bases as probes of electrostatic effects in DNA base stacking. Angew Chem Int Ed Engl. 2003;42:5973–5977. doi: 10.1002/anie.200352531. [DOI] [PubMed] [Google Scholar]
- 4.Sinha N, Schmidt-Rohr K, Hong M. Compensation for pulse imperfections in rotational-echo double-resonance NMR by composite pulses and EXORCYCLE. J Magn Reson. 2004;168:358–365. doi: 10.1016/j.jmr.2004.03.025. [DOI] [PubMed] [Google Scholar]
- 5.Weldeghiorghis TK, Schaefer J. Compensating for pulse imperfections in REDOR. J Magn Reson. 2003;165:230–236. doi: 10.1016/j.jmr.2003.08.005. [DOI] [PubMed] [Google Scholar]
- 6.Hing AW, Tjandra N, Cottam PF, Schaefer J, Ho C. An investigation of the ligand-binding site of the glutamine-binding protein of Escherichia coli using rotational-echo double-resonance NMR. Biochemistry. 1994;33:8651–8661. doi: 10.1021/bi00195a005. [DOI] [PubMed] [Google Scholar]
- 7.Ohira S, Wanigasekara E, Rudkevich DM, Dasgupta PK. Sensing parts per million levels of gaseous NO2 by a optical fiber transducer based on calix[4]arenes. Talanta. 2009;77:1814–1820. doi: 10.1016/j.talanta.2008.10.024. [DOI] [PubMed] [Google Scholar]
- 8.Nau WM, Ghale G, Hennig A, Bakirci H, Bailey DM. Substrate-selective supramolecular tandem assays: monitoring enzyme inhibition of arginase and diamine oxidase by fluorescent dye displacement from calixarene and cucurbituril macrocycles. J Am Chem Soc. 2009;131:11558–11570. doi: 10.1021/ja904165c. [DOI] [PubMed] [Google Scholar]
- 9.Brouwer EB, Enright GD, Ratcliffe CI, Ripmeester JA. Dynamic molecular recognition in solids: A synoptic approach to structure determination in p-tert-butylcalix[4]arene-toluene. Supramolecular Chemistry. 1996;7:79–83. [Google Scholar]
- 10.Enright GD, Udachin KA, Ripmeester JA. Electrostatic and short-range interactions compete in directing the structure of p-tert-butylcalix[4]arene inclusion compounds of fluorinated benzenes. Chem Commun (Camb) 2004:1360–1361. doi: 10.1039/b401269k. [DOI] [PubMed] [Google Scholar]
- 11.Facey GA, Dubois RH, Zakrzewski M, Ratcliffe CI, Atwood JL, Ripmeester JA. Phase Transition and Dynamic Structure in the Toluene Clathrate of t-butylcalix[4]arene. Supramolecular Chemistry. 1993;1:199–200. [Google Scholar]
- 12.Hiyama Y, Silverton J, Torchia DA, Gerig JT, Hammond SJ. Molecular Structure and Dynamics of Crystalline p-Fluoro-D,L-phenylalanine. A Combined X-ray/NMR Investigation. Journal of the American Chemical Society. 1986;108:2715–2723. [Google Scholar]
- 13.Goetz JM, Schaefer J. REDOR dephasing by multiple spins in the presence of molecular motion. J Magn Reson. 1997;127:147–154. doi: 10.1006/jmre.1997.1198. [DOI] [PubMed] [Google Scholar]
- 14.Baugher AH, Goetz JM, McDowell LM, Huang H, Wooley KL, Schaefer J. Location of fluorotryptophan sequestered in an amphiphilic nanoparticle by rotational-echo double-resonance NMR. Biophys J. 1998;75:2574–2576. doi: 10.1016/S0006-3495(98)77702-1. [DOI] [PMC free article] [PubMed] [Google Scholar]
- 15.Fowler DJ, Weis RM, Thompson LK. Kinase-active signaling complexes of bacterial chemoreceptors do not contain proposed receptor-receptor contacts observed in crystal structures. Biochemistry. 2010;49:1425–1434. doi: 10.1021/bi901565k. [DOI] [PMC free article] [PubMed] [Google Scholar]
- 16.Morcombe CR, Zilm KW. Chemical shift referencing in MAS solid state NMR. J Magn Reson. 2003;162:479–486. doi: 10.1016/s1090-7807(03)00082-x. [DOI] [PubMed] [Google Scholar]
- 17.Gullion T, Schaefer J. Elimination of Resonance Offset Effects in Rotational-Echo, Double-Resonance Nmr. Journal of Magnetic Resonance. 1991;92:439–442. [Google Scholar]
- 18.Herzfeld J, Berger AE. Sideband Intensities in NMR-Spectra of Samples Spinning at the Magic Angle. Journal of Chemical Physics. 1980;73:6021–6030. [Google Scholar]
- 19.Bak M, Rasmussen JT, Nielsen NC. SIMPSON: a general simulation program for solid-state NMR spectroscopy. J Magn Reson. 2000;147:296–330. doi: 10.1006/jmre.2000.2179. [DOI] [PubMed] [Google Scholar]
- 20.Bak M, Schultz R, Vosegaard T, Nielsen NC. Specification and visualization of anisotropic interaction tensors in polypeptides and numerical simulations in biological solid-state NMR. J Magn Reson. 2002;154:28–45. doi: 10.1006/jmre.2001.2454. [DOI] [PubMed] [Google Scholar]
Associated Data
This section collects any data citations, data availability statements, or supplementary materials included in this article.