Abstract
The purpose of this study was to investigate the sources of ATP in the 1A arteriole, and to investigate age-related changes in ATP overflow. Arterioles (1A) from the red portion of the gastrocnemius muscle were isolated, cannulated and pressurized in a microvessel chamber with field stimulation electrodes. ATP overflow was determined using probes specific for ATP and null probes that were constructed similar to the ATP probes, but did not contain the enzyme coating. ATP concentrations were determined using a normal curve (0.78 to 25 μmol l−1 ATP). ATP overflow occurred in two phases. Phase one began in the first 20 s following stimulation and phase two started 35 s after field stimulation. Tetrodotoxin, a potent neurotoxin that blocks action potential generation in nerves, abolished both phases of ATP overflow. α1-Receptor blockade resulted in a small decrease in ATP overflow in phase two, but endothelial removal resulted in an increase in ATP overflow. ATP overflow was lowest in 6-month-old rats and highest in 12- and 2-month-old rats (P < 0.05). ATP overflow measured via biosensors was of neural origin with a small contribution from the vascular smooth muscle. The endothelium seems to play an important role in attenuating ATP overflow in 1A arterioles.
Introduction
Adenosine triphosphate (ATP) plays numerous functions in the body including fueling muscle contraction, acting as a signalling molecule (Burnstock, 2002a,b), modulating neurotransmitter release (Gourine et al. 2005, 2008), and acting as a sympathetic neurotransmitter released with noradrenaline (Burnstock & Kennedy, 1986; Msghina et al. 1992; Bao et al. 1993; Bao & Stjarne, 1993; Burnstock, 1999a,b;). More recently, other sources of ATP release have been discovered including the endothelium of the vasculature (Sedaa et al. 1990; Shinozuka et al. 1994), red blood cells, platelets (Sprague et al. 1996, 2003) and smooth muscle (Vizi & Burnstock, 1988; Vizi et al. 1992).
ATP plays an important role in vascular function and can cause both vasoconstriction and vasodilatation via activation of purinergic 2X and 2Y receptors on the vascular smooth muscle (Ralevic & Burnstock, 1998; Buckwalter et al. 2003, 2004) and the endothelial layer of the vasculature (Burnstock, 1999c, 2008; Mortensen et al. 2009a,b;), respectively. In the skeletal muscle vasculature, ATP plays an important role in maintaining resting vascular tone and controlling blood flow to working skeletal muscle during exercise (Buckwalter et al. 2004; Mortensen et al. 2009b). The involvement of ATP in blood flow control in the skeletal muscle has been previously studied in vivo (Johnson et al. 2001; Buckwalter et al. 2003, 2004; Mortensen et al. 2009a,b;); however, it is difficult to determine the sources of ATP in a whole animal or human since ATP in blood can come from surrounding skeletal muscle tissue, red blood cells and platelets.
New technology for ATP measurement has recently been developed for measuring ATP overflow in vitro and in situ and has uncovered some interesting new knowledge regarding the role of ATP as a neuromodulator in the CNS (Gourine et al. 2003, 2008) and in the perception of taste (Finger et al. 2005; Gourine et al. 2005; Llaudet et al. 2005). These biosensors are specific to ATP and are not sensitive to ADP, AMP or any other purine or pyrimidine (for a review on microelectrode biosensors see Dale et al. 2005; Llaudet et al. 2005). In addition, this technology employs real-time measurements of ATP overflow and can be used accurately in temperatures from 25°C to 41°C and pH from 6.5 to 8 (Llaudet et al. 2005).
Although this technology has never been used in vascular tissue, it is ideal for determining the sources of ATP in an isolated artery or arteriole. For the purpose of this study, we have chosen to investigate the sources of ATP in the first-order resistance arteriole in the gastrocnemius red muscle. Previous studies investigating ATP sources have been limited to conduit arteries and the vas deferens (Vizi & Burnstock, 1988; Sedaa et al. 1990; Sperlagh & Vizi, 1992; Vizi et al. 1992; Hashimoto et al. 1995; Todorov et al. 1996, 1997; Mihaylova-Todorova et al. 2001; Westfall et al. 2002). Since resistance arterioles are the primary controllers of blood flow to the skeletal muscle, there is considerable physiological significance in investigating ATP sources in these vessels.
In this study, only the sources of ATP from the adventitia, smooth muscle and endothelium will be investigated. The release of ATP from red blood cells and platelets will not be investigated because they require shear stress, hypoxia or compression to release ATP (Sprague et al. 2003; Cao et al. 2009), and in this preparation it is difficult to create many of those stresses without affecting the release of ATP from the vascular wall. Better understanding of the sources of ATP will allow us to further assess the role that ATP plays in the vasculature and will allow us to better recognise the physiological significance of changes in ATP release.
A secondary purpose of this study was to investigate potential changes in ATP overflow from young adulthood to middle age in the 1A arterioles. Previous research in the caudal artery suggests that ATP release (Hashimoto et al. 1995) and purinergic receptor protein expression (Wallace et al. 2006) is high during development and growth, but declines with advancing age. Since ATP receptors activate mitogenic pathways in vascular smooth muscle and endothelium (Erlinge, 1998; Burnstock, 2002b; Gerasimovskaya et al. 2002), it is important to understand how ATP overflow changes with ageing.
The purpose of this study was to develop the use of ATP biosensors for use in isolated arterioles, to determine the sources of ATP in the skeletal muscle 1A arteriole, and to evaluate age-related changes in ATP overflow. The hypotheses are: (1) the sources of ATP release will originate primarily from the sympathetic nerve, but will also come from the smooth muscle and the endothelium; and (2) ageing will result in a decrease in ATP release.
Methods
Animals and general procedures
Experimental procedures described below were approved by the Institutional Animal Care and Use Committees of the University of Arkansas. After induction of anaesthesia with pentobarbital sodium (i.p., 40 mg kg−1), the 1A arterioles from the red gastrocnemius muscle of F344 rats were isolated and placed in a refrigerated vessel chamber containing cold (4°C) Krebs–Ringer physiological saline solution (119 mmol l−1 NaCl, 4.7 mmol l−1 KCl, 2.5 mmol l−1 CaCl2, 1.2 mmol l−1 MgSO4, 25 mmol l−1 NaHCO3, 1.2 mmol l−1 KH2PO4, 5.5 mmol l−1 glucose) (Pourageaud & De Mey, 1998). In addition, 2 mmol l−1 of glycerol was added to optimize detection of ATP (Gourine et al. 2008). Using 11-0 opthalmic suture, the arterioles were tied securely to micropipettes in a vessel chamber (Living Systems, Inc., Burlington, VT, USA) and filled with Krebs-Ringer physiological saline solution containing 1% albumin (pH 7.4, 37°C) (Pourageaud & De Mey, 1998). The bath was filled with Krebs–Ringer physiological saline solution (pH 7.4, 37°C, bubbled with 5% CO2–30% O2) and transferred to the stage of an inverted microscope (Olympus CKX41, Melville, NY, USA).
Luminal diameter was monitored during equilibration and viability testing (described below) using video calipers (Colorado video 307A Horizontal video calipers, Boulder, CO, USA) interfaced with a MicroC potentiostat (World Precision Instruments, Sarasota, FL, USA) and a Powerlab 16/30 (ADInstruments, Colorado Spring, CO, USA). The bath was gradually warmed and maintained at 37°C for the equilibration period. Micropipettes were connected to independent reservoir systems. Luminal pressure was initially set at 60 cmH2O by elevating both reservoirs to the same level. Thirty minutes later it was raised to 90 cmH2O, which is a pressure similar to normal in vivo pressure in 1A arterioles (Williams & Segal, 1993). The bath solution was replaced every 15 min during equilibration. Arterioles were considered viable if they constricted to phenylephrine (10−5 mol l−1) administration by at least 10% and dilated by at least 20% to 10−6 mol l−1 acetylcholine (Schneider et al. 1994). When called for in the protocol, the endothelium was removed by untying one end of the vessel and slowly blowing 12 ml of air through the vessel. The vessel was then re-perfused with the 1% albumin solution and re-cannulated. After 1 h of acclimation, described above, the vessel was tested for viability and endothelium removal by at least 10% constriction to phenylephrine (10−5 mol l−1), less than 20% dilatation to acetylcholine (10−5 mol l−1), and at least 20% dilatation to sodium nitroprusside (10−5 mol l−1) (Clifford et al. 2006).
Real-time ATP measurements
In order to make room for the micromanipulators, the chamber was moved from the inverted microscope to a dissecting microscope. ATP probes (interfaced with a MicroC potentiostat (World Precision Instruments) and a Powerlab 16/30 (ADInstruments) were positioned with a micromanipulator (World Precision Instruments) such that the tip of the probe (Sarissa Biomedical Ltd, Coventry, UK; 0.5 mm tip length, 50 μm diameter) touched the arteriole (see Fig. 1 for a diagram of the set-up). To account for compounds that may interfere with the ATP signal (Gourine et al. 2005; Llaudet et al. 2005), a null electrode (no enzyme coating) was placed in a biologically similar location to the ATP electrode. Increasing concentrations of ATP (0.78 to 25 μmol l−1; Sigma-Aldrich, St Louis, MO, USA) were added to create a normal curve that was used to convert picoamps (pA) to micromoles per litre (μmol l−1) ATP. The normal curve was repeated at the end of the experiment.
Figure 1. The vessel chamber.
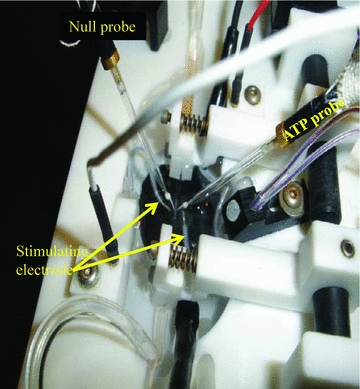
Diagram of the vessel chamber showing the cannulated 1A arteriole and the positioning of the ATP probe, the null probe and the stimulating electrodes.
Determining amperage and frequency for field stimulation
Initial experiments involved determining the optimal amperage and frequency for ATP measurements. Field stimulation was delivered via two parallel platinum electrodes placed on either side of the vessel (see Fig. 1). The electrical current was supplied using the DS3 isolated constant current stimulator (Digitimer Ltd, Letchworth Garden City, UK) interfaced with a Powerlab 16/30 with Chart software (version 5.2; ADInstruments) to control the frequency, pulse duration and impulse number.
In two 6-month-old rats, arterioles were stimulated at 60 Hz using 9 mA, 20 mA, 30 mA and 32 mA. In a set of eight arterioles, frequencies of 2 Hz, 10 Hz, 20 Hz and 60 Hz (at 32 mA) were used to determine the best frequency for ATP detection.
Sources of ATP
In two 6-month-old rats, the vessels were stimulated at 60 Hz, 32 mA and 200 impulses. An impulse set of 200 was chosen because it produced measurable and consistent changes in vessel diameter (see Fig. 2). Shorter impulse numbers produced such quick vessel responses that the constriction was not measurable. Then, the vehicle (citrate buffer, 100 mmol l−1, pH 4.0) was added and the arteriole was stimulated again. After repeated washing over 15 min, tetrodotoxin (1 μmol l−1) was added and allowed to equilibrate for 20 min. Following the equilibration period, the arterioles were stimulated again. ATP was recorded continuously during baseline, addition of chemicals, and for 60 s following field stimulation.
Figure 2. Representative data from one arteriole show the vessel diameter changes with 60 Hz, 200 impulses, 32 mA field stimulation repeated five times.
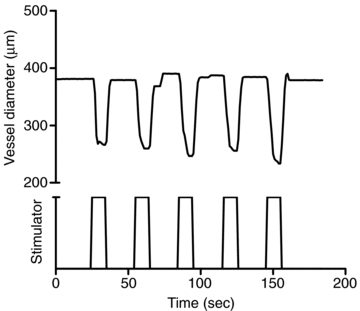
The vessel diameter changes were consistent and measurable during field stimulation.
In two arterioles from 6-month-old rats, the endothelium was removed (as described above) and the vessels were stimulated at 60 Hz, 32 mA and 200 impulses. The α1-antagonist prazosin (1.4 μmol l−1) was added and 20 min later the arteriole was field stimulated again.
Age-related changes in ATP overflow
Arterioles from seven 2-month-old female rats, four 6 month-old female rats and five 12-month-old female rats were stimulated at 60 Hz, 32 mA and 200 impulses, and data were recorded for 60 s following stimulation. The ages of the rats correspond to a young adult still in the growth phase (2 months old), an adult animal (6 months old), and a middle aged animal (12 months old, 90%+ survival). The 50% population survival age point for female Fisher 344 rats is 26 months (Turturro et al. 1999).
Data analysis
All data were reported as the mean ± standard deviation. The integral for each 5 s period of recording was calculated using Chart (Gourine et al. 2005; Llaudet et al. 2005). For the normal curve, the average picoamp response for the null and ATP probe for each concentration of ATP was averaged for the curve at the beginning and end of the experiment. The difference between the ATP and null probe was determined, and the results from the first and second normal curve were averaged. From these data, the slope and intercept were calculated using a linear curve fit in Excel (Microsoft).
For all of the data, baseline, treatment (i.e. TTX, prazosin, etc.) and post treatment (60 s from the end of field stimulation) were recorded and the integral for each 5 s of data calculated. The 5 s integral for the null probe was subtracted from the ATP probe (ATP – null) and ATP concentration was calculated by solving for X using the equation Y = mX+b. Some of the data were reported as the sum of the integrals, which is a sum of the integrals from each of the 5 s periods after field stimulation.
A 1-way ANOVA was performed to determine differences between day 1 and day 3 in picoamps produced during the ATP normal curve. A t test was performed to evaluate differences in the ATP overflow (sum of the integrals for the 60 s recording time) with endothelium removal and with prazosin treatment. A 1-way ANOVA was performed to determine differences with ATP overflow with age. A Tukey's post hoc analysis was used when appropriate. A P value of less than 0.05 was required for significance.
Results
Use of ATP probes
Figure 3 is a summary of the difference between the ATP and null probes used for the determination of the slope and intercept of the normal curve. The figure demonstrates that the first day an ATP probe is used results in the highest probe electrical current (pA) response at all concentrations of ATP (n = 4). There is a small loss in sensitivity (reduction in pA change with ATP) over the entire range of the normal curve by day 2. However, at day 2, 0.78 μmol l−1 to 1.56 μmol l−1 of ATP were still detectible. On the third day (day 3) of using the same ATP probe there is a considerable loss of sensitivity of the probe, particularly at the lower ATP concentrations. Differences in probe electrical current (pA) production by day were not statistically significant, but were relevant since the loss of sensitivity was on the lower end of the normal curve and we wished to detect as small an ATP amount as possible. Therefore, we determined that ATP probes can be used with reasonable sensitivity for two consecutive days. In the following procedures, a single ATP probe was used no more than two times on two consecutive days. Null probes do not have a degradable enzyme coating and therefore, can be used until the tips are damaged (approximately 10 experiments per probe).
Figure 3. Summary of data show the lifetime of the ATP probe over repeated usage.
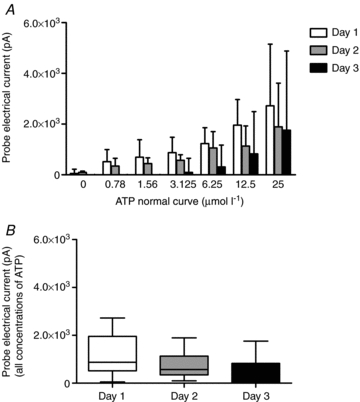
Probe electrical current (pA) response to increasing doses of ATP on the first day of use to the third day of use (A). Probe responsiveness was well-maintained over 2 days of use, but began to lose sensitivity at the lower concentrations of ATP by day 3 (P > 0.05). Overall responsiveness (B) of the ATP probe declined by the third day of use.
Determining amperage and frequency for field stimulation
Figure 4 is a summary of experiments investigating the optimal amperage (A) and frequency (B) to produce the maximal measurable ATP overflow in 1A arterioles. The data were expressed as the sum of the 5 s integrals for 60 s after stimulation. Figure 4A is a summary of the ATP overflow detected at 9, 20, 30 and 32 mA (n = 2). The most ATP overflow was detected at 32 mA (60 Hz, 200 impulses). Figure 4B demonstrates the effect of frequency on ATP overflow (2–60 Hz, 32 mA, 200 impulses; n = 8). There is relatively little ATP detected at 2, 10 and 20 Hz field stimulation. However, 60 Hz results in considerably larger ATP overflow.
Figure 4. Sum of the integrals over 60 s following field stimulation at different amperages and frequencies of field stimulation.
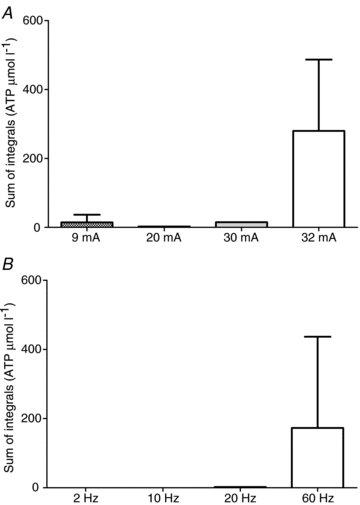
A, sum of the integrals for 60 Hz, 200 impulses at 9 mA to 32 mA constant current field stimulation. Small amounts of ATP were detected at 9 mA to 30 mA, but the best amperage was 32 mA for detection of ATP. B, the sum of the integrals for different frequencies (200 impulses, 32 mA). The best frequency for detection of ATP was 60 Hz.
Sources of ATP
Figure 5 is a summary of ATP responses to 60 Hz field stimulation. Figure 5A is a representative raw data tracing showing the response to the ATP and null probes in a 1A arteriole from one 6-month-old male rat during and following field stimulation. Field stimulation results in interference in the probes that is resolved once the electrical current is stopped. Following this, the ATP probe increases in more quickly than the null probe for the first several seconds, and then the null probe exceeded the values detected via the ATP probe until the last several seconds of recording. Figure 5B is a summary of the results from 1A arterioles from six 6-month-old rats. All of the arterioles had an increase in ATP overflow in the first 20 s following field stimulation. However, only two arterioles showed ATP overflow 35 s or more after field stimulation.
Figure 5. Representative raw data tracing of the ATP and null probe response to 60 Hz field stimulation and 60 s following the stimulation period.
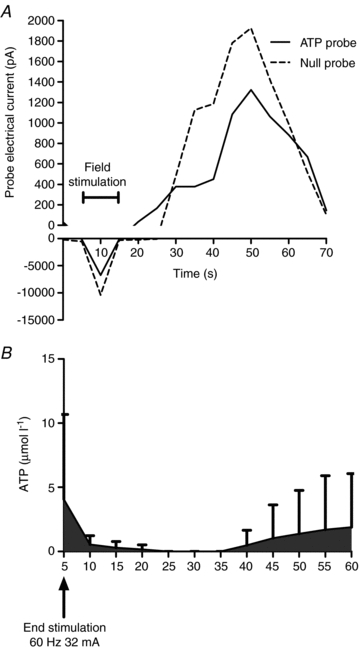
A, active field stimulation resulted in electronic interference with the probes, but immediately following the end of stimulation, there was an increase in the electrical potential detected by the ATP probe. This increase was shortly followed by an increase in the null probe which rapidly exceeded the electrical potential detected by the ATP probe. This was reversed to a small degree in the last 10 s of recording. B, a summary of ATP overflow following field stimulation in gastrocnemius 1A arterioles from 6-month-old male rats (n = 6).
In a separate group of 6-month-old rats (n = 2), a set of experiments were performed to determine if the ATP detected following field stimulation was of neural origin (see Fig. 6). The control experiment (no agonists or antagonists) resulted in a small, early ATP response. After several minutes of washing, 10 μl of citrate buffer (pH 4.0) was added to test for the effect of the vehicle on ATP overflow. The vehicle did not change baseline ATP detection, but following field stimulation it resulted in a large ATP overflow 10 s and continuing to 45 s after stimulation. Tetrodotoxin also did not affect baseline ATP detection, and after field stimulation it resulted in no detected ATP overflow.
Figure 6. Summary of the results from adding tetrodotoxin to determine the neural component of ATP overflow (n = 2, 6-month-old rats).
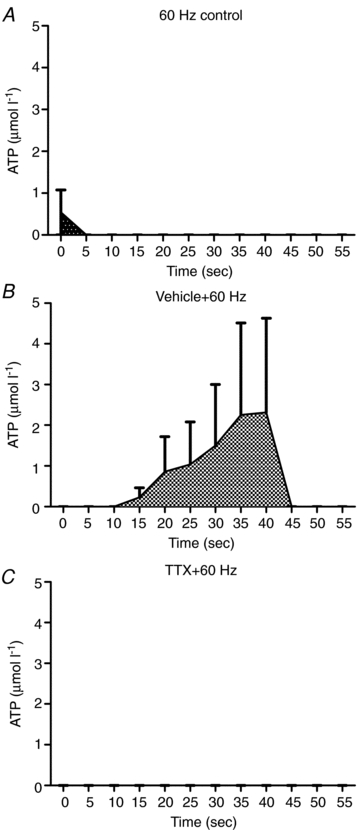
ATP overflow increased briefly following field stimulation with no blocking (A). After the addition of the vehicle (citrate buffer) for tetrodotoxin, ATP overflow increased significantly between 10 and 45 s following field stimulation (B). After the tetrodotoxin was added, no ATP overflow was detected following field stimulation (C).
Figure 7 is a summary of the ATP overflow after field stimulation with the endothelium removed in isolated 1A arterioles from 6-month-old rats. Figure 7A is ATP overflow for each 1A arteriole with endothelium (continuous lines; n = 6) and the dashed lines represent each arteriole with endothelium removed (n = 3). Endothelium removal markedly attenuated ATP overflow in all arterioles tested. In Fig. 7B, the data were expressed as a sum of the integrals for the entire 60 s recording period. Endothelium removal resulted in an increase in ATP overflow following field stimulation compared to intact arterioles (P < 0.05).
Figure 7. Summary of the ATP overflow to field stimulation in endothelium-intact (n = 6) and endothelium-removed (n = 3) arterioles.
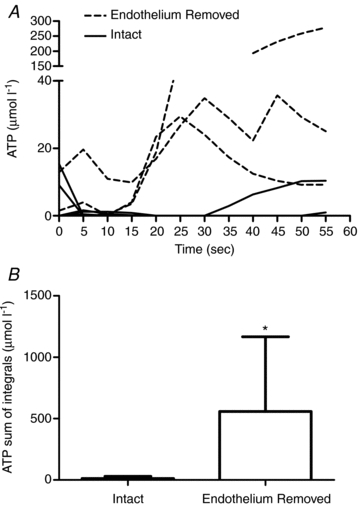
A, ATP overflow for 60 s following field stimulation in each arteriole. The endothelium-removed arterioles are the dashed lines and the endothelium intact arterioles are the continuous lines. B, when the data above were represented as a mean of the sum of the integrals for the 60 s recording period, there was a significant increase in ATP overflow when the endothelium was removed (P < 0.05; * denotes difference from endothelium-intact arterioles).
There is some evidence that ATP overflow detected after 25 s is due to α1-receptor-mediated release of ATP from the vascular smooth muscle (Todorov et al. 1996). This hypothesis was tested by adding a dose of prazosin (1.4 μmol l−1) that prevented vasoconstriction to phenylephrine (10−5 mol l−1) and field stimulation in endothelium-removed arterioles (n = 3). Figure 8 shows the raw data response of the ATP and null probes to the α1-agonist phenylephrine and different doses of prazosin (from 1.4 μmol l−1 to 142.9 μmol l−1). Phenylephrine results in a large increase in picoamps detected by the ATP probe and a smaller increase in the null probe. This is attenuated by 1.4 μmol l−1 of prazosin, but l4.29 μmol l−1 of prazosin seems to potentiate the ATP and null probe response. Extremely large doses of prazosin (142.9 μmol l−1) appear to abolish the null response and attenuate the ATP response. Since it is possible that extremely high doses of an antagonist can result in non-specific effects of the drug, the 1.4 μmol l−1 dose was chosen for the following experiments. Prazosin attenuated the ATP overflow to field stimulation to a small magnitude in two arterioles, but potentiated the response after 35 s in one arteriole (Fig. 9A). However, the mean ATP overflow (Fig. 9B) showed little attenuation by prazosin (P > 0.05).
Figure 8. Representative raw data tracing of the ATP and null probe response to the α1-agonist, phenylephrine, and increasing doses of the α1-antagonist, prazosin.

Phenylephrine caused a large increase in the pA detected by the ATP probe. This response was attenuated by the addition of prazosin at 1.4 μmol l−1 and somewhat attenuated by 14.29 μmol l−1, but high doses of prazosin (142.9 μmol l−1) also attenuated the response of the null probe. Therefore, in subsequent experiments, the dose of prazosin used was 1.4 μmol l−1.
Figure 9. Summary of the results from removing the endothelium and blocking with the α1-antagonist, prazosin (n = 4).
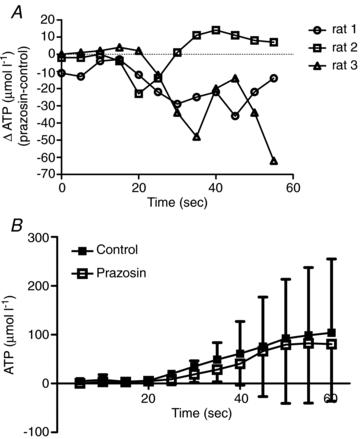
A shows the change in ATP overflow with prazosin from the control condition. Prazosin attenuated ATP overflow in the late phase in 2 out of 3 arterioles studied (P > 0.05). B shows the mean response for the control and prazosin condition. Blocking α1-receptors with prazosin resulted in a small attenuation of ATP overflow.
Age-related changes in ATP overflow
Figure 10 is a summary of age-related changes in ATP overflow following 60 Hz field stimulation. Arterioles from 2-month-old rats (n = 7) had a large increase in ATP overflow following field stimulation and a second large increase in ATP from 25 to 60 s following field stimulation. The arterioles from two rats (2 months old) failed to release detectible ATP concentrations. Six-month-old rats (n = 4) had small increases in ATP overflow following field stimulation and in some rats, there was also a small increase 30 s after stimulation. By 12 months of age (n = 5), ATP overflow increased in one arteriole to an average of 178 μmol l−1 ATP. However, two 12-month-old rats did not have any ATP overflow in the first 25 s following stimulation. There appears to be a loss of the biphasic release of ATP in the 12-month-old rats, compared to the 2-month- and 6-month-old animals. Overall, the mean ATP overflow in the arterioles from 6-month-old rats was significantly lower than the ATP overflow in arterioles from 2-month- and 12-month-old rats (P < 0.05).
Figure 10. Mean ATP overflow from 1A arterioles from young adult, mature adult and middle aged rats.
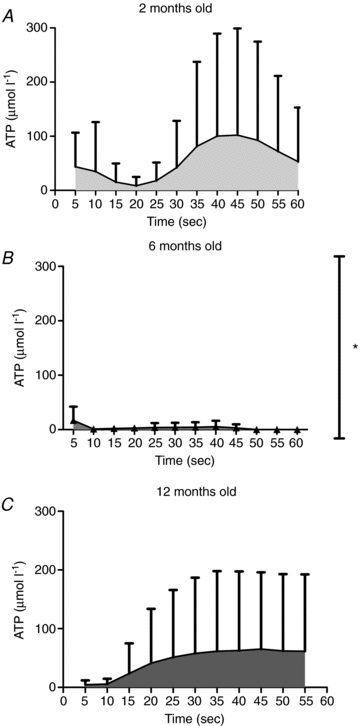
Arterioles from young adult (2 months old, n = 7) animals (A) had high ATP release in the first 20 s following field stimulation and again at the 25 to 60 s time point. Mature adult rats (6 months old, n = 4; B) had a small ATP overflow from 0 to 10 s and again starting at 35 s following field stimulation (P < 0.05 different from 2-month- and 12-month-old groups). ATP overflow in middle aged animals (12 months old, n = 5; C) followed a similar pattern as occurred in the younger animals, but the magnitude of the response was approximately 4-fold higher (P < 0.05), compared to 6-month-old animals. *P < 0.05 different from 2-month- and 12-month-old animals.
Discussion
This is the first study to investigate real-time ATP overflow in isolated skeletal muscle arterioles. We found that ATP overflow was biphasic and of neural origin. Endothelium removal potentiated ATP overflow following field stimulation, but was little attenuated by α1-blockade. We also found ATP overflow varied over adulthood, and that ATP overflow was highest at 2 months and 1 year of age. These findings suggest that in the skeletal muscle isolated arteriole, ATP release was of neural origin, but appeared to have different control mechanisms compared to other arteries and smooth muscle previously studied. Contrary to our hypothesis, ATP overflow was altered with ageing, but this was not a linear relationship.
Determining amperage and frequency for field stimulation
The optimal frequency for detectible ATP overflow found in this study was 60 Hz. Previous recordings of single post-ganglionic sympathetic neurons show an average frequency of 0.47 Hz in the radial and peroneal nerve (Macefield et al. 1994) and up to an average of 1.62 Hz in the rat tail nerve (Johnson & Gilbey, 1998). However, 60 Hz has been recorded as an instantaneous frequency (frequency within a burst of sympathetic nerve activity) in healthy human muscle (Macefield et al. 1994). In human cutaneous vasoconstrictor neurons, instantaneous firing frequencies as high as 146 Hz have been recorded (Macefield & Wallin, 1999). These results suggest that even at rest it was possible to have a burst of sympathetic activity that was in the 60 Hz range. However, it is acknowledged that the burst number used in this study was not physiological at 200 impulses. Most of the highest frequencies were seen only in paired bursts (Macefield et al. 1994; Macefield & Wallin, 1999). The purpose of using 200 impulses was to allow a sufficient stimulation time so diameter changes could be recorded. Future studies should reduce impulses per burst to less than seven (Macefield et al. 1994; Macefield & Wallin, 1999).
Research into the optimal frequency for ATP release has generally suggested that ATP was released at very low stimulation frequencies (Evans & Cunnane, 1992; Haniuda et al. 1997; Ren & Burnstock, 1997; Johnson et al. 2001), though there have been papers suggesting that ATP was also released at higher stimulation frequencies (Evans & Cunnane, 1992; Haniuda et al. 1997; Kluess et al. 2006). The current data suggest that ATP was released at high stimulation frequencies. These data do not dispute previous literature suggesting ATP was released at lower frequencies, although we were unable to detect ATP overflow at lower frequencies in this study. This may be due to the sensitivity of the biosensor to ATP concentrations below 0.78 μmol l−1. At low frequencies, the amount of ATP may be too small and rapidly broken down by ecto-ATPase (Bao & Stjarne, 1993) for an appreciable amount to diffuse out of the synapse and be detectible as ATP overflow. At this time, it is not technically possible to block ecto-ATPase activity to separate the issues of ATP release and metabolism in the presence of the ATP biosenors used in this study. The biosensors work via an ATPase, therefore ATPase antagonists, such as ARL67156 and sodium orthovanadate, lower the sensitivity of the ATP probe itself.
Sources of ATP
In agreement with previous research (Todorov et al. 1996), we have found that ATP overflow was biphasic in nature. There was an initial overflow of ATP that was detectible following field stimulation and was more than 50% reduced by 10 s after the end of field stimulation. This was followed by a 20–30 s period of little ATP overflow and then ATP overflow increased again around 35 s. Experiments using tetrodotoxin, a potent neurotoxin that blocks action potential generation in nerves, suggested that the ATP overflow has a neural origin and was in agreement with others (Vizi & Burnstock, 1988; Vizi et al. 1992). However, all of the ATP may not come directly from the sympathetic nerve. Vizi et al. and others (Vizi & Burnstock, 1988; Vizi et al. 1992; Papp et al. 2004) have previously shown that the second (late) increase in ATP overflow was a result of ATP released from the vascular smooth muscle as a product of α1-adrenergic receptor stimulation via noradrenaline release. This secondary release of ATP from the vascular smooth muscle was termed ‘cascade transmission’ (Vizi et al. 1992) and would also be blocked by tetrodotoxin, since tetrodotoxin inhibits noradrenaline release from the sympathetic nerve.
We tested the hypothesis that part of the ATP overflow was due to release via the smooth muscle by adding a dose of the α1-adrenergic receptor antagonist prazosin, in a concentration that abolished vasoconstriction (Kluess et al. 2006), but did not appear to alter the null probe signal. The specific α1-agonist phenylephrine resulted in a decrease in ATP overflow, suggesting that the activation of α1-receptors does, in part, cause ATP overflow. However, the α1-antagonist prazosin did not alter the initial ATP overflow seen (0–20 s after field stimulation) in most arterioles, but it did attenuate the ATP overflow in the 35–60 s time period in two of the three arterioles tested. These confirm findings by Vizi et al. (1992) that activation of α1-receptors did cause an increase in ATP overflow, but efforts to block this effect showed that only the late ATP overflow may be, in part, caused by α1-mediated release of ATP from the vascular smooth muscle.
Another potential source of ATP was the endothelial layer of the 1A arteriole (Shinozuka et al. 1994; Burnstock, 2008). Our data indicate that removal of the endothelium in gastrocnemius 1A arterioles potentiated ATP release. This may be caused by the endothelium having a large pool of ecto-ATPase activity or some other mechanism of ATP uptake. It is known that the endothelium contains ATPases (Burnstock, 1999) and it is generally believed to be involved in modulating ATP released by the red blood cells (Sprague et al. 2003). There were no previous data suggesting that the endothelium may play an important role in modulating ATP released from the sympathetic nerve. Another possibility was that removing the endothelium increased the permeability of the smooth muscle to release ATP. However, previous reports in the thoracic aorta suggested that removing the endothelium via rubbing removed a significant source of ATP release (Sedaa et al. 1990), suggesting that removal of the endothelium alone did not increase ATP release in all vessel types. The data from the current study also conflict with experiments showing that cultured thoracic aorta and caudal artery endothelial cells release a significant amount of ATP, but cultured smooth muscle cells from the caudal artery did not release ATP (Shinozuka et al. 1994). It appears from the previous literature that the caudal and thoracic aorta may have a unique contribution of ATP release from the endothelium. In the skeletal muscle 1A arterioles (current study) and the vas deferens (Vizi & Burnstock, 1988; Vizi et al. 1992), the predominant source of ATP overflow was neural in origin. It is possible that sources of ATP may be unique to different vascular beds and tissue types, and underscores the importance of studying ATP release and metabolism.
Age-related changes in ATP overflow
These data show that ATP overflow in adult animals was biphasic with the highest ATP overflow in the arterioles from the 2-month- and 12-month-old animals, and the lowest from arterioles from 6-month-old animals. The difference between 2-month- and 6-month-old rats was consistent with work by Hashimoto et al. (1995) in the tail artery. Hashimoto showed that the highest ATP release was in tail arteries from 5-week-old rats compared to 7.5-month- and 25-month-old animals. These data also appeared to be consistent with work by Wallace et al. (2006) showing a loss of P2X and P2Y receptors on the smooth muscle and endothelium with increasing age (4 weeks to 24 months). High ATP release in 2-month-old animals was consistent with the idea that these animals are still in a rapid growth phase and ATP may be playing an important role in the maturation of the skeletal muscle vascular system.
These results suggest that ATP overflow in arterioles from 12-month-old animals was similar in concentration to the 2-month-old animals. The increase in ATP overflow at 12 months of age appears to be in both the early and late phase portions of ATP overflow. This ageing time point has not been previously investigated in terms of ATP release or purinergic receptor expression. However, it was interesting to note that the 24-month-old animals had similar ATP release (Hashimoto et al. 1995) and lower purinergic receptor expression (Wallace et al. 2006) compared to the mature adults (6 to 7.5 months old). Since purinergic receptors activate mitogenic pathways (Burnstock, 2002b, 2006), in an adult animal, high ATP overflow may indicate pathological changes in the vasculature. In this study, there was considerable variation in ATP release in the 12-month-old animals, suggesting that in some animals, age-related changes in the vasculature may occur earlier than previously appreciated. It is possible that the results seen in the 24+-month-old animals (Hashimoto et al. 1995; Wallace et al. 2006) are the result of a survivor effect, since at 26 months old approximately 50% of the original population is still alive; however, at 12 months 90% of the population are alive (Turturro et al. 1999). Future studies should investigate the effect of high ATP release on the activation of mitogenic signalling pathways in the 12-month-old age group, since it is possible that high ATP overflow in mature adult animals may indicate the onset of pathological changes in the vasculature.
Significance
The sources and control of ATP overflow have been studied in a limited selection of vascular tissue for several years and has revealed that there are significant differences in the vas deferens (Vizi & Burnstock, 1988; Sperlagh & Vizi, 1992; Vizi et al. 1992), caudal artery (Shinozuka et al. 1994; Hashimoto et al. 1995), thoracic aorta (Shinozuka et al. 1994) and isolated skeletal muscle resistance arterioles. These differences underscore the importance of continuing to study the mechanisms that control ATP release. Previous data have suggested that ATP has a small contribution to vasoconstriction in the skeletal muscle vasculature (Buckwalter et al. 2003; Buckwalter et al. 2004; Dinenno & Joyner, 2006); however, recent evidence suggests that purinergic receptors play an important role in signalling cell growth and DNA and RNA synthesis (Burnstock, 2002b, 2008). These processes contribute to intimal thickening and the development of cardiovascular diseases (Burnstock, 2002b). Therefore, better understanding of the sources of ATP, the control and management of extracellular ATP, and the metabolism of ATP is of vital importance to better understanding vascular control and vascular remodelling.
Limitations
Limitations to this study include the high frequency of field stimulation, making the results from this study more analogous to very high sympathetic stimulation, rather than the type of sympathetic stimulation an arteriole may experience at rest or under mild exercise conditions. In addition, the isolated preparation removes some of the other sources of ATP, such as the skeletal muscle, other arterioles and veins, and the red blood cells and platelets that an arteriole in vivo may experience. In the future, the results from this study should be tested in an in vivo model to determine the validity of these findings.
Conclusion
These data show that it is possible to measure ATP overflow in an isolated 1A arteriole using ATP biosensors. The results reveal that 1A arterioles have two phases of ATP overflow and both are of neural origin and may involve cascade transmission. Phase 1 was unaffected by post-junctional blockade of α1-receptors, but phase 2 may be, in part, caused by activation of the vascular smooth muscle via α1-receptors. In 1A arterioles, the endothelium appeared to play an inhibiting role in ATP overflow, since ATP overflow increased with removal of the endothelium. Lastly, we found that ATP overflow varied across the lifespan. These results suggested that ATP release or control of ATP overflow changes early in the ageing process. Future studies should further investigate the factors that control ATP overflow and ATP metabolism to reveal some of the mechanisms associated with age-related changes in purinergic neurotransmission.
Acknowledgments
The authors acknowledge the expert technical assistance of Audrey Dimond and Allyson Hammond. This project was supported by the National Institute on Aging and the Arkansas Biosciences Institute.
Author contributions
H.A.K. was involved in the concept and design of the experiments; the collection, analysis and interpretation of the data; and the drafting of the article and revision. A.J.S. was involved in concept and design of the ageing experiments; collection, analysis and interpretation of the ageing experiments; and was involved in revising the manuscript. K.W.E. was involved in some of the collection and analysis and was involved in revising the manuscript. All authors approved the final version.
References
- Bao JX, Gonon F, Stjarne L. Kinetics of ATP- and noradrenaline-mediated sympathetic neuromuscular transmission in rat tail artery. Acta Physiol Scand. 1993;149:503–519. doi: 10.1111/j.1748-1716.1993.tb09648.x. [DOI] [PubMed] [Google Scholar]
- Bao JX, Stjarne L. Dual contractile effects of ATP released by field stimulation revealed by effects of α,β-methylene ATP and suramin in rat tail artery. Br J Pharmacol. 1993;110:1421–1428. doi: 10.1111/j.1476-5381.1993.tb13979.x. [DOI] [PMC free article] [PubMed] [Google Scholar]
- Buckwalter JB, Hamann JJ, Clifford PS. Vasoconstriction in active skeletal muscles: a potential role for P2X purinergic receptors. J Appl Physiol. 2003;95:953–959. doi: 10.1152/japplphysiol.00173.2003. [DOI] [PubMed] [Google Scholar]
- Buckwalter JB, Taylor JC, Hamann JJ, Clifford PS. Do P2X purinergic receptors regulate skeletal muscle blood flow during exercise. Am J Physiol Heart Circ Physiol. 2004;286:H633–H639. doi: 10.1152/ajpheart.00572.2003. [DOI] [PubMed] [Google Scholar]
- Burnstock G. Current status of purinergic signalling in the nervous system. Prog Brain Res. 1999a;120:3–10. doi: 10.1016/s0079-6123(08)63541-4. [DOI] [PubMed] [Google Scholar]
- Burnstock G. Purinergic cotransmission. Brain Res Bull. 1999b;50:355–357. doi: 10.1016/s0361-9230(99)00103-3. [DOI] [PubMed] [Google Scholar]
- Burnstock G. Release of vasoactive substances from endothelial cells by shear stress and purinergic mechanosensory transduction. J Anat. 1999c;194:335–342. doi: 10.1046/j.1469-7580.1999.19430335.x. [DOI] [PMC free article] [PubMed] [Google Scholar]
- Burnstock G. Potential therapeutic targets in the rapidly expanding field of purinergic signalling. Clin Med. 2002a;2:45–53. doi: 10.7861/clinmedicine.2-1-45. [DOI] [PMC free article] [PubMed] [Google Scholar]
- Burnstock G. Purinergic signaling and vascular cell proliferation and death. Arterioscler Thromb Vasc Biol. 2002b;22:364–373. doi: 10.1161/hq0302.105360. [DOI] [PubMed] [Google Scholar]
- Burnstock G. Pathophysiology and therapeutic potential of purinergic signaling. Pharmacol Rev. 2006;58:58–86. doi: 10.1124/pr.58.1.5. [DOI] [PubMed] [Google Scholar]
- Burnstock G. Dual control of vascular tone and remodelling by ATP released from nerves and endothelial cells. Pharmacol Rep. 2008;60:12–20. [PubMed] [Google Scholar]
- Burnstock G, Kennedy C. A dual function for adenosine 5′-triphosphate in the regulation of vascular toneExcitatory cotransmitter with noradrenaline from perivascular nerves and locally released inhibitory intravascular agent. Circ Res. 1986;58:319–330. doi: 10.1161/01.res.58.3.319. [DOI] [PubMed] [Google Scholar]
- Cao Z, Bell JB, Mohanty JG, Nagababu E, Rifkind JM. Nitrite enhances RBC hypoxic ATP synthesis and the release of ATP into the vasculature: a new mechanism for nitrite-induced vasodilation. Am J Physiol Heart Circ Physiol. 2009;297:H1494–H1503. doi: 10.1152/ajpheart.01233.2008. [DOI] [PMC free article] [PubMed] [Google Scholar]
- Clifford PS, Kluess HA, Hamann JJ, Buckwalter JB, Jasperse JL. Mechanical compression elicits vasodilatation in rat skeletal muscle feed arteries. J Physiol. 2006;572:561–567. doi: 10.1113/jphysiol.2005.099507. [DOI] [PMC free article] [PubMed] [Google Scholar]
- Dale N, Hatz S, Tian F, Llaudet E. Listening to the brain: microelectrode biosensors for neurochemicals. Trends Biotechnol. 2005;23:420–428. doi: 10.1016/j.tibtech.2005.05.010. [DOI] [PubMed] [Google Scholar]
- Dinenno FA, Joyner MJ. α-Adrenergic control of skeletal muscle circulation at rest and during exercise in aging humans. Microcirculation. 2006;13:329–341. doi: 10.1080/10739680600618843. [DOI] [PubMed] [Google Scholar]
- Erlinge D. Extracellular ATP: a growth factor for vascular smooth muscle cells. Gen Pharmacol. 1998;31:1–8. doi: 10.1016/s0306-3623(97)00420-5. [DOI] [PubMed] [Google Scholar]
- Evans RJ, Cunnane TC. Relative contributions of ATP and noradrenaline to the nerve evoked contraction of the rabbit jejunal artery. Dependence on stimulation parameters. Naunyn Schmiedebergs Arch Pharmacol. 1992;345:424–430. doi: 10.1007/BF00176620. [DOI] [PubMed] [Google Scholar]
- Finger TE, Danilova V, Barrows J, Bartel DL, Vigers AJ, Stone L, Hellekant G, Kinnamon SC. ATP signaling is crucial for communication from taste buds to gustatory nerves. Science. 2005;310:1495–1499. doi: 10.1126/science.1118435. [DOI] [PubMed] [Google Scholar]
- Gerasimovskaya EV, Ahmad S, White CW, Jones PL, Carpenter TC, Stenmark KR. Extracellular ATP is an autocrine/paracrine regulator of hypoxia-induced adventitial fibroblast growth. Signaling through extracellular signal-regulated kinase-1/2 and the Egr-1 transcription factor. J Biol Chem. 2002;277:44638–44650. doi: 10.1074/jbc.M203012200. [DOI] [PubMed] [Google Scholar]
- Gourine AV, Atkinson L, Deuchars J, Spyer KM. Purinergic signalling in the medullary mechanisms of respiratory control in the rat: respiratory neurones express the P2X2 receptor subunit. J Physiol. 2003;552:197–211. doi: 10.1113/jphysiol.2003.045294. [DOI] [PMC free article] [PubMed] [Google Scholar]
- Gourine AV, Dale N, Korsak A, Llaudet E, Tian F, Huckstepp R, Spyer KM. Release of ATP and glutamate in the nucleus tractus solitarii mediate pulmonary stretch receptor (Breuer–Hering) reflex pathway. J Physiol. 2008;586:3963–3978. doi: 10.1113/jphysiol.2008.154567. [DOI] [PMC free article] [PubMed] [Google Scholar]
- Gourine AV, Llaudet E, Dale N, Spyer KM. Release of ATP in the ventral medulla during hypoxia in rats: role in hypoxic ventilatory response. J Neurosci. 2005;25:1211–1218. doi: 10.1523/JNEUROSCI.3763-04.2005. [DOI] [PMC free article] [PubMed] [Google Scholar]
- Haniuda K, Nakane T, Chiba S. Different contributions of ATP and noradrenaline to neurotransmission in the isolated canine intermediate auricular artery. Eur J Pharmacol. 1997;333:163–168. doi: 10.1016/s0014-2999(97)01121-7. [DOI] [PubMed] [Google Scholar]
- Hashimoto M, Shinozuka K, Bjur RA, Westfall DP, Hattori K, Masumura S. The effects of age on the release of adenine nucleosides and nucleotides from rat caudal artery. J Physiol. 1995;489:841–848. doi: 10.1113/jphysiol.1995.sp021096. [DOI] [PMC free article] [PubMed] [Google Scholar]
- Johnson CD, Coney AM, Marshall JM. Roles of norepinephrine and ATP in sympathetically evoked vasoconstriction in rat tail and hindlimb in vivo. Am J Physiol Heart Circ Physiol. 2001;281:H2432–H2440. doi: 10.1152/ajpheart.2001.281.6.H2432. [DOI] [PubMed] [Google Scholar]
- Johnson CD, Gilbey MP. Focally recorded single sympathetic postganglionic neuronal activity supplying rat lateral tail vein. J Physiol. 1998;508:575–585. doi: 10.1111/j.1469-7793.1998.575bq.x. [DOI] [PMC free article] [PubMed] [Google Scholar]
- Kluess HA, Buckwalter JB, Hamann JJ, DeLorey DS, Clifford PS. Frequency and pattern dependence of adrenergic and purinergic vasoconstriction in rat skeletal muscle arteries. Exp Physiol. 2006;91:1051–1058. doi: 10.1113/expphysiol.2006.034694. [DOI] [PubMed] [Google Scholar]
- Llaudet E, Hatz S, Droniou M, Dale N. Microelectrode biosensor for real-time measurement of ATP in biological tissue. Anal Chem. 2005;77:3267–3273. doi: 10.1021/ac048106q. [DOI] [PubMed] [Google Scholar]
- Macefield VG, Wallin BG. Respiratory and cardiac modulation of single sympathetic vasoconstrictor and sudomotor neurones to human skin. J Physiol. 1999;516:303–314. doi: 10.1111/j.1469-7793.1999.303aa.x. [DOI] [PMC free article] [PubMed] [Google Scholar]
- Macefield VG, Wallin BG, Vallbo AB. The discharge behaviour of single vasoconstrictor motoneurones in human muscle nerves. J Physiol. 1994;481:799–809. doi: 10.1113/jphysiol.1994.sp020482. [DOI] [PMC free article] [PubMed] [Google Scholar]
- Mihaylova-Todorova S, Todorov LD, Westfall DP. Correlation between the release of the sympathetic neurotransmitter ATP and soluble nucleotidases from the guinea pig vas deferens. J Pharmacol Exp Ther. 2001;296:64–70. [PubMed] [Google Scholar]
- Mortensen SP, Gonzalez-Alonso J, Bune LT, Saltin B, Pilegaard H, Hellsten Y. ATP-induced vasodilation and purinergic receptors in the human leg: roles of nitric oxide, prostaglandins, and adenosine. Am J Physiol Regul Integr Comp Physiol. 2009a;296:R1140–R1148. doi: 10.1152/ajpregu.90822.2008. [DOI] [PubMed] [Google Scholar]
- Mortensen SP, Gonzalez-Alonso J, Nielsen JJ, Saltin B, Hellsten Y. Muscle interstitial ATP and norepinephrine concentrations in the human leg during exercise and ATP infusion. J Appl Physiol. 2009b;107:1757–1762. doi: 10.1152/japplphysiol.00638.2009. [DOI] [PubMed] [Google Scholar]
- Msghina M, Mermet C, Gonon F, Stjarne L. Electrophysiological and electrochemical analysis of the secretion of ATP and noradrenaline from the sympathetic nerves in rat tail artery: effects of α2-adrenoceptor agonists and antagonists and noradrenaline reuptake blockers. Naunyn Schmiedebergs Arch Pharmacol. 1992;346:173–186. doi: 10.1007/BF00165299. [DOI] [PubMed] [Google Scholar]
- Papp L, Balazsa T, Kofalvi A, Erdelyi F, Szabo G, Vizi ES, Sperlagh B. P2X receptor activation elicits transporter-mediated noradrenaline release from rat hippocampal slices. J Pharmacol Exp Ther. 2004;310:973–980. doi: 10.1124/jpet.104.066712. [DOI] [PubMed] [Google Scholar]
- Pourageaud F, De Mey JG. Vasomotor responses in chronically hyperperfused and hypoperfused rat mesenteric arteries. Am J Physiol Heart Circ Physiol. 1998;274:H1301–H1307. doi: 10.1152/ajpheart.1998.274.4.H1301. [DOI] [PubMed] [Google Scholar]
- Ralevic V, Burnstock G. Receptors for purines and pyrimidines. Pharmacol Rev. 1998;50:413–492. [PubMed] [Google Scholar]
- Ren LM, Burnstock G. Prominent sympathetic purinergic vasoconstriction in the rabbit splenic artery: potentiation by 2,2′-pyridylisatogen tosylate. Br J Pharmacol. 1997;120:530–536. doi: 10.1038/sj.bjp.0700933. [DOI] [PMC free article] [PubMed] [Google Scholar]
- Schneider F, Bucher B, Schott C, Andre A, Julou-Schaeffer G, Stoclet JC. Effect of bacterial lipopolysaccharide on function of rat small femoral arteries. Am J Physiol Heart Circ Physiol. 1994;266:H191–H198. doi: 10.1152/ajpheart.1994.266.1.H191. [DOI] [PubMed] [Google Scholar]
- Sedaa KO, Bjur RA, Shinozuka K, Westfall DP. Nerve and drug-induced release of adenine nucleosides and nucleotides from rabbit aorta. J Pharmacol Exp Ther. 1990;252:1060–1067. [PubMed] [Google Scholar]
- Shinozuka K, Hashimoto M, Masumura S, Bjur RA, Westfall DP, Hattori K. In vitro studies of release of adenine nucleotides and adenosine from rat vascular endothelium in response to α1-adrenoceptor stimulation. Br J Pharmacol. 1994;113:1203–1208. doi: 10.1111/j.1476-5381.1994.tb17125.x. [DOI] [PMC free article] [PubMed] [Google Scholar]
- Sperlagh B, Vizi ES. Is the neuronal ATP release from guinea-pig vas deferens subject to α2-adrenoceptor-mediated modulation? Neuroscience. 1992;51:203–209. doi: 10.1016/0306-4522(92)90485-k. [DOI] [PubMed] [Google Scholar]
- Sprague RS, Ellsworth ML, Stephenson AH, Lonigro AJ. ATP: the red blood cell link to NO and local control of the pulmonary circulation. Am J Physiol Heart Circ Physiol. 1996;271:H2717–H2722. doi: 10.1152/ajpheart.1996.271.6.H2717. [DOI] [PubMed] [Google Scholar]
- Sprague RS, Olearczyk JJ, Spence DM, Stephenson AH, Sprung RW, Lonigro AJ. Extracellular ATP signaling in the rabbit lung: erythrocytes as determinants of vascular resistance. Am J Physiol Heart Circ Physiol. 2003;285:H693–H700. doi: 10.1152/ajpheart.01026.2002. [DOI] [PubMed] [Google Scholar]
- Todorov LD, Mihaylova-Todorova S, Craviso GL, Bjur RA, Westfall DP. Evidence for the differential release of the cotransmitters ATP and noradrenaline from sympathetic nerves of the guinea-pig vas deferens. J Physiol. 1996;496:731–748. doi: 10.1113/jphysiol.1996.sp021723. [DOI] [PMC free article] [PubMed] [Google Scholar]
- Todorov LD, Mihaylova-Todorova S, Westfall TD, Sneddon P, Kennedy C, Bjur RA, Westfall DP. Neuronal release of soluble nucleotidases and their role in neurotransmitter inactivation. Nature. 1997;387:76–79. doi: 10.1038/387076a0. [DOI] [PubMed] [Google Scholar]
- Turturro A, Witt WW, Lewis S, Hass BS, Lipman RD, Hart RW. Growth curves and survival characteristics of the animals used in the Biomarkers of Aging Program. J Gerontol A Biol Sci Med Sci. 1999;54:B492–B501. doi: 10.1093/gerona/54.11.b492. [DOI] [PubMed] [Google Scholar]
- Vizi ES, Burnstock G. Origin of ATP release in the rat vas deferens: concomitant measurement of [3H]noradrenaline and [14C]ATP. Eur J Pharmacol. 1988;158:69–77. doi: 10.1016/0014-2999(88)90254-3. [DOI] [PubMed] [Google Scholar]
- Vizi ES, Sperlagh B, Baranyi M. Evidence that ATP released from the postsynaptic site by noradrenaline, is involved in mechanical responses of guinea-pig vas deferens: cascade transmission. Neuroscience. 1992;50:455–465. doi: 10.1016/0306-4522(92)90437-7. [DOI] [PubMed] [Google Scholar]
- Wallace A, Knight GE, Cowen T, Burnstock G. Changes in purinergic signalling in developing and ageing rat tail artery: importance for temperature control. Neuropharmacology. 2006;50:191–208. doi: 10.1016/j.neuropharm.2005.08.019. [DOI] [PubMed] [Google Scholar]
- Westfall DP, Todorov LD, Mihaylova-Todorova ST. ATP as a cotransmitter in sympathetic nerves and its inactivation by releasable enzymes. J Pharmacol Exp Ther. 2002;303:439–444. doi: 10.1124/jpet.102.035113. [DOI] [PubMed] [Google Scholar]
- Williams DA, Segal SS. Feed artery role in blood flow control to rat hindlimb skeletal muscles. J Physiol. 1993;463:631–646. doi: 10.1113/jphysiol.1993.sp019614. [DOI] [PMC free article] [PubMed] [Google Scholar]


