Abstract
MicroRNAs (miRNAs) have been implicated to play key roles in normal physiological functions, and altered expression of specific miRNAs has been associated with a number of diseases. It is of great interest to understand their roles and a prerequisite for such study is the ability to comprehensively and accurately assess the levels of the entire repertoire of miRNAs in a given sample. It has been shown that some miRNAs frequently have sequence variations termed isomirs. To better understand the extent of miRNA sequence heterogeneity and its potential implications for miRNA function and measurement, we conducted a comprehensive survey of miRNA sequence variations from human and mouse samples using next generation sequencing platforms. Our results suggest that the process of generating this isomir spectrum might not be random and that heterogeneity at the ends of miRNA affects the consistency and accuracy of miRNA level measurement. In addition, we have constructed a database from our sequencing data that catalogs the entire repertoire of miRNA sequences (http://galas.systemsbiology.net/cgi-bin/isomir/find.pl). This enables users to determine the most abundant sequence and the degree of heterogeneity for each individual miRNA species. This information will be useful both to better understand the functions of isomirs and to improve probe or primer design for miRNA detection and measurement.
Keywords: microRNA, isomirs, next generation sequencing, sequence heterogeneity, database
INTRODUCTION
Next generation (NextGen) sequencing platforms (Shendure and Ji 2008; Ansorge 2009; Mukhopadhyay 2009) such as SOLiD from Applied Biosystems (ABI), the Genome Analyzer from Illumina, and Genome Sequencer FLX from 454 are leading the way in offering broad and deep surveys of the transcriptome. One important application of NextGen sequencing technology is the discovery and profiling of small noncoding RNAs (Wei et al. 2009; Wyman et al. 2009; Zhang et al. 2009), including the class known as microRNAs (miRNAs). Mature miRNAs are short RNA molecules (17–25 nucleotides [nt] long) that are processed by the RNase III enzymes, Drosha and Dicer, from transcripts (Davis and Hata 2009; Russo and Giordano 2009). Usually, one strand of the resulting double-stranded RNA, the major strand, is preferentially incorporated with Argonaute proteins into the RNA-induced silencing complex (RISC) where miRNA interacts with messenger RNAs (mRNAs) to inhibit protein translation or destabilize the targeted mRNA (Hu et al. 2009; Tomari 2009). It is believed that the miRNA–mRNA interactions are initiated through the partially complementary pairing of the seed region, nucleotide positions 2–8, of the miRNA with its targeted mRNA (Seitz et al. 2008; Goff et al. 2009). The minor strand, which is normally not incorporated into RISC complexes, is believed to be biologically inactive and degraded in the cell (Zeng 2006; Miller et al. 2008; Okamura et al. 2009).
MiRNAs are involved in various physiopathological conditions (Cho 2009; Fineberg et al. 2009; Weidhaas 2009). To better understand how miRNAs regulate gene expression, it is important to be able to accurately profile the entire miRNA population in biological samples. There are currently two major platforms for miRNA profiling: microarray hybridization (Davison et al. 2006; Liu et al. 2008; Yin et al. 2008; Bargaje et al. 2010) and quantitative polymerase chain reaction (qPCR) (Chen et al. 2005). Both technologies rely heavily on the availability and accuracy of miRNA sequences in the databases for designing probes or primers (Griffiths-Jones et al. 2006, 2008). The advancement of NextGen sequencing technologies offers an unprecedented scale and depth of miRNA profiling. In addition, the sequencing approaches do not have thermodynamic biases usually associated with hybridization-based microarray and qPCR platforms. Moreover, they have the potential to discover previously uncharacterized miRNA species. Unexpectedly, direct sequencing of miRNAs has also revealed some end sequence variations (Morin et al. 2008; Ebhardt et al. 2009; Wu et al. 2009).
To better understand the nature of this diversity and its potential functional implications, we cataloged and compared the distribution of miRNA sequence variants in mouse and human samples obtained using NextGen sequencing platforms. In several instances, the most abundant sequence for individual miRNA species in our data did not match to the mature sequence listed in public miRNA databases, such as miRBase (http:www.mirbase.org). While the distribution of isomirs across samples is generally similar, we found examples in which the dominant isomir is different from sample to sample. This may imply functional roles for specific isomir sequences. In addition, the sequence heterogeneity we have observed may affect the accuracy and consistency of miRNA measurement. We also compiled all isomirs into a database which allows users to assess the expression level and heterogeneity of a specific miRNA species among different samples (http://galas.systemsbiology.net/cgi-bin/isomir/find.pl).
RESULTS
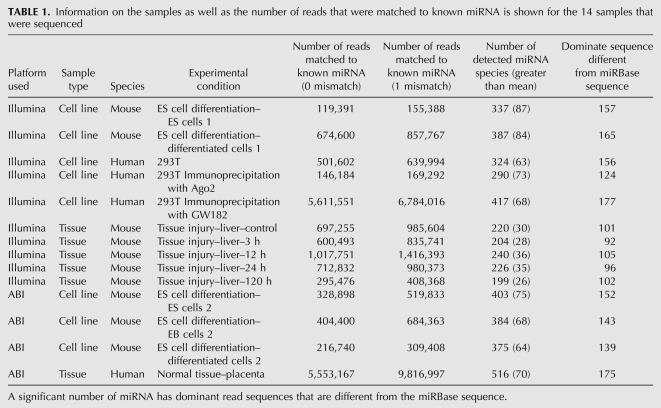
Using NextGen sequencing technologies, we profiled the small RNAs from 14 different biological samples (Table 1). The 14 samples are from three groups of experiments: (1) embryonic stem cell differentiation experiments—containing RNA samples from mouse embryonic stem cells (ES), embryonic bodies (EB), and differentiated cells (Diff); (2) miRNA population associated with the RISC complex derived from human 293T cells—a human kidney epithelial cell line—containing samples from placenta as general control, 293T cell total RNA, 293T RNA isolated from cell lysates immunoprecipitated (IP) with either Argonaute 2 (Ago2) or GW182 antibody; and (3) drug-induced liver injury experiment—containing liver tissues obtained from control mice, and mice after 3, 12, 24, and 120 h of a single 300-mg/kg (IC50 dose) dose of acetaminophen administration. The number of reads matching perfectly to either the human or mouse miRNA precursor sequences deposited in the miRBase (www.mirbase.org) ranged from 0.12 to 5.6 million. If we allowed one nucleotide mismatch, the number of reads that match to miRNA precursor sequences increased considerably. The liver-enriched miRNAs, miR-122 and mir-192 (Chang et al. 2004), showed very high levels in all five liver samples, and the stem cell-enriched miRNAs, mir-302 and mir-290 family members, also showed significant levels in our ES cell samples (Barroso-del Jesus et al. 2009; Wilson et al. 2009; Zovoilis et al. 2009). These findings suggest the global miRNA profiling data obtained were reasonably accurate and suitable for further analysis.
TABLE 1.
Information on the samples as well as the number of reads that were matched to known miRNA is shown for the 14 samples that were sequenced
The number of detected miRNAs from these samples ranged from 200 to 500 but the number of miRNA showing an expression value greater than the global mean was much lower, from 26 in one of the liver samples to 87 in one of the ES cell samples (Table 1). This suggested that only a small fraction of the miRNA species were present at considerable levels in the cells and the concentration of individual miRNAs differed widely within a sample as well as among different samples. Since our focus was to investigate the sequence heterogeneity of miRNAs, we did not conduct extensive sample-to-sample normalization or comparison. In addition we only included miRNA sequencing data that matched perfectly to the miRNA precursors.
NextGen sequencing results showed significant miRNA sequence discrepancies with sequences in public databases
Except for very low abundance miRNA species, all miRNAs we detected showed different degrees of sequence variation when aligned with their genomic precursors. The miRNA sequence variants, termed isomirs (Morin et al. 2008), exhibited shortened or lengthened ends, addition of non-germline sequences at the ends or altered internal miRNA sequences. Since non-germline nucleotide sequence variations, either within or at the ends of miRNA sequences, are heavily influenced by the error rate of the sequencing platform, we excluded these changes from our analyses. One interesting property of miRNAs is the extreme sequence conservation between human and mouse, which allowed us to compare the isomir distribution across the samples from two different species.
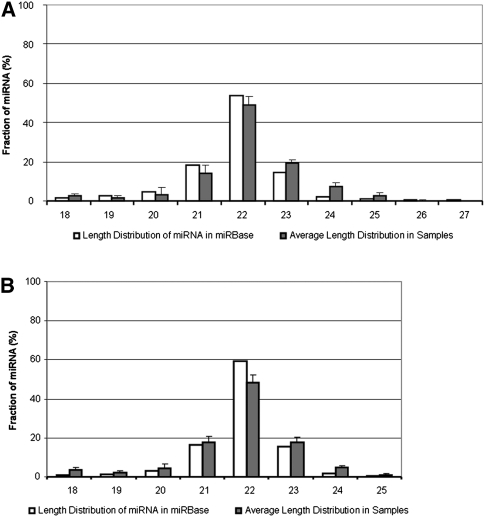
The overall length distribution of the most abundant isomir sequence for each miRNA species is similar to the length of mature miRNA sequences in the public database, all peaked at a length of 22 nt for both human and mouse samples (Fig. 1A,B). We observed slightly higher percentages of miRNAs in mouse samples that were shorter than the reference sequence in the database, which could suggest that some of the isomirs were the degradation products of the miRNAs. At the same time, our data also showed higher percentages for the longer sequences compared to sequences in the database for both the human and mouse samples. Although we could not exclude the possibility that a fraction of the isomirs observed were degraded miRNAs, the detection of a significant number of miRNAs that have sequences longer than the miRBase sequences suggested that a considerable fraction of the isomirs observed are unlikely to be degradation products.
FIGURE 1.
The observed miRNA length distrribution. The most abundant miRNA sequence length distribution for (A) human and (B) mouse samples compared to miRNA sequences deposited in miRBase. The x-axis represents different length of miRNA sequences and the observed frequencies are displayed on y-axis. The higher percentage of miRNA with longer dominant sequence length compared to miRBase sequences suggest that degradation products are unlikely to explain a considerable fraction of the isomirs observed.
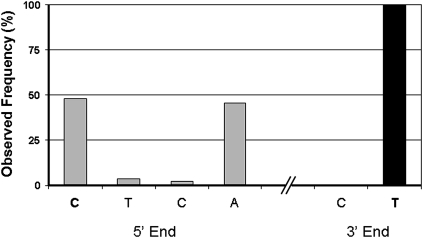
To investigate more directly whether the lengthy process of sample preparation for NextGen sequencing could lead to the observed miRNA end-region heterogeneity, we introduced a 22-nt-long synthetic RNA into the RNA samples prior to NextGen sequencing library construction. The results showed that there were virtually no changes on the 3′ end but a fraction of the synthetic sequences were truncated at the 5′ end (Fig. 2). This is unlikely to be an artifact of the sequence analysis, but rather caused by premature termination during synthesis of the synthetic RNA since the method for oligonucleotide chemical synthesis proceeds from the 3′ to 5′ end. This result suggested that the majority of the end region diversities observed in our results are caused by processes prior to the NextGen sequencing sample preparation step.
FIGURE 2.
The distribution of spike-in RNA ends observed through NextGen sequencing results. The individual end nucleotides are listed on the x-axis and the frequency of observed individual ends are displayed on the y-axis. The full-length RNA oligonucleotide ends are listed as bold-face characters. The 3′ end of sequencing reads matches exactly to the synthetic RNA while the 5′ end variation seen are likely to be premature termination during the spike-in artificial RNA synthesis.
The most abundant sequence for individual miRNA species varies among different species
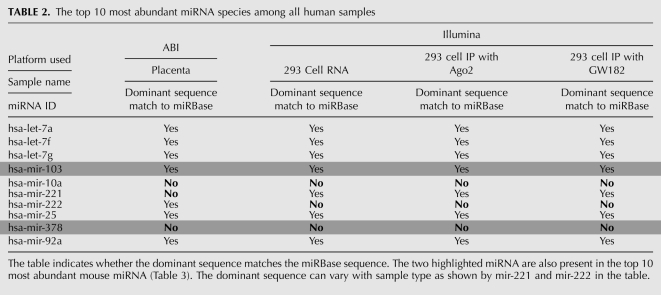
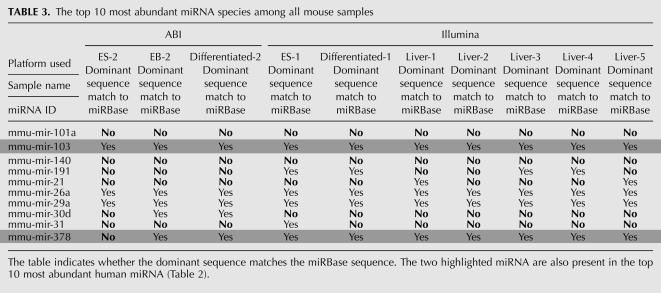
Depending on the sample, the most abundant or dominant isomir sequences for 30%–50% of the miRNA species were different from their corresponding mature miRNA sequences listed in the database (Table 1). When combining different samples, the number of miRNA species consistently having the sequence deposited in the database as the most abundant sequence is even smaller, only 19 in all the mouse samples and 58 in human among our detected miRNA species. Among the top 10 most abundant miRNA species in human and mouse samples studied, only six human and three mouse miRNA species showed a dominant sequence that matched the mature miRNA sequence deposited in the database (Tables 2, 3).
TABLE 2.
The top 10 most abundant miRNA species among all human samples
TABLE 3.
The top 10 most abundant miRNA species among all mouse samples
There were two miRNAs in common, mir-103 and mir-378 (highlighted in the tables), between the top 10 most abundant human and mouse miRNA species listed in Tables 2 and 3. The dominant mir-103 sequence is identical to the sequence in the public database from both human and mouse samples. For the mir-378, all the mouse samples except for one of the ES cell samples, the dominant sequence is the same as the sequence in miRBase, but for human samples, the dominant mir-378 sequence is one nucleotide longer than the database sequence. The dominant sequence can also be different among different types of sample from the same species; for instance, the human mir-222 sequences in 293T cell line samples but not placenta tissue have a sequence that differs from the database entry (Table 2). On the other hand, the mir-221 dominant sequence agrees with the database entry for the 293T cell line samples but not for placenta tissue.
Mature miRNAs have significant end heterogeneity
The majority of the sequence length variations observed in our results are variations at the 3′ end. Less frequently, certain miRNAs also have significant variations on the 5′ end. The end region sequence diversity in a miRNA is proportional to the number of different ends observed and the total number of nucleotides changed, but with an inverse relationship to the abundance of the dominant sequence. Therefore, we can display the miRNA end region diversity as:
where D3′ or 5′mirx is either the 3′ or 5′ end diversity of miRNA X, Ne3′ or 5′mirx represents the number of ends observed at either the 3′ or 5′ end for miRNA X, Nd3′ or 5′mirx is the total number of nucleotides changed at either 3′ or 5′ end from the dominant isomer for miRNA X, and the DOmirx is the fraction of the dominant isomir sequence represented in the total number of observed sequences for miRNA X. Based on this method, the mmu-mir-341 and mmu-mir-298 had the most diverse 5′ and 3′ end, respectively, for mouse ES cell differentiation samples. These miRNAs showed very little expression in the liver samples. The mmu-mir-101b (for 5′ end) and mmu-mir-192 (for 3′ end) had the highest end region heterogeneity in the mouse liver samples. For the human samples, hsa-mir-126 showed the highest diversity for the 5′ end while hsa-mir-145 possessed the most diverse 3′ end.
Distribution of isomirs in the cells probably is not random
To explore miRNA sequence variation and its possible biological implications, we examined the distribution of isomirs among different samples. Since isomirs are the results of combining different 5′ and 3′ ends of the miRNA sequences, we can use the observed frequency of individual ends to represent the changes in isomir distributions.
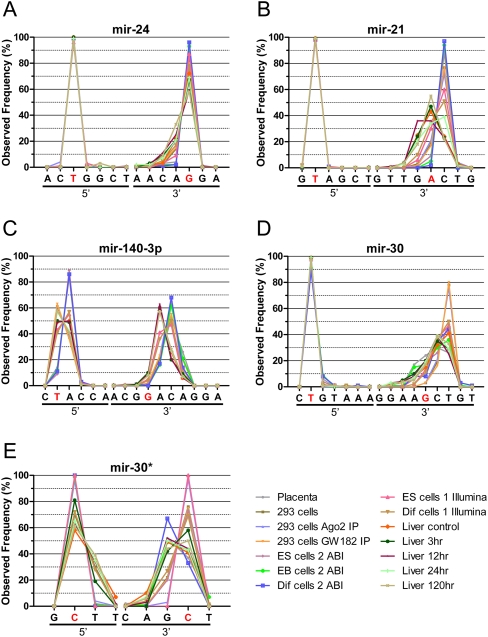
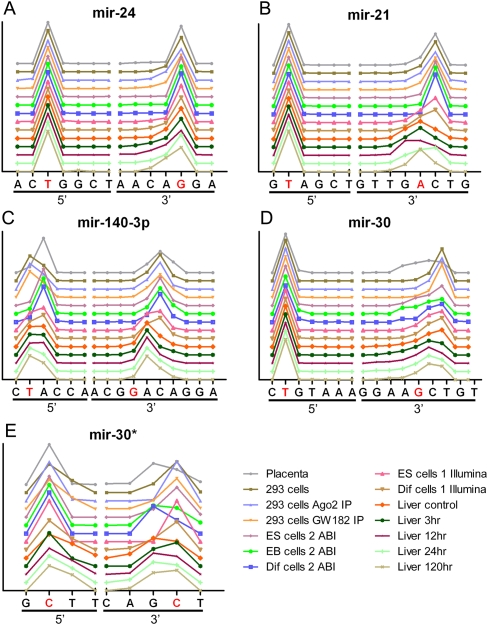
For some of the miRNA species, such as mir-24 (Figs. 3A, 4A), the dominant 5′ and 3′ ends are both the same as reported in the database. While we observed a small fraction of the mir-24 sequences with shorter 3′ ends, especially in the mouse liver samples, a great majority of the mir-24 sequences for all the samples had the same ends as the sequence deposited in miRBase. For other miRNAs such as mir-21, the 5′ end almost exclusively ended at the same position as the mir-21 sequence in the public database (T; displayed as a red character in Figs. 3B, 4B). However, unlike the 5′ end, the 3′ end of mir-21 is quite diverse and can be grouped into two major groups, one ending in A and the other in C, which is one nucleotide longer (Figs. 3B, 4B). Most of the mouse liver samples end with A, but the rest of samples including cell lines and human placenta have C as the dominant 3′ end (Figs. 3B, 4B).
FIGURE 3.
The distribution of selected miRNA ends observed through NextGen sequencing results: (A) mir-24, (B) mir-21, (C) mir-140-3p, (D) mir-30, (E) mir-30*. The individual end nucleotides are listed on the x-axis and the frequency of observed individual ends are displayed on the y-axis. The ends corresponding to the miRNA sequence listed in miRBase are shown in red. (A) The 3′ ends of miR-24 mostly match the miRBase sequence, (B) but for miR-21, it varies by samples. (C) mir-140-3p: The 5′ ends are not always as conserved as in (A) mir-24 and (B) mir-21 and the 3′ ends mostly do not match the miRBase sequence. Both arms of the miRNA precusor, (D) mir-30a and (E) mir-30a*, have fairly conserved 5′ ends while the 3′ ends are more diverse.
FIGURE 4.
Different plot of the distribution of selected miRNA ends observed through NextGen sequencing results: (A) mir-24, (B) mir-21, (C) mir-140-3p, (D) mir-30, (E) mir-30*. The data are the same as shown in Figure 3, but the lines are offset so that the changes in different samples can be distinguished.
The 5′ ends are not always as conserved as in mir-24 and mir-21. For example, the 5′ ends of mir-140-3P (named mir-140* in mouse) has two major ends (Figs. 3C, 4C), similar to the 3′ end of mir-21. The dominant 5′ end for the human placenta, samples from ES cell differentiation and some mouse liver samples, is at nucleotide A, which is one nucleotide longer than the sequence deposited in miRBase. The human 293T cell samples and the rest of the mouse liver samples all ended at position T, the same position as the miRBase sequence. Like its 5′ ends, the mir-140-3P 3′ ends also fall into two major groups and both of them are longer than the sequence in the public database. Most of the isomirs in the mouse liver samples end at nucleotide A which is one nucleotide longer, and the rest of the samples including the 293T cells, ES cell differentiation samples, and human placenta end at C which is two nucleotides longer than the sequence in the miRBase.
In some cases, we observed significant levels of mature miRNAs derived from both arms of the miRNA precursor, one such example is the pair of mir-30a and mir-30a*. The total observed level for mi-30a is 24 times higher than the level of mir-30a*. Nevertheless, the level of mir-30a* is still significant among all the samples to conduct a reliable end region diversity comparison between the two arms. The 5′ ends for both mir-30a and mir-30a* are fairly conserved compared to their 3′ ends (Figs. 3D,E, 4D,E). The dominant 3′ ends for the mir-30a and mir-30a* from our samples can also be divided into two major groups. In mir-30a, the dominant 3′ end of human placenta and most of the mouse liver samples end at nucleotide C and the rest of the cell line samples, including 293T cells and mouse ES cells samples, end at T. Both of these dominant ends are longer than the sequence reported in the public database. Unlike the mir-30a, the sample distribution of dominant 3′ end for the mir-30a* is less consistent among similar samples, for example some of the liver samples and ES cells samples exhibit ends at position G and the rest of the samples with C (see Figs. 3E, 4E).
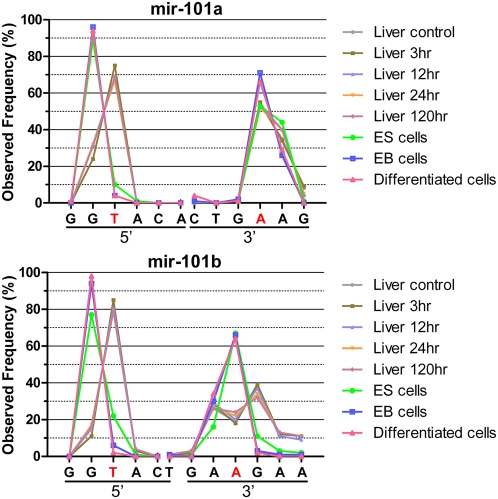
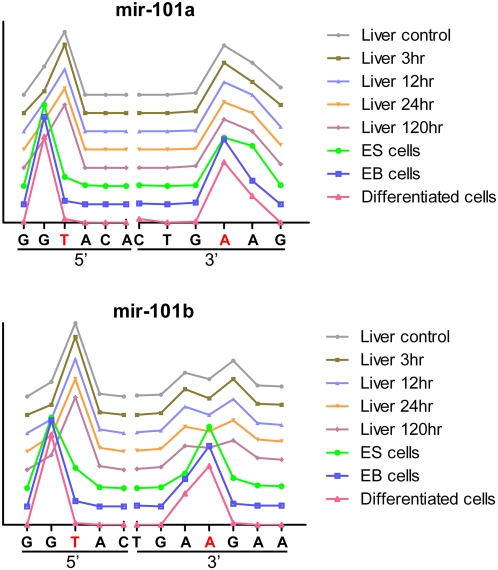
Although mir-21 and mir-140-3P demonstrate some sequence bias among different samples, miRNAs of the mir-101 family, mir-101a and mir-101b, show distinct end distributions among the samples we studied (Figs. 5, 6). Except for the human samples, mir-101a and b show relatively high levels among all the mouse samples including liver samples from acetaminophen toxicity studies and cell line samples from ES cell differentiation experiments. There are two major 5′ ends, either G or T, for the mir-101s and all the liver samples are in one group (ending at T) and samples from the ES differentiation experiments are in the other (ending with G; Figs. 5, 6). Unlike the 5′ ends, there is a single major 3′ end for mir-101a, while 101b has three different ends. All the liver samples have two major ends, either A or G separated by one nucleotide A. The majority of the ES cell-related samples end in between the two major ends associated with liver samples.
FIGURE 5.
The distribution of mir-101a and mir-101b ends observed through NextGen sequencing results. The individual end nucleotides are listed on the x-axis and the frequency of observed individual ends are displayed on the y-axis. The ends corresponding to the miRNA sequence listed in miRBase are listed as red characters. Both mir-101a and mir-101b show two distinct 5′ ends. Samples from the ES differentiation experiments end with G while liver samples end with T. The majority of 3′ end for mir-101a matches the database at A, while for mir-101b, the liver samples are spread in two major ends, one nucleotide shorter (A) or one nucleotide longer (G) compared to the ES samples.
FIGURE 6.
Different plot of the distribution of mir-101a and mir-101b ends observed through NextGen sequencing results. The data are the same as shown in Figure 5 but the lines are offset so that the changes in different samples can be distinguished.
miRNA end region diversity may affect the measurement of miRNA levels
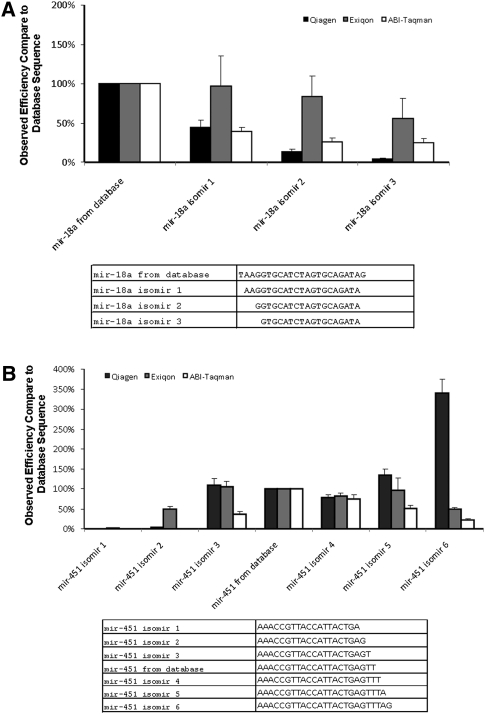
To demonstrate the effects of end region sequence heterogeneity on miRNA measurements, we made synthetic RNA templates based on the isomir sequences of two miRNAs, mir-18a (for 5′ end heterogeneity) and mir-451 (for 3′ heterogeneity; Nelson et al. 2007), obtained from our sequencing results. Three different qPCR measurement platforms were used to measure their ability of detecting individual synthetic isomir RNAs. The Taqman qPCR method from Applied Biosystems uses a stem–loop primer that anneals to the 3′ end of the miRNA to generate cDNA for the qPCR (Chen et al. 2005). The Qiagen and Exiqon platforms use polyadenylase to generate poly A tails and then use anchored poly T primer to generate cDNA templates for miRNA profiling. The Exiqon platform also applies nucleotide analogs to enhance the specificity and selectivity of their miRNA qPCR primers (Kore et al. 2008).
The results were striking in that one or two nucleotide changes from the mature forms in the miRBase at either the 3′ or 5′ end drastically affected the measurement results (Fig. 7A,B). In general, the method that relies on the sequence integrity of 3′ end (compared to the miRBase sequence) was affected the most. On the other hand, the qPCR platform from Exiqon which uses modified nucleotides to enhance the primer specificity generally performed better in detecting different isomir sequences based on the results with our synthetic RNA templates.
FIGURE 7.
The effects of miRNA end region heterogenity on different miRNA qPCR platforms. QPCR reagents from three different vendors, Qiagen (black bars), Exiqon (gray bars), and ABI (white bars), are used to assess its ability to detect same amount of synthetic RNA sequences based on the isomirs from (A) mir-451 and (B) mir-18a. The detection efficiency was compared to the detection efficiency of the database sequence and shows that one- or two-nucleotide-length difference in miRNA can drastically affect measurement results.
A database to catalog isomir spectrum
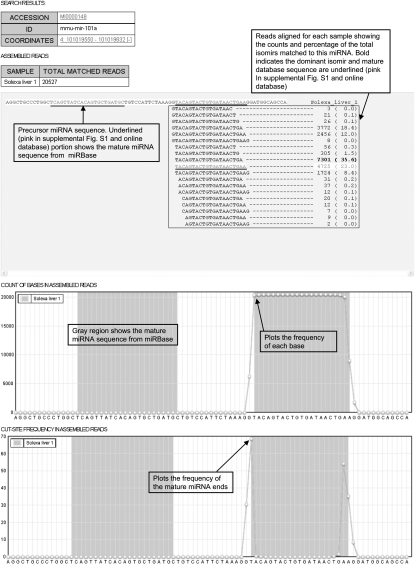
To track and record miRNA sequence variations, we constructed a publicly available database with a simple web-based interface (http://galas.systemsbiology.net/cgi-bin/isomir/find.pl). Users can retrieve all reads and isomirs assigned to a particular miRNA using the miRNA name. The results are grouped into three major portions and a typical result page is shown in Figure 8 (color version in Supplemental Fig. S1). The first part of the page displays the general miRNA information including name and genomic location with a hyperlink to miRBase and EnsEMBL (http://uswest.ensembl.org/index.html). The second part of the result shows the assembled sequence, number of reads and fractions for each isomir sequence, along with the miRNA precursor sequence. Sequences that match perfectly to the sequence deposited in miRBase are displayed underlined (pink in Supplemental Fig. S1 and online database) (4725 reads for mir-101a or 23% of total reads in Fig. 8), while the most abundant sequence (TACAGTACTGTGATAACTGA, 7301 reads or 35.6% of total reads for mir-101 in Fig. 8) is showed in bold-face. The last portion includes graphics to display the “nucleotide sequence usage” and “miRNA end nucleotide” frequencies along with the miRNA precursor sequence. The regions covering the mature miRNA sequences in the public database are marked in gray and the frequency of individual bases that appeared in our sequencing results (top) and the frequency of ends (bottom) are shown. For mir-101a, a large percentage of the start position coincides with the database mature sequence but the end position is one base shorter than the database sequence.
FIGURE 8.
A screen shot of isomir database. The aligned reads and corresponding counts are shown. The first plot shows the frequency of the bases and the second plot shows the frequency of the mature miRNA end positions. Sequences that match perfectly to miRBase sequences are shown underlined (pink in Supplemental Fig. S1 and online database) and most abundant sequences are displayed in bold.
DISCUSSION
DNA replication, RNA transcription, and protein synthesis all rely on molecular recognition and precisely processed and executed molecular machinery. The expression and maturation of miRNA has been thought to follow the same pattern, which would lead to a single functional miRNA sequence from each miRNA precursor. However, recent evidence suggests that, unlike other biomolecules in cells, some miRNAs contain heterogeneous ends—isomirs (Morin et al. 2008; Ebhardt et al. 2009). To further investigate miRNA end heterogeneity and its potential biological implications, we employed NextGen sequencing platforms to analyze miRNA from different biological samples, from human and mouse, and comprehensively cataloged such miRNA end heterogeneity. From our survey, a substantial number, from 34% to 51% of the detectable miRNA species, had a dominant (most abundant) mature miRNA sequence that differed from the sequence listed in the database (Table 1). Our data also suggest the process of isomir generation may not be random, implying some regulatory mechanisms may influence the spectrum of isomirs in the cells.
Isomirs are not caused by RNA degradation during sample preparation steps for NextGen sequencing
One of the possible contributing factors for miRNA end heterogeneity is the lengthy processes involved in NextGen sequencing library construction, which could possibly cause significant RNA degradation at the miRNA ends. However, this could not explain the biases of the degree of heterogeneity between the two miRNA ends (the 3′ ends of miRNAs are usually more diverse than the 5′ ends). In addition, we also observed a significant number of miRNAs that are longer than the sequence deposited in the database (Fig. 2A,B). Nonetheless, we tested for RNA degradation using a spike-in RNA during the preparation of NextGen sequencing library. In this case, we observed <1% of the total reads have a shorter 3′ end, while >50% of the reads exhibit shorter lengths at the 5′ end (Fig. 2). This is the opposite of the effects seen in our miRNA sequencing results—higher sequence changes at the 3′ ends. Since the in vitro oligonucleotide chemical synthesis on solid support starts at the 3′ end, the shorter 5′ ends are a well-known phenomenon caused by premature termination during synthesis.
miRNA end region diversity may have functional meaning
Even though some miRNAs, such as mir-101a and mir-101b (Figs. 5, 6), have significant diversity at their 5′ ends, in general, the 5′ ends are more conserved than the 3′ ends in our data. This is probably due to functional pressure on the 5′ end resulting in higher end-region conservation. Since the initial miRNA–mRNA interactions are through partial sequence complimentarily between the seed region of the miRNA (nucleotide 2 through 10 from the 5′ end) and targeted mRNA, any major changes in this region will affect the functionality of miRNAs. The clear difference in the distribution of 5′ ends for mir-101s between liver tissue samples and ES cell samples suggests that miRNA processing may not be random and the isomir distribution may also have functional implications.
miRNA end region diversity may affect the measurement accuracy
One of the challenges in miRNA research is the accuracy of measuring specific miRNA levels, despite the development of several global miRNA measurement platforms based on qPCR or microarray technologies. The lack of inter-platform consistency and intra-platform reproducibility on miRNA measurement continues to puzzle researchers in the field (Ach et al. 2008; Chen et al. 2009; Sato et al. 2009). Inadequate probe or primer specificity due to short mature miRNA sequences and high sequence similarity among different miRNA species have been suggested as the two main reasons for the difficulties in obtaining accurate and reproducible miRNA measurements.
Current measurement technologies use miRNA sequences deposited in the public database, miRBase, as the template for probe/primer design. Some of the measurement technologies depend heavily on the integrity of the miRNA sequence, especially at the 3′ end of the sequence, to generate cDNA template or to produce labeled probes for miRNA detection. The finding of significant end region sequence heterogeneity for miRNAs through NextGen sequencing results, especially at the 3′ ends, may help to explain some of the measurement problems. Using synthetic RNA templates based on selected isomir sequences identified in our sequencing results, we demonstrated severe and dramatic effects of end region heterogeneity on miRNA measurements. As expected, different measurement technologies also show a different degree of sensitivity toward sequence alterations at the miRNA ends. Before the development of more accurate measurement technology, it is important to keep in mind the heterogeneous nature of the mature miRNA sequences may affect the level and spectrum of miRNAs measured in the sample.
Comparing the NextGen sequencing results among different samples also suggests that the distribution of isomirs is probably not random, which indicates some functional roles of isomirs that has yet to be shown. This also implies that the miRNA repertoire may be much larger than previously thought and increases the urgency to develop more accurate and comprehensive miRNA profiling technology to better characterize the complete spectrum of miRNA in different biological samples.
An isomir database may help to better design miRNA measurement reagents
The short lengths of mature miRNAs and high sequence similarity among miRNA families pose a great challenge in designing primers and probes for miRNA measurements. The heterogeneity on both the 5′ and 3′ ends further hinders the accurate assessment of miRNA levels. Given the large number of isomirs for a specific miRNA species, it appears insufficient to designate a single sequence to represent a particular miRNA. To better design primers or probes, it would be useful to know the dominant miRNA sequence and distribution of isomirs in different biological samples. We constructed a database where such information can be accessed.
With multiple lines of evidence from different platforms, it is clear that there is a significant heterogeneity of miRNAs in cells, and in different cell types. However, key questions remain unresolved. Are all the isomirs biologically active? If so do they play the same role? How does diversity in the mature miRNA affect its interactions with targeted mRNAs? What biological machinery in the cell regulates and generates the heterogeneity of the isomir population, and is it regulated? How can individual isomirs be precisely measured? These questions are difficult and all motivate strongly the development of more specific and more comprehensive miRNA measurement approaches.
MATERIALS AND METHODS
Samples
Mouse embryonic E14 stem cell line derived from 129/Ola strain was cultured in DMEM containing 10% FBS, 2 mM glutamine, nonessential amino acids, 50 nM β-mercaptoethanol, and 1000 U/mL of Leukemia inhibitory factor (LIF) (Hooper et al. 1987). Differentiation was induced by withdrawal of LIF and supplementation of the culture medium with 0.5% DMSO. The human embryonic kidney (HEK 293T) cell line was cultured in DMEM containing 10% FBS, 2 mM L-glutamine, 100 U/mL penicillin, and 100 μg/mL streptomycin. The mouse liver samples were collected from a time course acetaminophen toxicity study (Wang et al. 2009). Total RNA was isolated from cell and tissue samples using the miRNeasy kit (Qiagen) as per the manufacturer's instructions. The extracted RNA was assayed for quality and quantity using an Agilent 2100 Bioanalyzer (Agilent). The RNA samples were prepared for NextGen sequencing based on protocols provided by Applied Biosystems and Illumina.
For immunoprecipitations, the HEK 293T cells were rinsed twice in ice-cold PBS and lysed in NP40 lysis buffer (Invitrogen) containing protease inhibitor cocktail (Pierce) and RNAse inhibitor (Promega) for 30 min on ice. Lysates were cleared by spinning at 13,000 rpm at 4°C for 20 min. Cleared lysates were pre-adsorbed by incubating with Dynabeads protein G beads (Invitrogen) pre-blocked with RNAse-free BSA (Ambion) and yeast tRNA (Ambion) for 30 min at 4°C. Pre-adsorbed lysates were transferred to new tubes containing pre-blocked Dynabeads protein G beads coated with rabbit anti-Ago2 (clone C34C6; Cell Signaling Technology) or mouse anti-GW182 (clone 4B6; Santa Cruz Biotechnology) antibodies and incubated overnight at 4°C with rocking. RNA was isolated from no IP control lysate using miRNeasy kit. Beads were washed according to the manufacturer's protocol. RNA was isolated from washed beads using the miRNeasy kit and sequenced following the protocol provided by the manufacturer (Illumina; small RNA sequencing v1).
Data analysis and database construction
For the data from the Illumina platform, we first consolidated and assembled the results into unique read sequences. Reads that were seen only once, start with the full adapter sequence, or consist of homopolymers were removed. The adapter sequence was located and trimmed by perfect alignment to the first 11 bases of the adapter. The trimmed reads were then aligned to miRBase (www.mirbase.org v13.0 for mouse and v14.0 for human) precursor sequence allowing for one mismatch using the alignment tool PatMaN (Prufer et al. 2008). The reads from ABI's SOLiD platform were processed differently since the sequences were presented in “colorspace.” The SOLiD sequences were processed using the ABI's rna2map software (v0.5) with a maximum of two mismatches in colorspace. When two mismatches in colorspace are adjacent, this corresponds to one mismatch in base-space. The rna2map first discards reads that aligned to a filter file consisting of adapter contaminants, t-RNAs, ribosomal RNAs, and repeat sequences. The remaining reads are aligned to miRNA precursor sequences using the first 18 colorspace bases of the read sequence as a seed. The adapter position is then determined by extending the seed sequence until the adapter can be placed where the mismatch is lowest.
We consolidated all isomirs that perfectly aligned to miRNA precursor sequence from the two sequencing platforms (ABI and Illumina) into a single file using Perl scripts. This was done separately for mouse and human species. The two resulting database files were derived from 10 mouse samples and four human samples, respectively. The files used in database construction are tab-delimited files with columns listing miRNA precursor ID, start and end positions of aligned reads within precursor sequence as well as counts for the individual samples. The precursor sequences and chromosomal locations were obtained from miRBase.
Polymerase chain reaction (PCR)
Based on the sequencing results of mmu-mir-18a and mmu-mir-451, we obtained synthetic isomir RNA sequences from IDT. The levels of synthetic miRNAs were also measured by three different qPCR platforms, Qiagen's miScript system, Exiqon's LNA universal RT system, and Applied Biosystems’ Taqman system. The RT-qPCR steps were processed as recommended by each manufacturer. Briefly, synthetic miRNA was diluted to 200 μM and first strand cDNA was made from 10 pmol of RNA as per each manufacturer's instructions. cDNA was diluted from 1:10 to 1:108 and was then used in each amplification reaction.
For profiling miRNA with Exiqon qPCR plates and the Taqman low density array, the cDNA was generated using either Uni-RT (Exiqon) or Megaplex RT Primer pools (Applied Biosystems). In the case of Taqman qPCR, a 12-cycle pre-amplification step was performed according to the manufacturer's protocol before being dispensed onto miRNA qPCR plates. The data were analyzed using SDS Enterprise Database 2.3 (Applied Biosystems).
SUPPLEMENTAL MATERIAL
Supplemental material can be found at http://www.rnajournal.org.
ACKNOWLEDGMENTS
We thank David Huang, David Baxter, and Sara Nelson for their excellent technical help. In addition, we also would like to express our appreciation to Aimee Dudley and Ilya Shmulevich for their critical reading of the manuscript and stimulating discussions. This work was supported by the ISB-University of Luxembourg program, Systems Biology Center grant (GM076547) from NIH, research contracts from the Battelle Biology and Health Science Initiative (Battelle OP46250), and the Department of Defense (W911SR-07-C-0101 and HDTRA 1-08-C-0023).
Footnotes
Article published online ahead of print. Article and publication date are at http://www.rnajournal.org/cgi/doi/10.1261/rna.2225110.
REFERENCES
- Ach RA, Wang H, Curry B 2008. Measuring microRNAs: Comparisons of microarray and quantitative PCR measurements, and of different total RNA prep methods. BMC Biotechnol 8: 69 doi: 10.1186/1472-6750-8-69 [DOI] [PMC free article] [PubMed] [Google Scholar]
- Ansorge WJ 2009. Next-generation DNA sequencing techniques. New Biotechnol 25: 195–203 [DOI] [PubMed] [Google Scholar]
- Bargaje R, Hariharan M, Scaria V, Pillai B 2010. Consensus miRNA expression profiles derived from interplatform normalization of microarray data. RNA 16: 16–25 [DOI] [PMC free article] [PubMed] [Google Scholar]
- Barroso-del Jesus A, Lucena-Aguilar G, Menendez P 2009The miR-302-367 cluster as a potential stemness regulator in ESCs. Cell Cycle 8: 394–398 [DOI] [PubMed] [Google Scholar]
- Chang J, Nicolas E, Marks D, Sander C, Lerro A, Buendia MA, Xu C, Mason WS, Moloshok T, Bort R, et al. 2004. miR-122, a mammalian liver-specific microRNA, is processed from hcr mRNA and may downregulate the high affinity cationic amino acid transporter CAT-1. RNA Biol 1: 106–113 [DOI] [PubMed] [Google Scholar]
- Chen C, Ridzon DA, Broomer AJ, Zhou Z, Lee DH, Nguyen JT, Barbisin M, Xu NL, Mahuvakar VR, Andersen MR, et al. 2005. Real-time quantification of microRNAs by stem–loop RT–PCR. Nucleic Acids Res 33: e179 doi: 10.1093/nar/gni178 [DOI] [PMC free article] [PubMed] [Google Scholar]
- Chen Y, Gelfond JA, McManus LM, Shireman PK 2009. Reproducibility of quantitative RT-PCR array in miRNA expression profiling and comparison with microarray analysis. BMC Genomics 10: 407 doi: 10.1186/1471-2164-10-407 [DOI] [PMC free article] [PubMed] [Google Scholar]
- Cho WC 2009. MicroRNAs: Potential biomarkers for cancer diagnosis, prognosis and targets for therapy. Int J Biochem Cell Biol 42: 1273–1281 [DOI] [PubMed] [Google Scholar]
- Davis BN, Hata A 2009. Regulation of microRNA biogenesis: A miRiad of mechanisms. Cell Commun Signal 7: 18 doi: 10.1186/1478-811X-7-18 [DOI] [PMC free article] [PubMed] [Google Scholar]
- Davison TS, Johnson CD, Andruss BF 2006. Analyzing micro-RNA expression using microarrays. Methods Enzymol 411: 14–34 [DOI] [PubMed] [Google Scholar]
- Ebhardt HA, Tsang HH, Dai DC, Liu Y, Bostan B, Fahlman RP 2009. Meta-analysis of small RNA-sequencing errors reveals ubiquitous post-transcriptional RNA modifications. Nucleic Acids Res 37: 2461–2470 [DOI] [PMC free article] [PubMed] [Google Scholar]
- Fineberg SK, Kosik KS, Davidson BL 2009. MicroRNAs potentiate neural development. Neuron 64: 303–309 [DOI] [PubMed] [Google Scholar]
- Goff LA, Davila J, Swerdel MR, Moore JC, Cohen RI, Wu H, Sun YE, Hart RP 2009. Ago2 immunoprecipitation identifies predicted microRNAs in human embryonic stem cells and neural precursors. PLoS ONE 4: e7192 doi: 10.1371/journal.pone.0007192 [DOI] [PMC free article] [PubMed] [Google Scholar]
- Griffiths-Jones S, Grocock RJ, van Dongen S, Bateman A, Enright AJ 2006. miRBase: MicroRNA sequences, targets and gene nomenclature. Nucleic Acids Res 34: D140–D144 [DOI] [PMC free article] [PubMed] [Google Scholar]
- Griffiths-Jones S, Saini HK, van Dongen S, Enright AJ 2008. miRBase: Tools for microRNA genomics. Nucleic Acids Res 36: D154–D158 [DOI] [PMC free article] [PubMed] [Google Scholar]
- Hooper M, Hardy K, Handyside A, Hunter S, Monk M 1987. HPRT-deficient (Lesch-Nyhan) mouse embryos derived from germline colonization by cultured cells. Nature 326: 292–295 [DOI] [PubMed] [Google Scholar]
- Hu HY, Yan Z, Xu Y, Hu H, Menzel C, Zhou YH, Chen W, Khaitovich P 2009. Sequence features associated with microRNA strand selection in humans and flies. BMC Genomics 10: 413 doi: 10.1186/1471-2164-10-413 [DOI] [PMC free article] [PubMed] [Google Scholar]
- Kore AR, Hodeib M, Hu Z 2008. Chemical synthesis of LNA-mCTP and its application for microRNA detection. Nucleosides Nucleotides Nucleic Acids 27: 1–17 [DOI] [PubMed] [Google Scholar]
- Liu CG, Spizzo R, Calin GA, Croce CM 2008. Expression profiling of microRNA using oligo DNA arrays. Methods 44: 22–30 [DOI] [PMC free article] [PubMed] [Google Scholar]
- Miller S, Jones LE, Giovannitti K, Piper D, Serra MJ 2008. Thermodynamic analysis of 5′ and 3′ single- and 3′ double-nucleotide overhangs neighboring wobble terminal base pairs. Nucleic Acids Res 36: 5652–5659 [DOI] [PMC free article] [PubMed] [Google Scholar]
- Morin RD, O'Connor MD, Griffith M, Kuchenbauer F, Delaney A, Prabhu AL, Zhao Y, McDonald H, Zeng T, Hirst M, et al. 2008. Application of massively parallel sequencing to microRNA profiling and discovery in human embryonic stem cells. Genome Res 18: 610–621 [DOI] [PMC free article] [PubMed] [Google Scholar]
- Mukhopadhyay R 2009. DNA sequencers: The next generation. Anal Chem 81: 1736–1740 [DOI] [PubMed] [Google Scholar]
- Nelson PT, De Planell-Saguer M, Lamprinaki S, Kiriakidou M, Zhang P, O'Doherty U, Mourelatos Z 2007. A novel monoclonal antibody against human Argonaute proteins reveals unexpected characterisitics of miRNAs in human blood cells. RNA 13: 1787–1792 [DOI] [PMC free article] [PubMed] [Google Scholar]
- Okamura K, Liu N, Lai EC 2009. Distinct mechanisms for microRNA strand selection by Drosophila Argonautes. Mol Cell 36: 431–444 [DOI] [PMC free article] [PubMed] [Google Scholar]
- Prufer K, Stenzel U, Dannemann M, Green RE, Lachmann M, Kelso J 2008. PatMaN: Rapid alignment of short sequences to large databases. Bioinformatics 24: 1530–1531 [DOI] [PMC free article] [PubMed] [Google Scholar]
- Russo G, Giordano A 2009. miRNAs: From biogenesis to networks. Methods Mol Biol 563: 303–352 [DOI] [PubMed] [Google Scholar]
- Sato F, Tsuchiya S, Terasawa K, Tsujimoto G 2009. Intra-platform repeatability and inter-platform comparability of microRNA microarray technology. PLoS ONE 4: e5540 doi: 10.1371/journal.pone.0005540 [DOI] [PMC free article] [PubMed] [Google Scholar]
- Seitz H, Ghildiyal M, Zamore PD 2008. Argonaute loading improves the 5′ precision of both MicroRNAs and their miRNA* strands in flies. Curr Biol 18: 147–151 [DOI] [PMC free article] [PubMed] [Google Scholar]
- Shendure J, Ji H 2008. Next-generation DNA sequencing. Nat Biotechnol 26: 1135–1145 [DOI] [PubMed] [Google Scholar]
- Tomari Y 2009. Biochemical dissection of RISC assembly and function. Nucleic Acids Symp Ser (Oxf) 53: 15. [DOI] [PubMed] [Google Scholar]
- Wang K, Zhang S, Marzolf B, Troisch P, Brightman A, Hu Z, Hood LE, Galas DJ 2009. Circulating microRNAs, potential biomarkers for drug-induced liver injury. Proc Natl Acad Sci 106: 4402–4407 [DOI] [PMC free article] [PubMed] [Google Scholar]
- Wei B, Cai T, Zhang R, Li A, Huo N, Li S, Gu YQ, Vogel J, Jia J, Qi Y, et al. 2009. Novel microRNAs uncovered by deep sequencing of small RNA transcriptomes in bread wheat (Triticum aestivum L.) and Brachypodium distachyon (L.) Beauv. Funct Integr Genomics 9: 499–511 [DOI] [PubMed] [Google Scholar]
- Weidhaas J 2009. Using microRNAs to understand cancer biology. Lancet Oncol 11: 106–107 [DOI] [PMC free article] [PubMed] [Google Scholar]
- Wilson KD, Venkatasubrahmanyam S, Jia F, Sun N, Butte AJ, Wu JC 2009. MicroRNA profiling of human-induced pluripotent stem cells. Stem Cells Dev 18: 749–758 [DOI] [PMC free article] [PubMed] [Google Scholar]
- Wu H, Ye C, Ramirez D, Manjunath N 2009. Alternative processing of primary microRNA transcripts by Drosha generates 5′ end variation of mature microRNA. PLoS ONE 4: e7566 doi: 10.1371/journal.pone.0007566 [DOI] [PMC free article] [PubMed] [Google Scholar]
- Wyman SK, Parkin RK, Mitchell PS, Fritz BR, O'Briant K, Godwin AK, Urban N, Drescher CW, Knudsen BS, Tewari M 2009. Repertoire of microRNAs in epithelial ovarian cancer as determined by next generation sequencing of small RNA cDNA libraries. PLoS ONE 4: e5311 doi: 10.1371/journal.pone.0005311 [DOI] [PMC free article] [PubMed] [Google Scholar]
- Yin JQ, Zhao RC, Morris KV 2008. Profiling microRNA expression with microarrays. Trends Biotechnol 26: 70–76 [DOI] [PubMed] [Google Scholar]
- Zeng Y 2006. Principles of micro-RNA production and maturation. Oncogene 25: 6156–6162 [DOI] [PubMed] [Google Scholar]
- Zhang H, Yang JH, Zheng YS, Zhang P, Chen X, Wu J, Xu L, Luo XQ, Ke ZY, Zhou H, et al. 2009. Genome-wide analysis of small RNA and novel MicroRNA discovery in human acute lymphoblastic leukemia based on extensive sequencing approach. PLoS ONE 4: e6849 doi: 10.1371/journal.pone.0006849 [DOI] [PMC free article] [PubMed] [Google Scholar]
- Zovoilis A, Smorag L, Pantazi A, Engel W 2009. Members of the miR-290 cluster modulate in vitro differentiation of mouse embryonic stem cells. Differentiation 78: 69–78 [DOI] [PubMed] [Google Scholar]


