Abstract
Previously we have characterized two high-valent complexes [LFeIV(µ-O)2FeIIIL], 1, and [LFeIV(O)(O)(OH) FeIVL], 4. Addition of hydroxide or fluoride to 1 produces two new complexes, 1-OH and 1-F. EPR and Mössbauer studies show that both complexes have an S = ½ ground state which results from antiferromagnetic coupling of the spins of a high-spin (Sa = 5/2) FeIII and a high-spin (Sb = 2) FeIV site. 1-OH can also be obtained by a 1-electron reduction of 4, which has been shown to have an FeIV=O site. Radiolytic reduction of 4 at 77 K yields a Mössbauer spectrum identical to that observed for 1-OH, showing that the latter contains an FeIV=O. Interestingly, the FeIV=O moiety has Sb = 1 in 4 and Sb = 2 in 1-OH and 1-F. From the temperature dependence of the S = ½ signal we have determined the exchange coupling constant J (ℋ= J Ŝa·Ŝb convention) to be 90 ± 20 cm−1 for both 1-OH and 1-F. Broken-symmetry DFT calculations yield J = 135 cm−1 for 1-OH and J = 104 cm−1 for 1-F, in good agreement with the experiments. DFT analysis shows that the Sb = 1 → Sb = 2 transition of the FeIV=O site upon reduction of the FeIV-OH site to high-spin FeIII is driven primarily by the strong antiferromagnetic exchange in the (Sa = 5/2, Sb = 2) couple.
1. Introduction
Non-heme diiron enzymes catalyze the oxidation of various substrates by dioxygen.1–4 This class includes methane monooxygenase (MMO) and other related monooxygenases, fatty acid desaturases,5 and Class I ribonucleotide reductases (RNR).6 High-valent intermediates are implicated in the catalytic mechanisms for these enzymes.3, 4, 7 For example, intermediate Q of MMO affects the hydroxylation of methane;8–12 on the basis of EXAFS studies, Q has been proposed to have an [FeIV2(µ-O)2] diamond-core.13 Related diiron(IV) oxidants may be involved in the catalytic cycles of fatty acid desaturases and other diiron monooxygenases resulting from cleavage of the O-O bond in observed peroxo intermediates,14–16 but direct evidence for such diiron(IV) species has not been obtained. On the other hand, intermediate X of RNR has an S = 1/2 FeIII-O-FeIV core that is responsible for the generation of a catalytically essential tyrosyl radical that initiates ribonucleotide reduction.17, 18 A related intermediate has also been observed for the I100W mutant of toluene monooxygenase.19 For all high-valent diiron intermediates described thus far, the iron(IV) centers are in the high-spin configuration.3,8, 17, 19
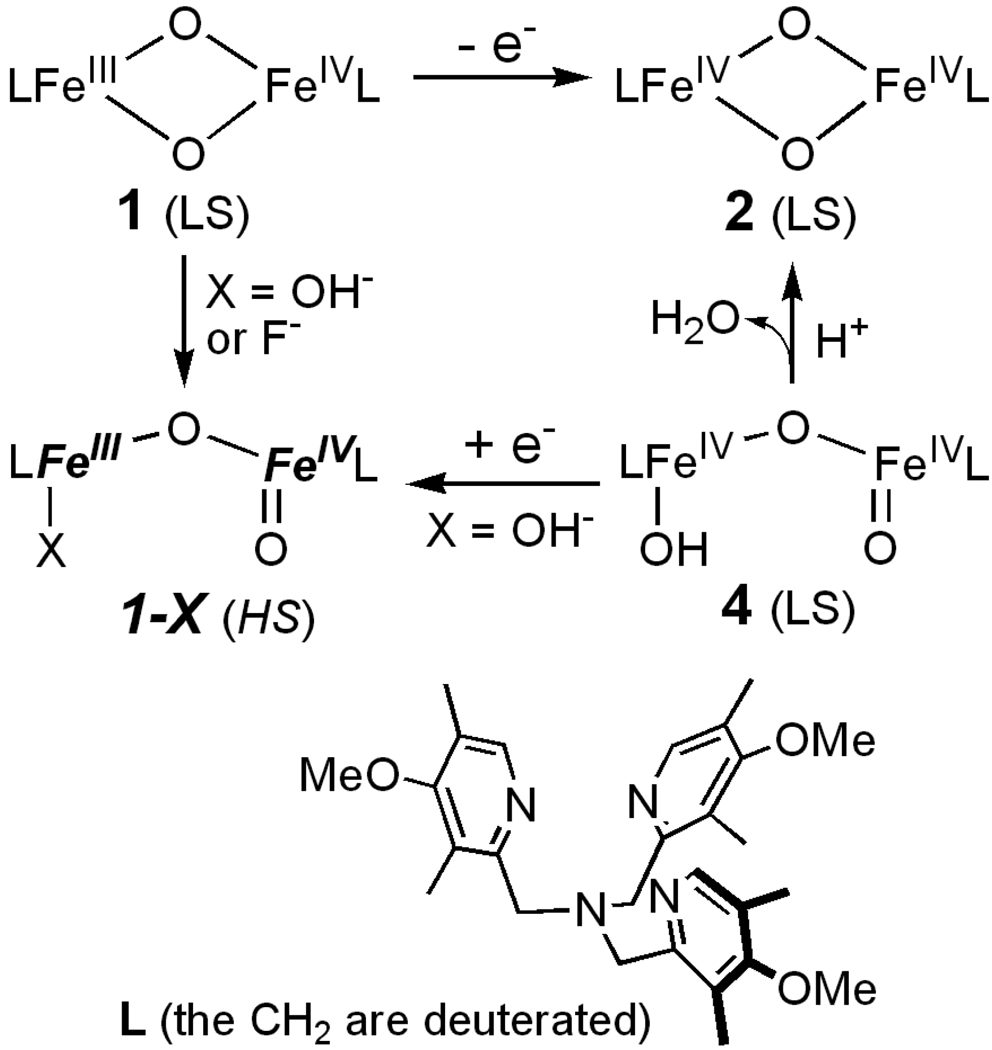
In an effort to provide structural, electronic and functional models for the high-valent states of intermediates Q and X, we have synthesized complexes with [FeIIIFeIV(µ-O)2] (1) and [FeIV2(µ-O)2] (2) diamond-core structures.20–22 The complexes of the present study (scheme 1) use tris(3,5-dimethyl-4-methoxylpyridyl-2-methyl)amine as ligand L, which coordinates to each iron via four N donors. The starting material for generating the high-valent complexes is the diferric precursor [FeIII2(µ-O)(OH)(H2O)(L)2](ClO4)3, 3, in which the two iron sites are high-spin. From this precursor we have been able to generate by reaction with H2O2 the valence delocalized S = 3/2 FeIIIFeIV complex 1,20 the diamond core diamagnetic diiron(IV) complex 2 (local spins Sa = Sb = 1 are antiferromagnetically coupled to S = 0),22 and the open-core complex [HO-FeIV-O-FeIV=O], 4, a complex containing Sa = Sb = 1 sites that are ferromagnetically coupled to yield a system with S = 2.23, 24 EXAFS studies of 4 indicate a 1.65 Å FeIV=O bond and a 3.32 Å Fe-Fe distance (2.73 Å for 2),22 suggesting an open core structure.
Scheme 1.
Interconversion among high-valent diiron complexes. HS (high-spin) and LS (low-spin) refer to the spin states of the individual iron center in each complex.
The iron sites in the nitrogen-rich complexes 1, 2, and 4 are low-spin, which stands in contrast to the high-spin (Sa = 2 or 5/2, Sb = 2) sites in intermediates Q and X.3, 25 The high-spin nature of the iron centers in the enzyme intermediates quite likely derives from the fact that the iron ligands are predominantly oxygen donors.1 Density functional theory (DFT) calculations have suggested that Sb = 2 FeIV sites have higher reactivity than Sb = 1 sites, because the former can effectively employ unoccupied σ-frontier orbitals.26–28 Additional reactivity channels are likely to become available if the diamond core can be opened by transforming one of the bridging oxo ligands, of say 1 or 2, into a terminal oxo functionality.
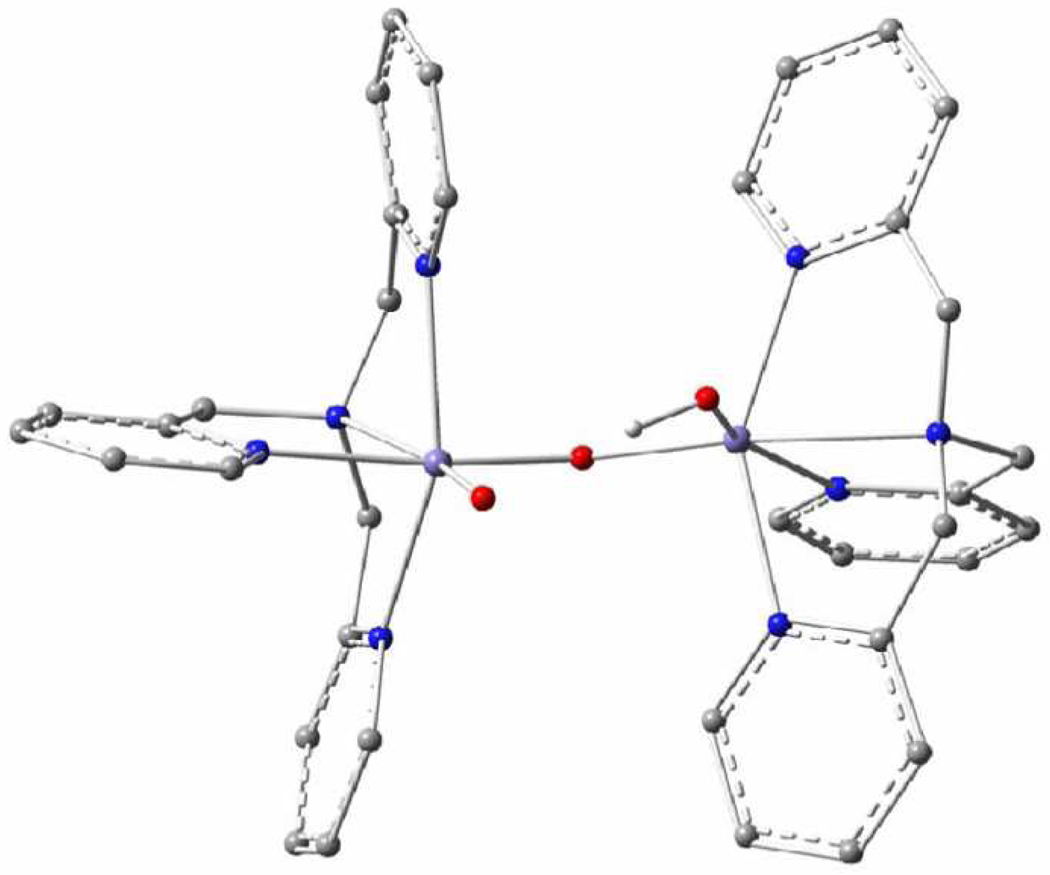
We have recently succeeded29 in transforming 1 into a new complex, 1-OH, with a valence-localized [HO-FeIII-O-FeIV=O] open core for which the iron sites are high-spin (Figure 1). The new short-lived intermediate 1-OH oxidizes the C–H bond of 9,10-dihydroanthracene a million-fold faster than 1. More recently we have also been able to obtain by treatment of 1 with fluoride the related open-core complex 1-F, which has an [F-FeIII-O-FeIV=O] core that is closely related to that of 1-OH. Here we report extensive Mössbauer and EPR studies of the S = ½ ground states of 1-OH and 1-F. By variable temperature EPR we have determined the exchange coupling constants J (in ℋ= J Ŝa·Ŝb, Sa = 5/2, Sb = 2) to be ≈ 90 cm−1 for both 1-OH and 1-F. Radiolytic reduction experiments of 4 at 77 K, described below, yielded Mössbauer spectra essentially identical to those of 1-OH, suggesting that 4 and 1-OH have the same structure, i. e. the high-spin FeIV site in 1-OH has a terminal oxo group. We also report DFT calculations that give insight into the electronic structure of 1-OH and 1-F. In particular, these calculations suggest that exchange interactions are an essential determinant for the transition from Sb = 1 in 4 to Sb = 2 in 1-OH and 1-F.
Figure 1.
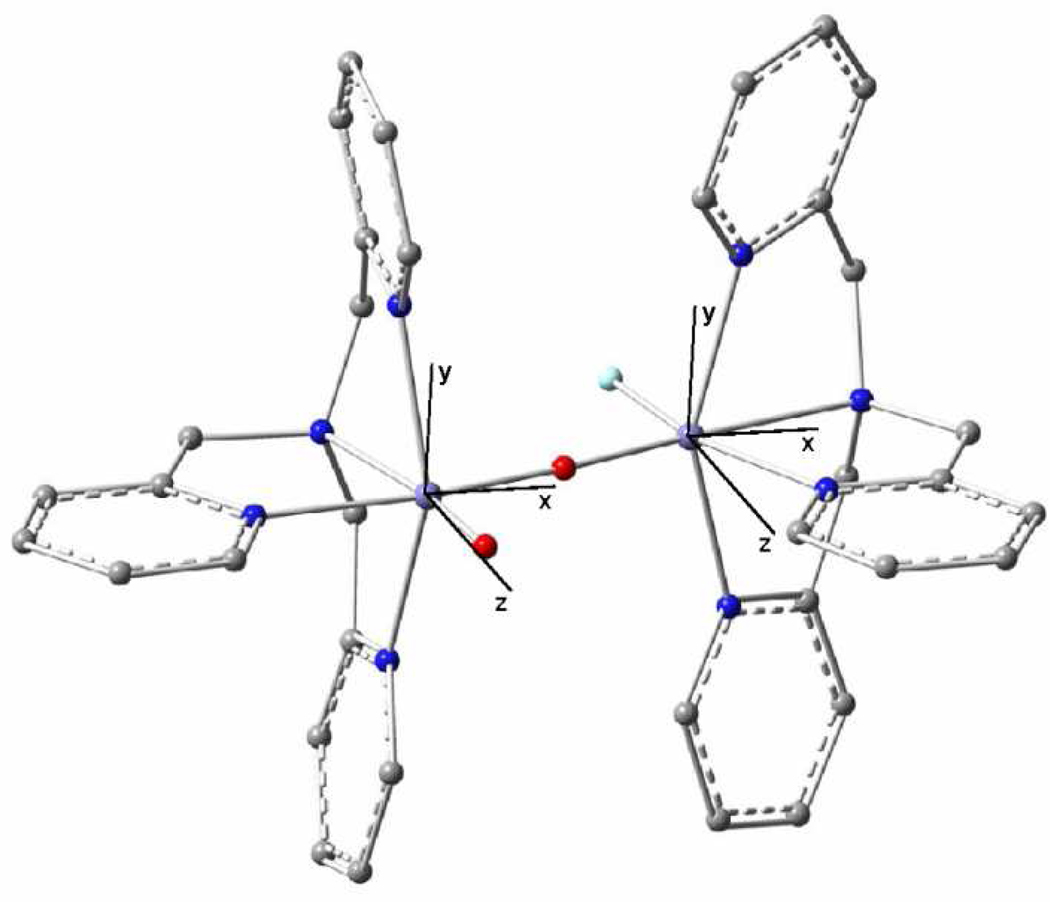
DFT-optimized structure of 1-OH. In the structure optimization, the Me- and MeO-substituents of ligand L have been replaced by hydrogen atoms. This optimized structure is similar to that of diiron(IV) complex 4.
2. Materials and Methods
2.1 Materials
Tetrabutylammonium fluoride (Bu4NF) hydrate purchased from Aldrich (98%) was dried under vacuum at 40 °C.30 Butyronitrile (PrCN, 99%+) purchased from Aldrich was purified and dried with reported procedures.31 Anhydrous CH2Cl2 and MeCN were purchased from Aldrich and used as received. Complexes 1, 4 and 1-OH were prepared following reported procedures.22,29 The [FeIII(L)Cl2]ClO4 complex was synthesized by modification of a reported procedure for the preparation of the analogue supported by the tris(2-pyridymethyl)amine (TPA) ligand.32 EA: Calcd. for [Fe(L)Cl2]ClO4·H2O (C27H38Cl3FeN4O8): C, 45.75; H, 5.40; N, 7.91; Cl, 15.00. Found: C, 45.57; H, 5.34; N, 7.87; Cl, 14.86.
2.2 Generation of 1-F
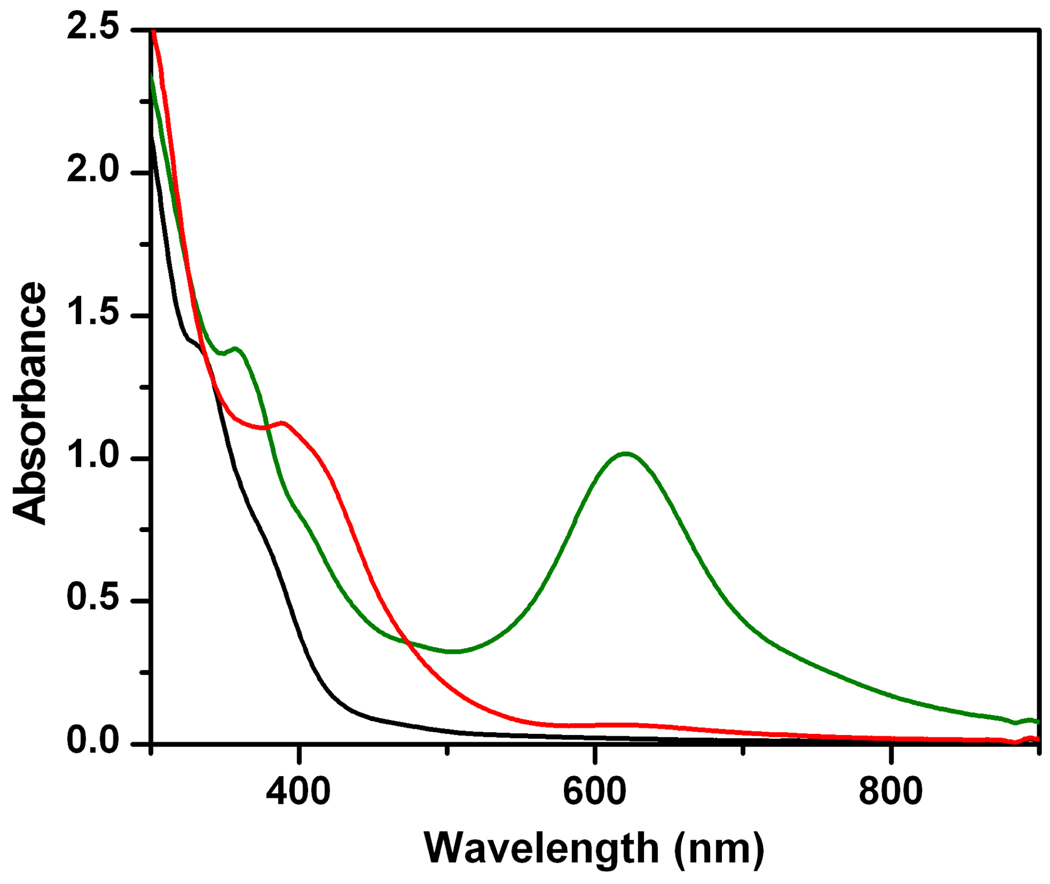
To complex 1, solutions (in mixtures of 3:1 PrCN/MeCN or CH2Cl2/MeCN to promote glass formation upon freezing) maintained at −80 °C in a UV-vis cell were added 1.5 equivalents of Bu4NF. The decay of 1 and formation of 1-F were respectively monitored by the absorption decrease at 620 nm and the absorption increase at 385 nm.
2.3 Preparation of EPR and Mössbauer Samples
The frozen samples for EPR and Mössbauer studies typically contain 1.6 to 2.4 mM iron (0.8 mM to 1.2 mM diiron species) in either 3:1 CH2Cl2/MeCN or PrCN/MeCN mixed solvents. The samples for Mössbauer were prepared with the latter mixed solvent and contained 95% 57Fe isotope. 3:1 MeOH/MeCN was used for preparing the samples for radiolytic reduction, as solvents with high polarity increase the reduction efficiency.
2.4 Physical Methods
Mössbauer spectra were recorded with two spectrometers using Janis Research Super-Varitemp dewars that allow studies in applied magnetic fields up to 8.0 T in the temperature range from 1.5 to 200 K. Mössbauer spectral simulations were performed using the WMOSS software package (WEB Research, Edina, MN). Isomer shifts are quoted relative to iron metal at 298 K. Perpendicular (9.63 GHz) mode X-band EPR spectra were recorded on a Bruker ESP 300 spectrometer equipped with an Oxford ESR 910 liquid helium cryostat and an Oxford temperature controller. The microwave frequency was calibrated with a frequency counter and the magnetic field with an NMR gaussmeter. The quantification of all signals was relative to a Cu-EDTA spin standard. The sample temperature of the X-band cryostat was calibrated with a carbon glass resistor (LakeShore CGR-1–1000) placed at the position of the sample in an EPR tube. The EPR simulation software (SpinCount) was written by one of the authors. All simulations are least-squares fits of the experimental spectra generated with consideration of all intensity factors, which allows computation of simulated spectra for a specified sample concentration. The simulations, therefore, can be used for a quantitative determination of the signal intensities for each complex. The Windows software package (SpinCount) is available for general application to any mono- or dinuclear metal complex by contacting M. P. Hendrich. Samples were γ-irradiated (60Co; total dose of 50 kGy) at the γ-irradiation facility of the Breazeale nuclear reactor at Pennsylvania State University. During radiation, samples were maintained at 77 K by immersion in liquid N2.
In order to generate the data of section 3.7, we have studied the power saturation at each temperature, generated temperature calibration curves using a copper standard and a carbon glass resistor, and repeatedly checked data points that seemed to lie unexpectedly high or too low.
DFT calculations were performed using Becke’s three-parameter hybrid functional (B3LYP) and basis set 6–311G provided by the Gaussian 03 (revision E.01) software package.33 The 57Fe hyperfine parameters were calculated using the properties keyword of the Gaussian code. 57Fe isomer shifts, δ, were evaluated from the DFT charge density at the iron nucleus using the calibration give by Vrajmasu et al.34 The coordinates for the optimized structures of the broken-symmetry states for 1-OHm and 1-Fm are listed in Tables S4 and S5 of the Supporting Information.
3. Results
3.1 Formation of the Open-Core FeIIIFeIV Complexes 1-X
Previously,29 we showed that addition of 3 equivalents of Bu4NOH to complex 1 at −60 °C resulted in the formation of a new species 1-OH (Scheme 1). 1-OH exhibits an absorption feature near 450 nm and an isotropic S = ½ EPR signal at g = 2.00. The yield of 1-OH estimated by double integration of the g = 2 EPR signal was only 40% with respect to 1, presumably due to its short lifetime at −60 °C, as complete decay occurred within 10 minutes. Attempts to generate 1-OH by this method at lower temperatures were hampered by problems with incomplete conversion and ice formation from water present in the Bu4NOH, which is obtained as a tridecahydrate. Alternatively, 1-OH can be generated in ~72% yield through one-electron reduction of the [HO-FeIV-O-FeIV=O] complex 4 at −80 °C. 1-OH generated by reduction of 4 at −80 °C also has a longer lifetime (~1 hour), which facilitates trapping and characterization of this fleeting intermediate.29 However, the presence of a diferric contaminant (~37% of the total iron) in the samples of 4 reduced the overall yield of 1-OH to ~52% with respect to all iron species.
We have found that addition of Bu4NF to 1 led to the formation of a species closely related to 1-OH. We postulate that F−, like OH−, binds to 1 and converts it to the open-core complex 1-F (Scheme 1). Because Bu4NF could be dried to a virtually anhydrous form,30 its use avoided the problems associated with Bu4NOH·30H2O at −80 °C. Similar to 1-OH, 1-F shows a near UV absorption feature with λmax at 385 nm (Figure 2). 1-F was generated in ~74% yield with respect to all iron species, and provided us with a substantially purer sample that facilitated deconvolution of the Mössbauer spectra of the valence-localized FeIIIFeIV complexes. Moreover, the appearance of 19F superhyperfine splitting in the EPR spectra of 1-F (see below) would be solid evidence for F− binding to 1. Due to the spectral similarities between 1-F and 1-OH, we expect the two complexes to have similar valence-localized X-FeIII-O-FeIV=O open cores.
Figure 2.
Spectrophotometric changes observed upon formation and decay of 1-F. The green, red, and black lines respectively represent the spectra of 1, 1-F, and the decay product (after 0.5 hour at −80 °C). Solvent: 3:1 CH2Cl2-MeCN.
3.2 EPR Studies
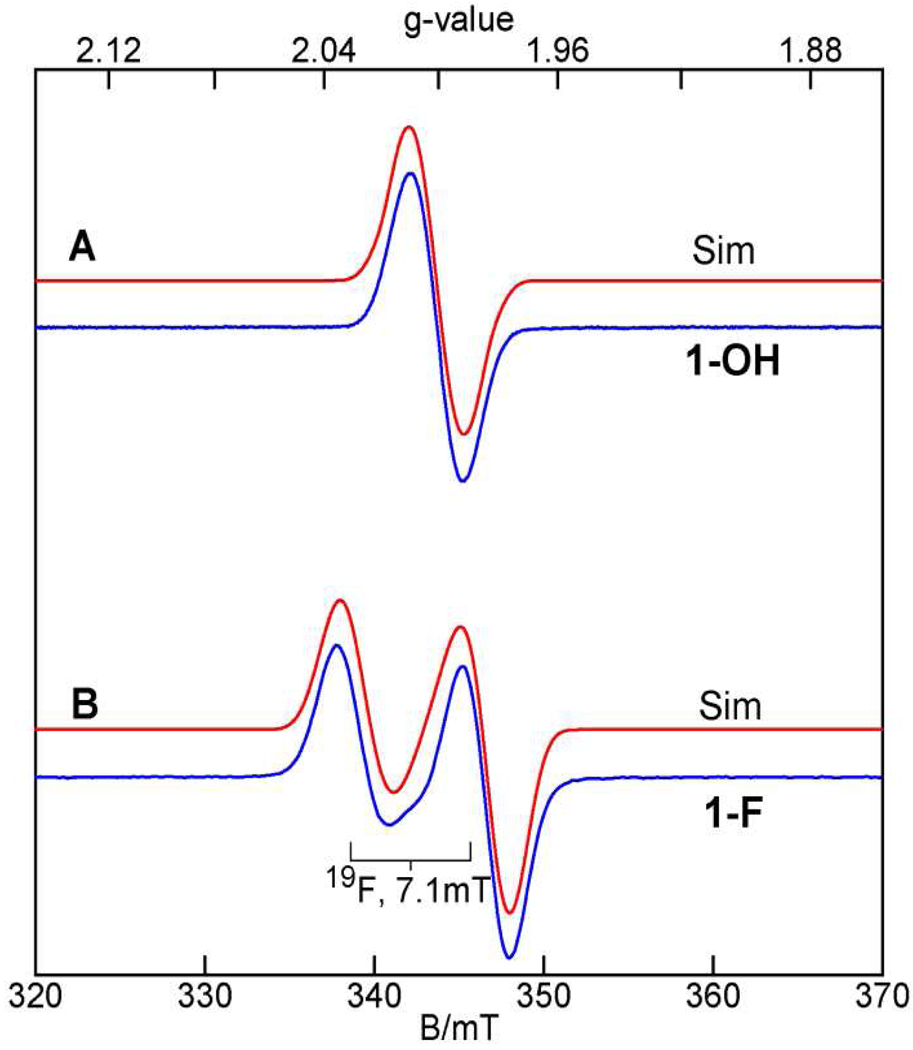
The EPR spectra of 1-OH and 1-F were studied in either 3:1 CH2Cl2/MeCN or 3:1 PrCN/MeCN (PrCN = butyronitrile), while only the latter solvent system was used for preparing Mössbauer samples. Both solvent mixtures form frozen glasses, which give rise to sharper EPR and Mössbauer signals, facilitating the spectral analysis. The EPR spectra of 1-OH are essentially identical in both solvent mixtures, suggesting that its structure is not affected by the difference in solvents. The CH2Cl2/MeCN mixture, however, produced samples of higher EPR purity (> 96%) and was therefore used for most of the studies (we emphasize that the term “EPR purity” refers to the intensity of signals of interest relative to the combined intensity of all EPR signals). A typical EPR sample of 1-OH was prepared by first reacting 1.2 mM diferric precursor with H2O2 to yield 0.9 mM 4 (based on the intensity of its 705-nm band with an ε of 2500 M−1 cm−1)24 and 0.3 mM diferric material (see Mössbauer spectra below), followed by treatment with 0.9 mM ferrocene. The sample of Figure 3A had an S = ½ spin concentration of 0.65 mM, suggesting a 4 → 1-OH conversion yield of 72%. The main contaminant (diferric species) is EPR silent and does not affect the spectral analysis.
Figure 3.
X-band (9.63 GHz) EPR spectra of (A) 1-OH and (B) 1-F in 3:1 CH2Cl2-MeCN. The red lines are least-squares fits with (A) g = 2.002 and (B) = (1.99, 2.01, 2.01), and five equivalent 14N nuclei with (A) A14N = 21 MHz and (B) A14N = 16 MHz. The fit in (B) includes one 19F nucleus with A = (92, 113, 253) MHz where the coordinate system is suggested by DFT calculations described below. The small shoulder near 342 mT in (B) belongs to a minor contaminant. Experimental parameters: temperature, 27 K; microwave power, (A) 2 µW, (B) 20 µW; modulation, 0.3 mT.
Figure 3A shows an X-band EPR spectrum of 1-OH in 3:1 CH2Cl2-MeCN recorded at 35 K. 1-OH exhibits an S = 1/2 resonance centered at g = 2 with a peak-to-trough width of 3.4 mT. Depending on line width assumptions, the spectrum can be fitted with various combinations of g-values that are confined to the range 1.99 – 2.01. Together, the two iron sites of 1-OH have 8 nitrogen ligands (Figure 1), and our DFT calculations (see Figure S5 and Table S3) suggest that 5 of these nitrogens have anisotropic magnetic hyperfine coupling constants of comparable magnitude and anisotropy, with A-tensor components ranging from 14 to 24 MHz, implying that unresolved 14N hyperfine couplings contribute substantially to the width of the resonance. We have least squares fitted (red line) the spectrum of Figure 3A with an isotropic g-tensor and a hyperfine contribution from five equivalent isotropic 14N A-tensors; the results are listed in the caption of Figure 3. The best fit shown in Figure 3A was obtained by using A14N = 21 MHz, which is consistent with the range of A-values from DFT calculations.
Figure 3B shows an EPR spectrum of 1-F. Like 1-OH, this intermediate also has g-values near g = 2. The g = 2 feature, however, is split by substantial 19F hyperfine interactions,35 showing that fluoride not only causes core isomerization of 1 (see below), but becomes incorporated into the EPR-active complex. Analysis of the spectrum of Figure 3B in a similar manner as for 1-OH afforded a least-squares fit to the spectrum (see red line) with the parameters quoted in the caption of Figure 3. These parameters are very similar to those associated with 1-OH, suggesting similar electronic structures for the two complexes. The g and A19F tensors are found to be nearly axial, and as with 1-OH, the fit includes five equivalent isotropic 14N A-tensors with A14N = 16 MHz. To our knowledge the 19F hyperfine tensor deduced to be on the FeIII site is the largest observed to date for an iron complex (e.g., compare Ax ≈ Ay ≈ 63 MHz, Az = 120 MHz for metmyoglobin fluoride).35 As the Mössbauer data reveal the spin structure of 1-OH and 1-F, we defer variable temperature EPR studies to section 3.7.
3.3 Mössbauer Spectra of 1-F
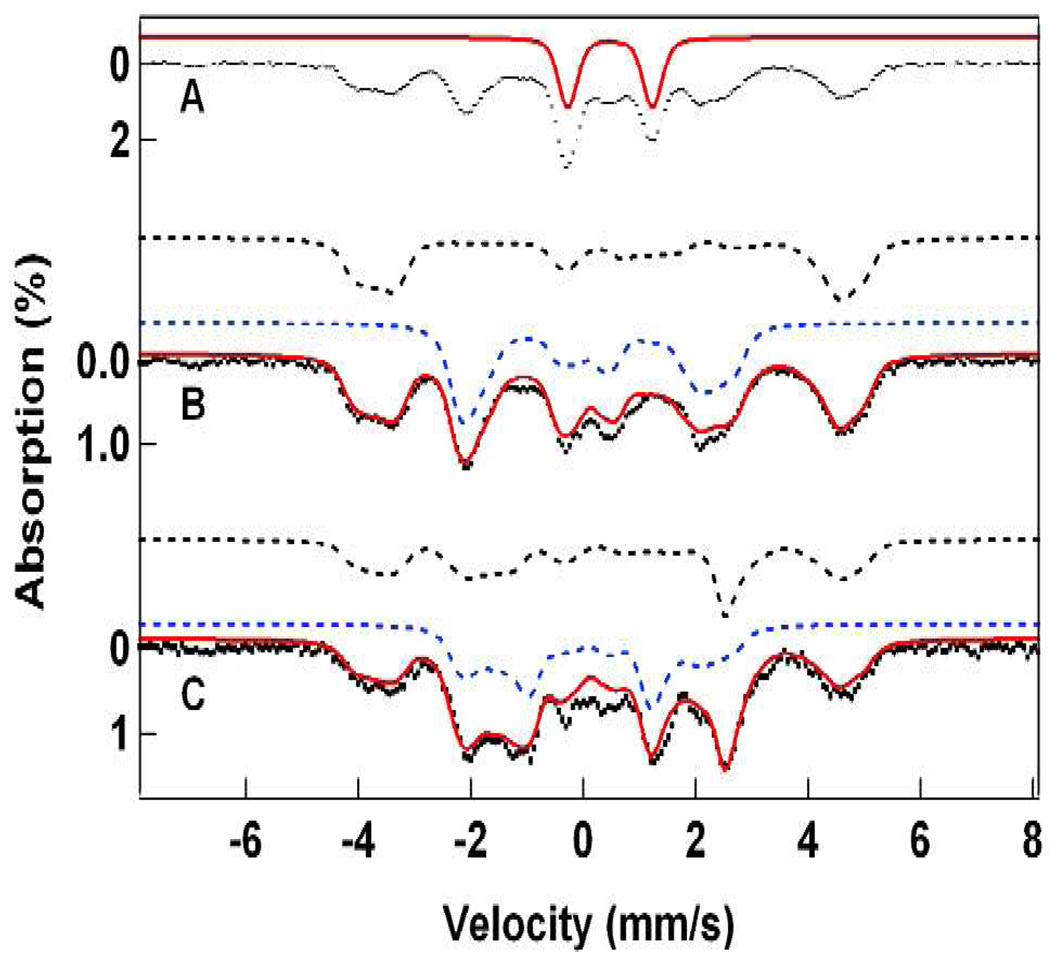
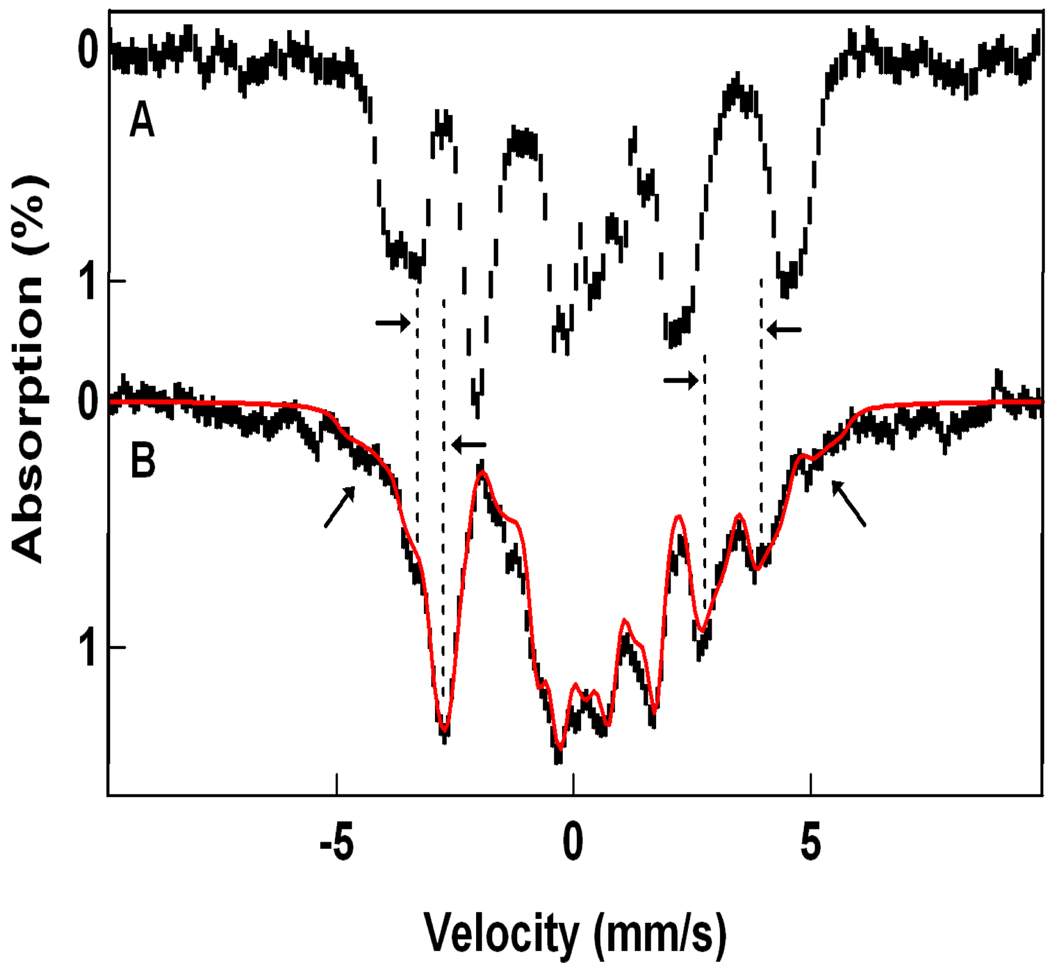
Figure 4 shows 4.2 K Mössbauer spectra of 1-F in 3:1 PrCN/MeCN recorded in fields of 50 mT applied parallel (A, B) and perpendicular (C) to the observed γ-rays. The central doublet in Figure 4A with ΔEQ = 1.5 mm/s and δ = 0.45 mm/s (≈ 22% of total Fe) belongs to a diferric decay product. The spectra of Figures 4B and C, representing 1-F, were obtained by subtracting the contribution of the diferric contaminant from the raw data. The remainder of the absorption belongs to two spectroscopic components (each ≈ 37% of Fe) exhibiting paramagnetic hyperfine structure. The field dependence36 proves that both components are associated with the S = ½ species of Figure 3B. Data recorded in strong applied magnetic fields (see Figure 5) show that the spectral component with the larger splitting, Fea, has a magnetic hyperfine tensor, A, with negative components whereas the second site, Feb, exhibits positive A-values (in the S = 1/2 representation we use capital letter for the magnetic hyperfine tensors). This type of behavior is well documented and understood for the antiferromagnetically coupled FeIIFeIII sites of [Fe2S2]+ ferredoxins,37–39 FeIIIFeIV intermediate X of ribonucleotide reductase,17 and three FeIIIFeIV model complexes (see Scheme 2 and Table 1).40–42
Figure 4.
Mössbauer spectra of 1-F in 3:1 PrCN/MeCN recorded at 4.2 K in 50 mT fields applied parallel (A, B) and perpendicular (C) to the observed γ rays. The red line in (A) outlines the contribution of a diferric species (22% of Fe; a decay product). The spectra in (B) and (C) were obtained by removing the diferric species from the raw data. The solid red lines in (B) and (C) are spectral simulations for 1-F based on eq 1 using the parameters listed in Table 1. The dashed lines drawn above the data show the contributions of the FeIII (black) and FeIV (blue) sites.
Figure 5.
4.2 K Mössbauer spectra of 1-F recorded in a parallel field of 50 mT (A) and 4.0 T (B). The spectrum shown in (A) is the low field spectrum of Figure 4B. The horizontal arrows indicate the movement of the absorption lines with increasing applied field. Outward moving lines belong to the FeIV site. The slanted arrows in (B) mark shoulders belonging to the absorption of the FeIII site in Ms = + ½ state of the ground doublet. The red solid line is a spectral simulation with eq 1 using the parameters of Table 1.
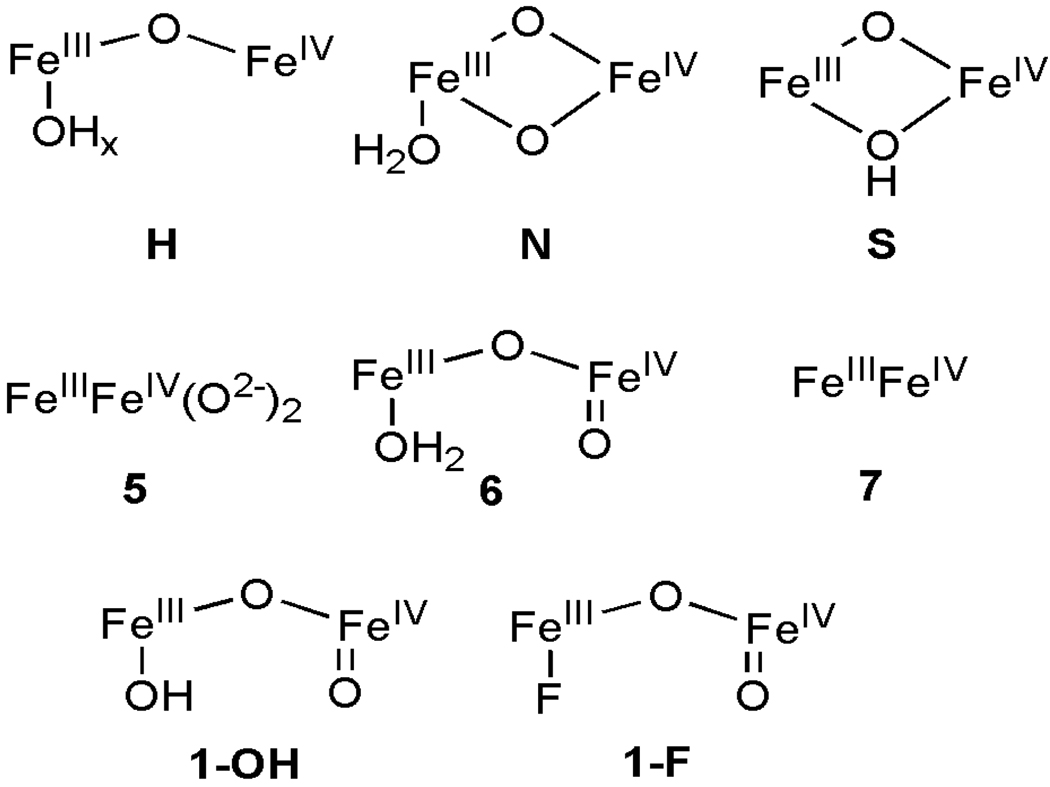
Scheme 2.
The diiron core structures proposed for intermediate X (top) and related synthetic FeIII-FeIV models. Models H, N, and S for X were respectively proposed by Hoffman,53,54 Noodleman,55 and Solomon.56 Due to the limited spectroscopic information, no specific core structure could be proposed for 5 and 7.
Table 1.
57Fe hyperfine parameters of 1-F and 1-OH and related complexes. Experimental 4.2 K data were analyzed with eq 1.
| Site | System | δ (mm/s) |
ΔEQ (mm/s) |
η | Ax/gnβn (T)a |
Ay/gnβn (T)a |
Az/gnβn (T)a |
Aiso/gnβn (T) |
|---|---|---|---|---|---|---|---|---|
| FeIII | 1-F | 0.45 | 1.50 | 4.3 | −52(2)b | −49(2) | −46(2) | −48.7 |
| 1-OH | 0.40 | −0.60 | 5.1 | −52(2) | −52(2) | −43(2) | −49.2 | |
| RNR R2 Int. Xc | 0.56 | −0.90 | 0.5 | −54.1 | −52.6 | −53.4 | −53.4 | |
| 5d | 0.48 | 1.60 | 1.0 | −47 | −47 | −47 | −47 | |
| 6e | 0.50 | 1.30 | 1.6 | −49 | −49 | −49 | −49 | |
| 7f | 0.56 | 0.90 | −0.3 | −55 | −51 | −55 | −53.7 | |
| FeIV | 1-F | 0.10 | 0.60 | −0.7 | 27(2)b | 19(2) | 31(2) | 25.5 |
| 1-OH | 0.09 | −0.40 | 10.0 | 29(2) | 18(3) | 23(2) | 23.6 | |
| RNR R2 Int. Xc | 0.26 | −0.60 | 2.7 | 20.0 | 26.8 | 26.8 | 24.5 | |
| 5d | 0.08 | 0.50 | 1.0 | 15 | 27 | 27 | 23 | |
| 6e | 0.10 | 1.14 | 0.1 | 17 | 25 | 20 | 21 | |
| 7f | 0.19 | 0.80 | −1.0 | 19 | 27 | 17 | 21 | |
Because the g-tensors of 1-OH and 1-F are isotropic, the coordinates x, y, and z of the FeIII and FeIV sites cannot be related experimentally for samples containing randomly oriented molecules. However, they become correlated through the De/J mixing when the data are analyzed with eq 4. We have labeled the coordinates such that they agree best with the DFT results. The coordinates of complexes 5–7 and intermediate X have not been correlated and are probably better labeled with 1, 2, 3 rather than x,y,z.
The uncertainties of the individual A-tensor components are estimated to be ± 2 T. However, the Aiso values are better than ± 0.5 T.
Data from ref. 17.
Data from ref. 40.
Data from ref. 42.
Data from ref. 51.
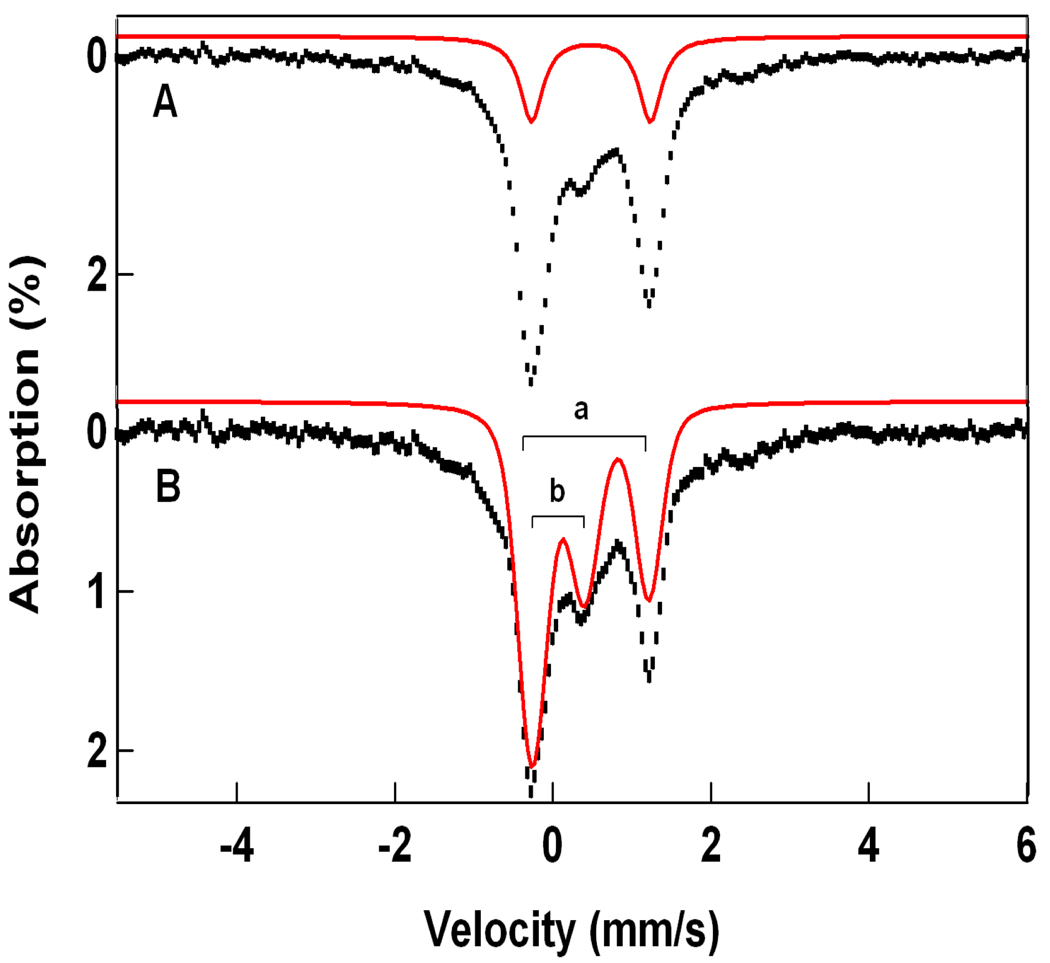
Figure 6A shows a 100 K spectrum of 1-F. At this temperature the relaxation rate of the electronic spin is larger than the nuclear precession frequencies, with the consequence that magnetic hyperfine interactions are (mostly) averaged out; our EPR power saturation studies show that the fast relaxation at 100 K reflects a dominant Raman process.43 As can be seen from the persistence of some broad wings, the system is not quite in the fast relaxation regime (We have tried to get into a faster relaxation regime by warming up the sample to 140 K. Surprisingly, however, the recoilless fraction decreased by almost a factor 5 between 100 K and 140 K and a good spectrum could not be collected. Moreover, long data collection at 140 K leads to substantial decay of 1-F; this complex decays even at 77 K under storage with a half life of roughly six months. We have no indication that 1-OH is unstable at 77 K.). However, we were able to decompose the 100 K zero field spectrum into three doublets corresponding to three different iron environments. The red curve in Figure 6A outlines the diferric component observed in the 4.2 K spectra. Subtracting this component yielded the spectrum of Figure 6B, which contains two doublets with ΔEQ(a) ≈ 1.5 mm/s, δ(a) ≈ 0.45 mm/s and ΔEQ(b) ≈ 0.60 mm/s, δ(b) ≈ 0.10 mm/s. The values for δ(a) unambiguously establishes that Fea is high-spin ferric, Sa = 5/2 (the value for aiso/gnβn = −20.9 T, see below, strongly supports this assignment). Since the cluster spin is S = ½, it follows that Sb = 2, and by taking into account the low value for δ(b) it follows that site b is high-spin FeIV (a monomeric S = 1 FeIV=O complex with the same TPA ligand has δ = 0.01 mm/s; see Table 1 of ref 23).
Figure 6.
Mössbauer spectrum (A) of 1-F recorded at 100 K in a parallel field of 50 mT. The red line in (A) indicates the contribution of a 22% diferric contaminant (same as in Figure 4A). Subtraction of this contaminant yields the spectrum (hashed) of 1-F, shown in (B). The solid line in (B) is the superposition of a doublet representing the FeIII site (doublet a) with a doublet (b) belonging to the FeIV site of 1-F. The broad wings indicate that the electronic system has not yet attained the fast fluctuation limit.
We have analyzed the low-temperature Mössbauer spectra of 1-F and 1-OH with the S = ½ spin Hamiltonian
| (1) |
| (2) |
On the basis of the EPR data of Figure 3, we have chosen g = 2 in the electronic Zeeman term. As the g-tensor is nearly isotropic, the Mössbauer spectra (of our frozen solutions) do not correlate to the spatial orientations of the tensors of the two iron sites (We will obtain below, however, a reasonable correlation by working with the full exchange Hamiltonian). The ground state described by eq 1 is the result of antiferromagnetic exchange coupling, ℋ= J Ŝa· Ŝb, between the high-spin FeIII site and the high-spin FeIV site. Using the appropriate spin projection factors (well known from analyses of [Fe2S2]+ ferredoxins)38 we can relate the A-tensors of the coupled S = ½ state to the local a-tensors of the individual sites by
| (3) |
Eq 3 holds only in the strong coupling limit (see below). The solid lines in Figures 4–6 are the result of spectral simulations for 1-F based on eq 1 using the parameters listed in Table 1; spectra of the individual sites are outlined by the dashed lines. In general, the magnetic hyperfine interactions of the high-spin FeIII sites are isotropic; noteworthy exceptions are the ferric sites of exchange coupled [Fe2S2]+ clusters37, 38 and diiron(II,III) centers.44, 45 In order to account for the line shape of the FeIII site of 1-F, we had to allow for considerable anisotropies of the A-tensor, as indicated in Table 1 (we explain this observation below). The value for the local (low case letter) aiso/gnβn = (ax+ay+az)/3gnβn = −20.9 T (corresponding to aiso = −28.6 MHz) agrees within 2% with the aiso values we have observed for monomeric high-spin ferric species involving TPA-type ligands; for data on [FeIII(L)Cl2]+ see Figure S3 in Supporting Information.
Given that ΔEQ of the FeIV site is quite small, the line shapes of its low temperature spectra depend essentially on the anisotropy of the A-tensor. After subtracting the diferric contaminant and the contribution of the FeIII site, we have least squares fitted the spectra of the FeIV site making various assumptions about the range of the A-tensor components. The best parameter set for the FeIV site is listed in Table 1, where we have used coordinate labels x, y, and z that relate the measured 57Fe (and 19F) A-tensors best to the results of our DFT calculations. Note that the A-tensor of the FeIV site is nearly axial and that the largest component of the electric field gradient tensor is perpendicular (along x, y) to the “symmetry” axis of the A-tensor.
Eq 3 shows that the magnetic hyperfine tensor of the FeIV site changes sign when expressed in the coupled state (the minus sign in eq 3 results because the smaller spin of the pair, Sb, is oriented antiparallel to the system spin S). Consequently, the magnetic hyperfine splittings of the FeIII site will decrease with increasing applied field (the components of aa are negative) while those of the FeIV site increase, as seen experimentally in the 4.0 T spectrum of Figure 5.
3.4 Mössbauer Spectra of 1-OH
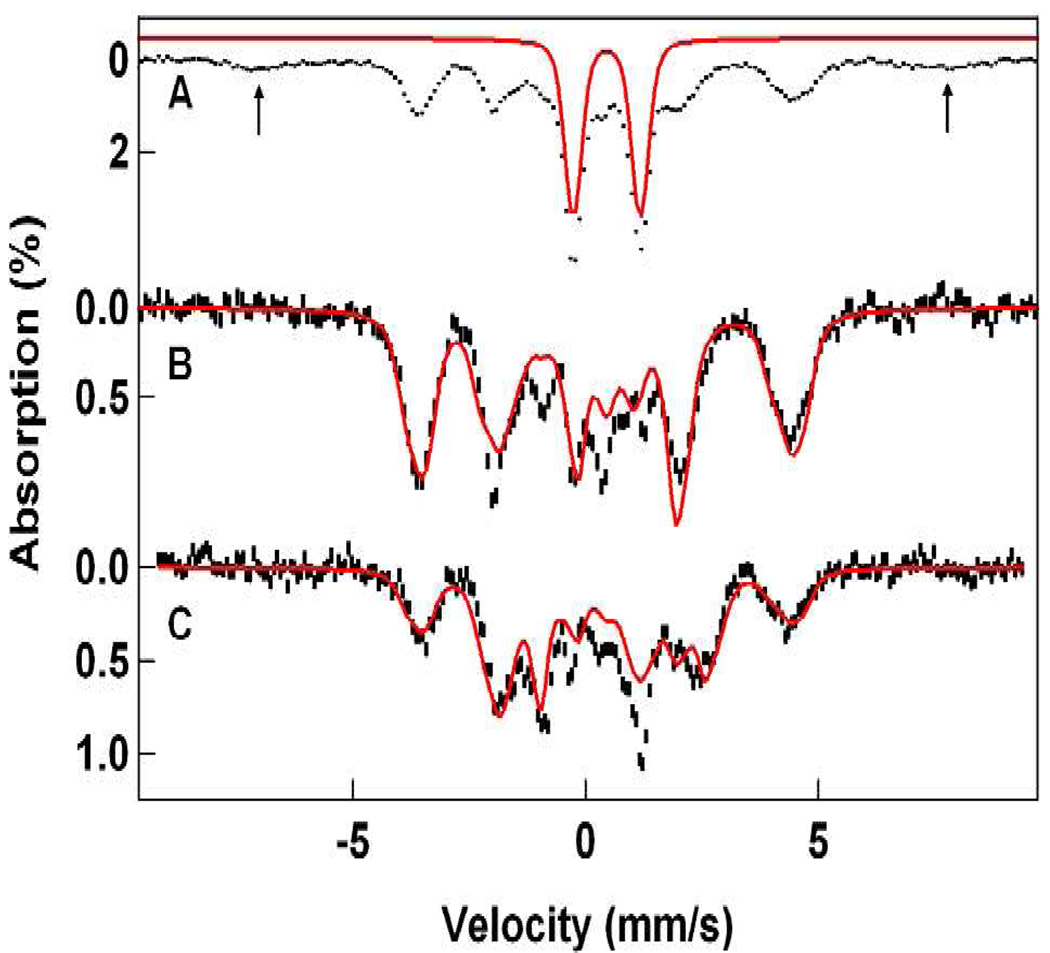
The Mössbauer sample of 1-OH was prepared by 1e–reduction of the diiron(IV) complex 4,23 which in turn was obtained by reaction of diferric complex 3 with H2O2. The spectra of 1-OH contain a high-spin FeIII contaminant (12% of Fe), representing a collection of species, with broad features (its outer lines are marked by arrows in Figure 7A). Its Mössbauer features are characteristic of precipitated and aggregated FeIII and the samples did not exhibit EPR features attributable to magnetically isolated high-spin FeIII. Figure 7A shows a 4.2 K spectrum of a sample in 3:1 PrCN/MeCN containing ca. 52% 1-OH; the solid line outlines the contribution of a 37% diferric contaminant (already present in the diiron(IV) “starting material”), which we have removed from the raw data together with the high-spin FeIII species to obtain the spectrum of Figure 7B. The transverse field spectrum of Figure 7C was prepared similarly. The solid lines in (B) and (C) are spectral simulations using the parameters listed in Table 1.
Figure 7.
Mössbauer spectra of 1-OH in 3:1 PrCN/MeCN recorded at 4.2 K in 50 mT fields applied parallel (A, B) and perpendicular (C) to the observed γ radiation. The red line in (A) outlines the spectrum of a diiron(III) contaminant; its contribution has been removed in (B) and (C). The solid lines in (B) and (C) are spectral simulations based on eq 1 using the parameters listed in Table 1. See also Figure 8. The arrows in (A) mark the outer lines of a high-spin ferric contaminant.
3.5 Mössbauer Analysis Using the Full Spin Hamiltonian
In the literature, the low temperature Mössbauer and EPR spectra of S = 1/2 FeIIIFeII and FeIIIFeIV complexes with Sa = 5/2 and Sb = 2 are often described by eq 1. Description by the effective S = ½ Hamiltonian, however, is correct only in the strong coupling limit, J ≫ |Da, Db|, where Da and Db are the zero-field splitting parameters (ZFS) of Fea and Feb. For |Da, Db|/J ≥ 0.1 the ground state properties are noticeably modified through mixing of the ground state with S = 3/2 and 5/2 excited states of the spin ladder by ZFS terms, an effect sometimes referred to as D/J mixing. Mixing is recognized by the observation of sizable anisotropies of Aa in eq 1, as in the case for 1-OH and 1-F; Ab gets modified as well, but as Ab is intrinsically anisotropic the effects of D/J mixing are difficult to recognize. In order to compare the FeIV A-tensor with DFT calculations (which ignore spin-orbit coupling), one has to remove the contributions from D/J mixing. This can be accomplished by analyzing the data with the full exchange Hamiltonian
| (4) |
Using a second-order perturbation approach, Sage et al.44 have analyzed D/J mixing for the S = ½ diiron(III,II) state of purple acid phosphatase. The crucial quantity for mixing is the quantity De/J, where De is a traceless effective ZFS tensor. For collinear ZFS tensors for the two sites, as we have assumed in eq 4, the diagonal components of De can be written as
| (5) |
| (6) |
While inclusion of D/J mixing introduces at least 5 additional unknowns, the present situation can be simplified because Db is expected to dominate in eqs 5 and 6. Thus, D ≈ +10 cm−1 and E/D ≈ 0 have been reported for the octahedral sites of the S = 2 complexes (H2O)5FeIV=O46 and FeIV=O intermediate J of taurine:αKG dioxygenase,47 and the Da values are expected to be smaller than 1 cm−1. Therefore, eqs 5 and 6 practically reduce to and .
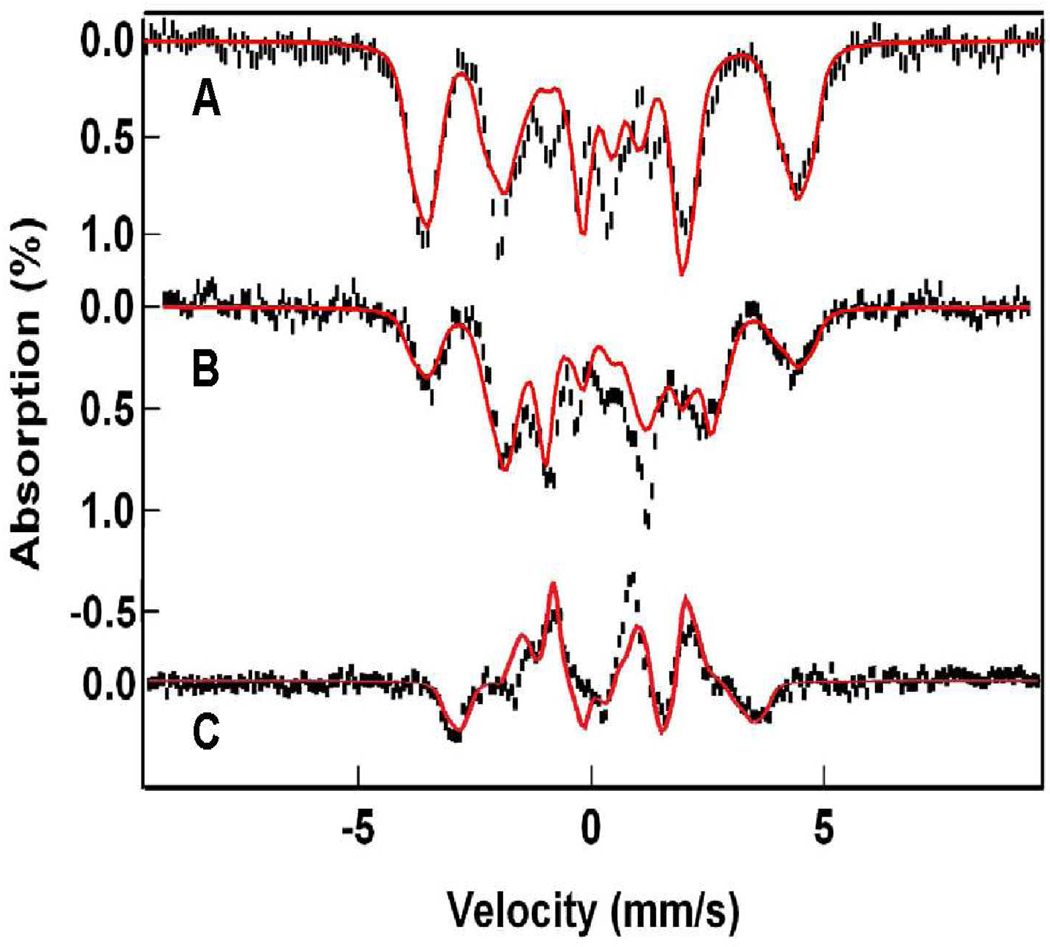
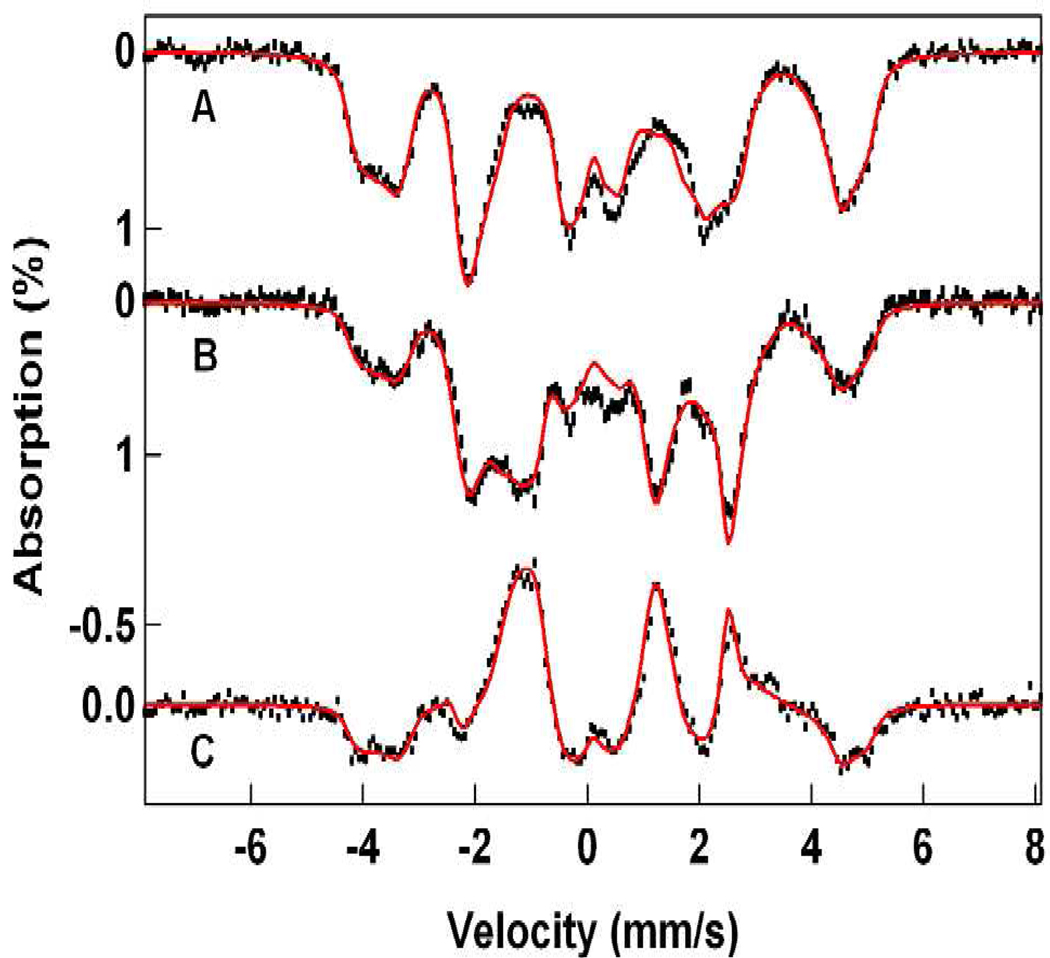
Starting with the solutions obtained with eq 1, we have analyzed the spectra of Figures 4, 5, and 7 with eq 4, using the 2Spin option of WMOSS. Since the 4.2 K spectra depend only on the ratio De/J, the problem simplifies to finding the appropriate Db/J ratio. The A-tensor of the FeIII site in 1-OH is axial, which fits quite well to the above choice of De. In contrast, the FeIII site of 1-F has a rhombic A-tensor, which can be accommodated by using Da = 0, Db ≠ 0 and (E/D)b ≠ 0 in eqs 5 and 6. Figure 8 shows simulations of the 1-OH spectra using the parameters quoted in Table 2. Although the two FeIII contaminants in the spectra of Figure 7 can be reasonably well subtracted from the data, the spectral range between −0.5 and + 1.5 mm/s is afflicted with considerable amplitude uncertainties. By taking the difference spectra of the data taken in parallel and transverse applied field (“parallel minus transverse field”, Figure 8C), these contaminants cancel. It can be seen that our simulation of the difference spectrum fits the data quite well. The same procedure gives excellent simulations for 1-F, shown in Figure 9, using the parameters listed in Table 2.
Figure 8.
4.2 K Mössbauer spectra of 1-OH analyzed with eq 4. Spectra in (A) and (B) are the same as in Figure 7. Spectrum in (C) is a difference spectrum obtained by forming the difference spectrum “parallel minus transverse.” In the difference spectrum, the contributions of the two FeIII contaminants cancel. Solid lines are spectral simulations using the parameters listed in Table 2.
Table 2.
Experimental and DFT (bold) 57Fe hyperfine parameters for 1-OH and 1-F. Experimental parameters were obtained from simulations based on eq 4 using J = 90 cm−1 for both complexes.
| System | δ (mm/s) |
ΔEQ (mm/s) |
η | D (cm−1) |
ax/gnβn (T) |
ay/gnβn (T) |
az/gnβn (T) |
aiso/gnβn (T) |
|
|---|---|---|---|---|---|---|---|---|---|
| FeIII | 1-Fm (DFT) | 0.45 | 1.36 | 0.9 | −21.4 | −20.8 | −20.5 | −20.9a | |
| 1-F (Exp.) | 0.45 | 1.50 | 4.3 | 0b | −20.9 | −20.9 | −20.9 | −20.9 | |
| 1-OHm (DFT) | 0.43 | 1.24 | 1.0 | −21.4 | −20.8 | −21.1 | −21.1a | ||
| 1-OH (Exp.) | 0.40 | −0.60 | 5.1 | 0b | −21.1 | −21.1 | −21.1 | −21.1 | |
| FeIV | 1-Fm (DFT) | 0.14 | −0.43 | 0.7 | −18.5 | −13.6 | −26.1 | −19.4a | |
| 1-F (Exp.) | 0.10 | 0.60 | −0.7 | 6.3b | −18.6c | −13.4 | −26.3 | −19.4 | |
| 1-OHm (DFT) | 0.13 | 0.20 | 0.1 | −18.5 | −12.2 | −23.8 | −18.2a | ||
| 1-OH (Exp) | 0.09 | −0.40 | 10.0 | 12b | −20.0c | −12.0 | −22.5 | −18.2 |
The Fermi contact term is generally poorly reproduced by DFT calculations. We have therefore used the experimental aiso and added the calculated aSD to obtain “theoretical” a-values.
The anisotropy of Aa is smaller for 1-F than for 1-OH (see Table 1), implying that the quantity De/J is smaller for 1-F. We suspect that Db has about the same value for the FeIV=O sites of both complexes. Note that we arbitrarily set Da = 0. By using different values for Da (see eqs 5 and 6) we can achieve the required De/J values and use the same Db for both complexes; it is likely that the two FeIII sites have a different Da. For 1-OH we used (E/D)a = 0 for 1-OH and (E/D = = 0.2 for 1-F.
Errors for a-tensor components of the FeIV=O sites are roughly ± 2 T.
Figure 9.
4.2 K Mössbauer spectra of 1-F analyzed with eq 4. Spectra in (A) and (B) are the same as in Figure 4. Spectrum (C) is a difference spectrum “parallel minus transverse field” using the data of Figure 5A and its transverse field counterpart. Red solid lines are spectral simulations using the parameters listed in Table 2.
3.6 Radiolytic Reduction of 4
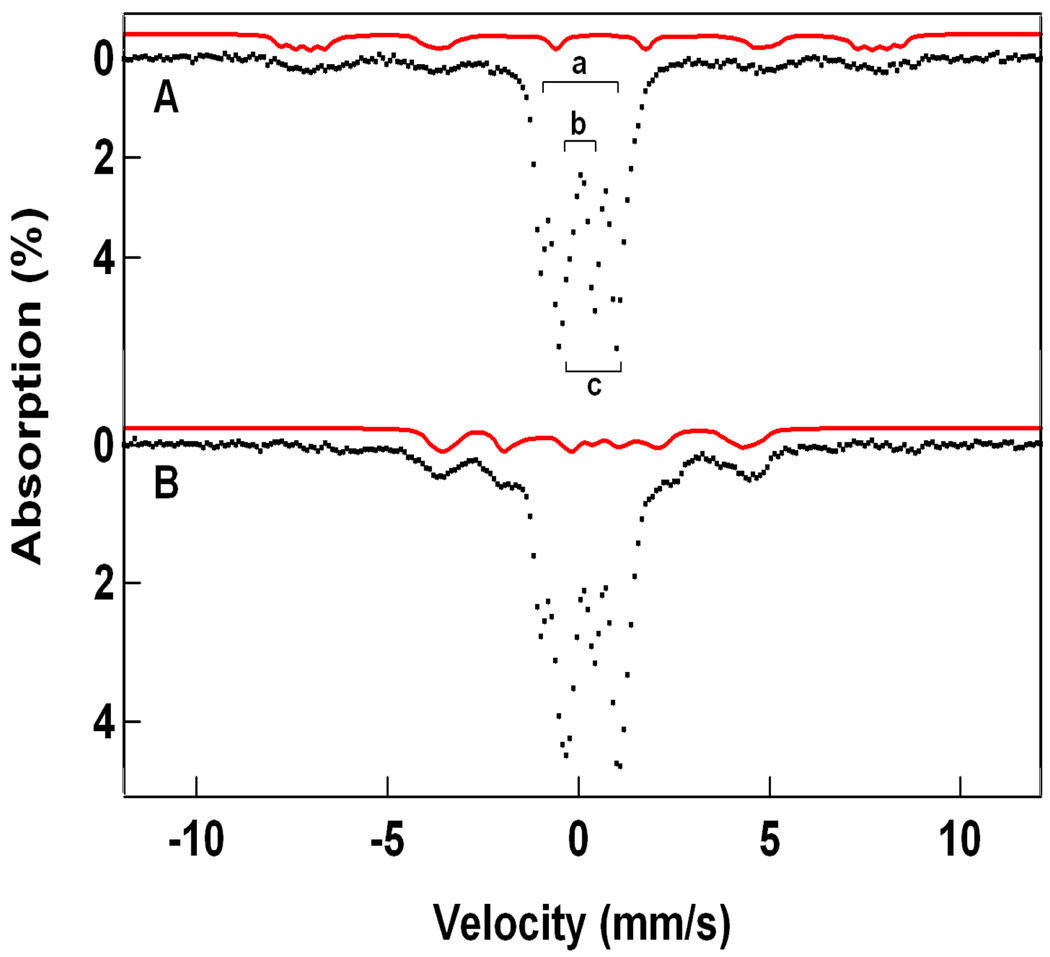
As a means of determining the core structure of 1-OH relative to the HO-FeIV-O-FeIV=O open core of 4, the latter was subjected to radiolytic reduction at 77 K,48 a temperature at which the ligands are expected to be essentially immobile, in order to compare the Mössbauer spectra of the radiolytically reduced species with those derived from ferrocene reduction of 4. Figure 10A shows a 4.2 K Mössbauer spectrum of 4 prior to reduction, prepared as described previously.23 65% of the Fe of the sample yields the two doublets of 4, previously labeled a and b,23 22% of the Fe contributes a doublet characteristic of a diamagnetic diiron(III) species (most likely due to residual 3 and decay products of 4), and ca. 10% of the Fe belongs to an EPR-silent high-spin ferric species whose broad features are outlined by the simulation of Figure 10A. Figure 10B shows a spectrum of the same sample after a 5 h irradiation (dose 50 kGy) with 60Co γ-rays at 77 K. Analysis of the spectrum showed that about half of the iron of diiron(IV) complex 4 was converted to a species that produces the same Mössbauer spectrum as 1-OH; the spectral contribution of this species is outlined by the solid line, the theoretical spectrum of 1-OH shown in Figure 7B. The new species in Figure 10B also exhibits the field dependence (“parallel minus transverse field”) that links it to an isotropic EPR active species (An EPR study of a sample irradiated together with the Mössbauer sample revealed ≈ 14 mM radical species in the g = 2 region that completely masked the S = ½ signal (ca. 0.2 mM) of 1-OH. Annealing at 120 K for 20 min did not measurably diminish the concentration of radicals.). If we make the plausible assumption that the 60Co irradiation changes only the oxidation state but not the structure, then the studies just described indicate that 1-OH has essentially the same structure as 4, namely an FeIV site with a terminal oxo group (Feb) and an FeIII site with a terminal hydroxo group (Fea), a suggestion supported by the DFT studies presented below (see section 4.2).
Figure 10.
Mössbauer spectra of 4 (A) in 3:1 MeOH/MeCN and 60Co irradiated 4 (B) recorded at 4.2 K in a 50 mT field applied parallel to the γ-rays. (A) The downward brackets in (A) label the FeIV sites of 4; the letter “b” designates the site with a terminal oxo group. The upward bracket marks the lines of the diferric contaminant (22% of Fe). The solid line above the spectrum is a simulated representation of a high-spin FeIII contaminant, representing ca. 10% of the Fe. The two ferric species were not affected by the irradiation with 60Co. (B) Spectrum of the sample of (A) after 60Co irradiation at 77 K. The solid red line is the simulation of 1-OH shown in Figure 7B. The high-spin FeIII contaminant has been removed using the simulation shown in (A).
3.7 Determination of Exchange Coupling Constants by EPR
1-OH and 1-F are exchange coupled FeIIIFeIV complexes with an S = ½ ground state. The first excited manifold in the spin ladder, the S = 3/2 multiplet, is at energy Δ = 3J/2. The J values of mixed-valent complexes have been determined by power saturation studies and then analyzed for the presence of an Orbach process for which the rate depends exponentially on Δ.49, 50 This method works well provided that Δ is sufficiently small so that the S = 3/2 state becomes thermally accessible before the Raman process with its strong T9 dependence dominates the spin-lattice relaxation rate.43, 45 For both 1-OH and 1-F we were able to saturate the EPR signal only up to ca. 60 K. A fit to the temperature dependence of the microwave power at half saturation revealed that the Raman process, rather than the Orbach process, dominates the relaxation. We therefore have determined Δ from the depopulation of the S = ½ ground state as a function of temperature. This method is often less reliable because even minor contaminants in the baseline can substantially affect the determination of the spin concentration of the ground state signal.
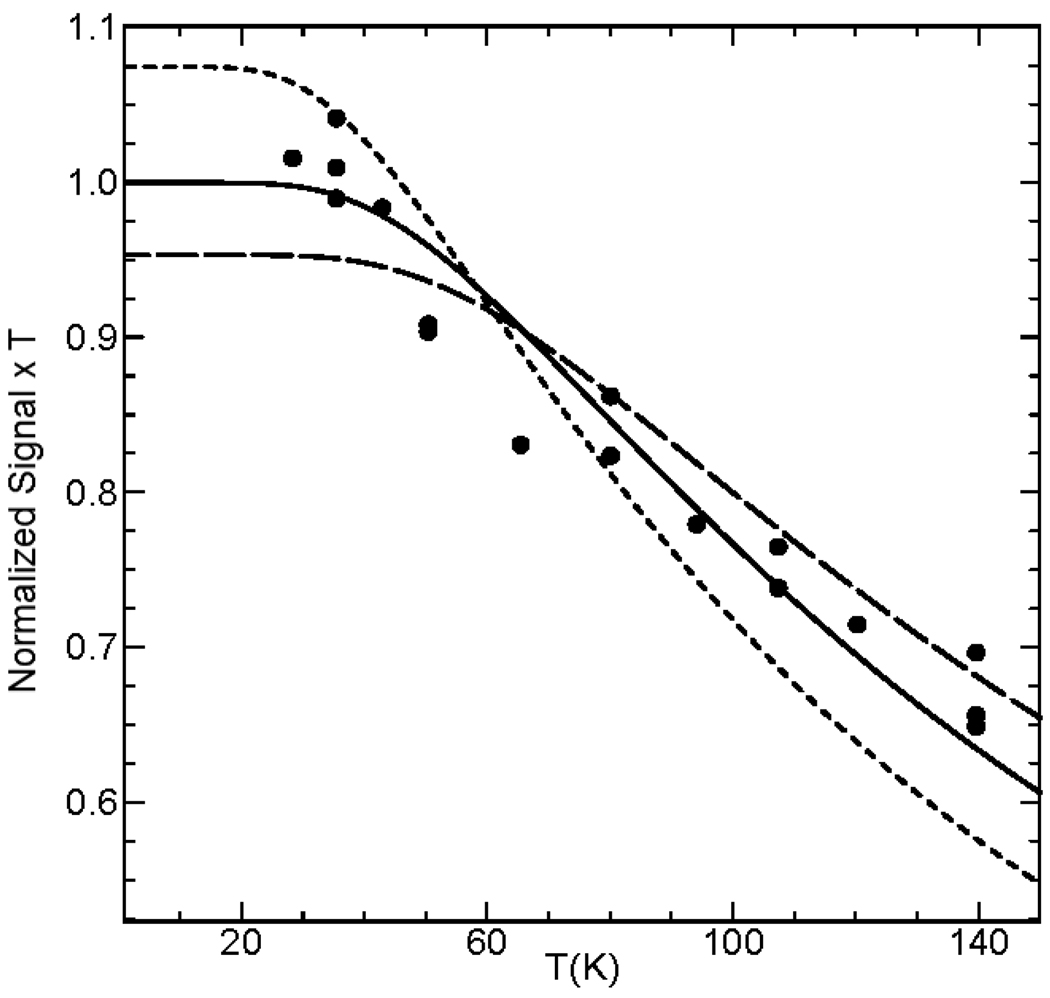
In the glassy solvent mixture 3:1 PrCN/MeCN, the solvent used to study the Mössbauer spectra of 1-OH, we generally observed a minor S = 1/2 contaminant, exhibiting g-values at 2.07 and 1.93. In a related project we produced this (unknown) species at higher concentrations, obtaining g = 2.07, 1.99 and 1.93. However, by using 3:1 CH2Cl2/MeCN we obtained a suitably pure sample, namely the sample of Figure 3A, in which this contaminant represented ca. 4% of the total spin concentration and, moreover, as its g-values were known we could remove its contribution reasonably well. For the CH2Cl2/MeCN sample, we were able to analyze the spectra of 1-OH in the temperature range from 27 K to 140 K; a selection of spectra is shown in Figure S1. Figure 11 shows a plot of (signal amplitude × temperature) versus temperature, where the signal amplitude was determined by double integration of the spectrum. The solid line is a fit for J = 90 cm−1; for comparison, additional curves are shown for J = 70 and 110 cm−1. Our analysis suggests that J = 90 ± 20 cm−1. For 1-F (Figure S2) we obtained, within the experimental uncertainties, the same J value.
Figure 11.
Temperature dependence of the population of the S = ½ ground state of 1-OH in 3:1 CH2Cl2/MeCN. The solid line is a fit for J = 90 cm−1. The dashed curves were calculated for J = 70 and 110 cm−1. Double and triple entries compare results obtained for repeats on different days. Results for 1-F are shown in Fig. S2 in Supporting Information.
3.8 Summary of Structural and Spectroscopic Properties of 1-OH and 1-F
We have studied here two valence-localized FeIII-FeIV complexes, 1-OH and 1-F. Based on the observations that 1-OH can be generated either by treating 1 with OH− or by radiolytic reduction of 4 at 77 K (see section 3.6), we conclude that 1-OH possesses an HO-FeIII-O-FeIV=O core, with the same ligand arrangement as in 4 as depicted in Scheme 1. We also propose a related F-FeIII-O-FeIV=O core for 1-F, as it shares similar spectroscopic features with 1-OH and can be generated by F− addition to 1. Our spectroscopic studies reveal that both the FeIII and FeIV sites in 1-OH and 1-F are high-spin.
Table 1 lists the 57Fe A-tensors of 1-F and 1-OH and compares them with those of E. coli RNR intermediate X and three previously reported synthetic high-spin FeIII-FeIV complexes, 5–7, see Scheme 2 (Note: The Aiso values in Table 1 are not effected by D/J mixing). Complexes 5 and 6 are respectively supported by 6-Me-TPA (6-methyl-2-pyridylmethyl)bis(2-pyridylmethyl)amine)40 and 6-Me3-TPA (tris-(6-methyl-2-pyridylmethyl)amine)42 ligands that are closely related to the tetradentate ligand that supports 1-F and 1-OH. On the other hand, 7 derives from a diiron(II) complex having four sterically bulky carboxylate ligands,51 a ligand set closer to that associated with X. Complexes 5–7 all exhibit similar 57Fe hyperfine parameters consistent with an antiferromagnetically coupled high-spin FeIII-FeIV unit. The Aiso (FeIII) for 7 is comparable to that found for X, but the corresponding values for 1-OH, 1-F, 5, and 6 are ~10% smaller as a result of the larger covalency of the nitrogen-rich FeIII sites of these complexes relative to the carboxylate-rich FeIII sites of X and 7. This distinction is also evident in the larger δ-values of X and 7. The trends in Aiso values for the FeIV sites are less obvious. In this case, Aiso values for the FeIV sites of 1-OH and 1-F are more similar to the value for X than those of 5–7. As the g-tensors of 1-OH and 1-F are isotropic, with Δgx,y,z < 0.012, there is no reduction of Aiso by orbital contributions, and thus aiso= −(3/4)Aiso for the FeIV=O sites represents the Fermi contact interaction. It is noteworthy that the magnitude of the aiso values for the high-spin FeIV=O sites in 1-OH and 1-F is ca. 5 T larger than the aiso values for the low-spin (S = 1) FeIV=O sites in 4 and [(L)FeIV=O(NCMe)].23
The aiso values for the reduced site are typical for high-spin FeIII in N/O coordination. For [FeIII(L)Cl2]+ we have observed an isotropic a/gnβn = −20.5 T, which is close to the value aiso/gnβn = −21.0 T obtained for 1-OH. However, the Mössbauer simulations of 1-OH, in the language of eq 1, reveal a substantially larger anisotropy than is usually observed for this half-filled shell ion. As shown in section 3.5 this anisotropy (to a major extent)52 can be attributed to mixing of excited S = 3/2 and 5/2 states into the S = ½ ground state by zero-field splitting terms (D/J mixing). Because we have determined J, this mixing provides a measure of the zero-field splitting parameters of the FeIV=O site, information which could not be obtained if J were substantially larger than D. Inclusion of D/J mixing into the spectral analysis also allows us to compare the traceless part of the a-tensor of the FeIV=O site with the spin-dipolar coupling constant obtained from DFT calculations. As can be seen from Table 2, the agreement between theory and experiment is very good (However, given the limitations in the accuracy of both the simulations and calculations, the striking match found between experiment and theory for the FeIV=O site of 1-F must be somewhat fortuitous).
Complexes 1-OH and 1-F are postulated to have an open X-FeIII-O-FeIV=O core structure where the oxo bridge mediates the antiferromagnetic interaction between the high-spin FeIII and FeIV sites. From an analysis of the temperature dependence of the S = ½ signal intensity arising from the ground state, the strength of this coupling, J, has been determined for both 1-OH and 1-F to be 90 cm−1, with an estimated uncertainty of ± 20 cm−1. These values are in good agreement with the DFT results (Tables 4 and S1) described below and serve as the first definitively measured coupling constants between high-spin FeIII-FeIV centers. For comparison, Lippard and coworkers estimated the J value for 7 to be > 100 cm−1 based on the observed Curie law behavior of its S = ½ EPR signal up to 150 K.41 Solomon and coworkers estimated the J value for RNR intermediate X to be > 70 cm−1 by magnetic circular dichroism spectroscopy based on the absence of any measurable population of the S = 3/2 level at 115 K.56 These comparisons suggest that a FeIII-O-FeIV unit may be the minimal common motif for the high-spin FeIII-FeIV complexes described thus far. Lastly, we emphasize that a spin-state change must occur at both iron sites when 1-OH and 1-F are formed from their precursors (1 or 4). For 4, the individual iron sites are best described as intermediate spin Sa,b = 1. A rationale for the unusual Sb = 1 to Sb = 2 transformation is presented in the DFT analysis detailed in the following section, which takes advantage of the rich spectroscopic features of 1-OH and 1-F to describe their electronic structures.
Table 4.
DFT results for the computational model 1-OHm.
| ΔEa (cm−1) |
Jb (cm−1) |
(Å) |
(Å) |
Fe-OB-Fe (°) |
(Å) |
||
|---|---|---|---|---|---|---|---|
| (5/2, 2) 1/2 | 0 | +135 | 1.887 | 1.807 | 129 | 1.859 | |
| (5/2, 2) 9/2 | 1620 | 1.907 | 1.827 | 129 | 1.864 | ||
| (5/2, 1) 3/2 | 1709 | +69 | 1.861 | 1.873 | 129 | 1.870 | |
| (5/2, 1) 7/2 | 2123 | 1.858 | 1.879 | 131 | 1.876 |
System energies relative to the (5/2, 2) 1/2 ground state.
J values for the (5/2, 2) and (5/2, 1) couples.
4. DFT Analysis
4.1 Spin State Energies
In our previous studies, the application of density functional theory substantially enhanced our understanding of the electronic structure of high-valent diiron complexes, including the ferromagnetically coupled diiron(IV) species 4.23 Here we have applied DFT to gain further insight into the electronic structures of antiferromagnetically coupled 1-OH and 1-F and, in particular, to understand why the Sb = 1 FeIV=O site in 4 becomes Sb = 2 upon reduction of 4 to 1-OH.
Using Gaussian33 we have performed geometry optimizations for 1-OHm, (Figure 1), and 1-Fm, (Figure 12); to distinguish the computational models, which lack the methyl and methoxy substituents at the pyridines, we have labeled them with subscript m (= model). Since our DFT analysis focuses on a comparison of spin state energies, we have used the hybrid B3LYP functional, which is considered to be most suitable for this purpose.57 For this reason, we have performed our calculations with Gaussian instead of the BPVWN functional associated with the ADF program previously used in our study of complex 4.23
Figure 12.
Geometry optimized structure of 1-Fm. The coordinate system used in this manuscript is drawn into and . The Fe=O and Fe-F bonds are essentially parallel.
The optimized geometry for 1-OHm (Figure 1) is similar to that reported for 4: the oxo group of the FeIV site and the hydroxo group of the FeIII site are juxtaposed, as in 4, to facilitate hydrogen bonding. The Fe-OB-Fe angle is 129° (subscript B stands for bridge), the bending being supported by the FeIV=O⋯H-OFeIII hydrogen bond. The calculated Fe⋯Fe distance in 1-OHm is 3.34 Å. In 1-Fm (Figure 12), which contains a fluoride-bound FeIII site, the Fe-OB-Fe bond is close to linear (175°) in the absence of a supporting hydrogen bond and the dihedral angle O=Fe-OB-Fe-F is 180°, rather than 32° in 1-OHm, minimizing the repulsion between the terminal oxo group and the fluoride. The nearly linear Fe-OB-Fe unit in 1-Fm results in a longer Fe⋯Fe distance (3.61 Å) than in 1-OHm. The spin populations of the irons (see Supporting Information) show that 1-OHm and 1-Fm are valence localized FeIIIFeIV complexes. As anticipated, the DFT solutions for 1-OHm and 1-Fm place the terminal oxo ligand at the FeIV site.
Tables 4 and S1 present the DFT results for 1-OHm and 1-Fm, respectively. Geometry optimizations were performed for both the ferromagnetic state (F) and the broken-symmetry state (BS) for several local spin combinations. For a given combination, (Sa, Sb), the exchange coupling constant J was obtained from the expression J = (EF – EBS)/(2SaSb),58 assuming the validity of the JŜa·Ŝb Hamiltonian in these systems. The energy gaps between the ferromagnetic states (Smax = Sa + Sb) and the antiferromagnetic states (Smin = |Sa − Sb|) were evaluated with the expression J[Smax(Smax + 1) − Smin(Smin + 1)]/2, which shows that the total exchange splitting depends on both J and the local spin quantum numbers, Sa and Sb. Using these exchange splittings and the SCF energies for the ferromagnetic states, we obtained the relative state energies (ΔE) listed in Tables 4 and S1. A graphical representation of the energies for 1-OH is given in Figure 13 (right column). For each (Sa, Sb) pair, the energies for the intermediate spin states, Smin < S < Smax, have not been listed but can readily be evaluated using the expression ES = c + JS(S + 1)/2 for their energies, with c being a constant depending on Sa and Sb. Tables 4 and S1 also present the metric parameters for the Fe-OB-Fe bridging unit, where we have listed the values obtained from the BS calculations for the antiferromagnetic states. In the following discussion we focus, for clarity, on 1-OHm; the discussion of 1-Fm, which has similar properties as 1-OHm, is given in the Supporting Information.
Figure 13.
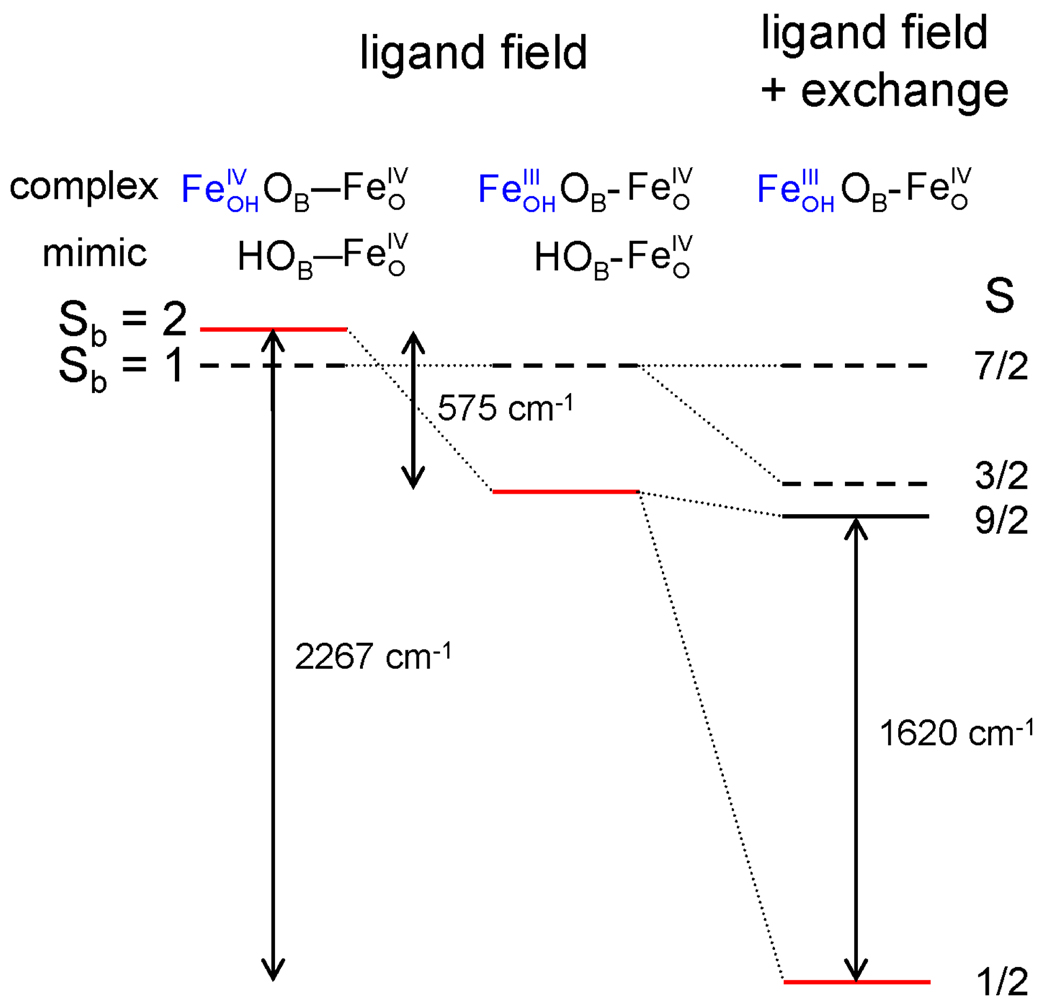
Energy level scheme showing the effect of the reduction-induced change in the ligand field on the spin state energies of the site in the absence of exchange interactions (left and middle column) and in combination with the exchange interactions (right column). The spin values indicated are the local spins (Sb) for the site (left) and the coupled spins (S) for the dinuclear center (right). The (5/2, 1) 7/2 level has been aligned with the Sb = 1 levels for comparison. The splittings in the left and center columns were evaluated using a mimic, using different distances as described in section 4.3. The exchange splittings in the right column correspond to the J(5/2, 2) = 135 cm−1 and J(5/2, 1) = 69 cm−1.
4.2 Results for 1-OHm
To obtain insight into the electronic state of the FeIII site, we performed DFT calculations for the high-spin and low-spin states of the mononuclear complex [FeIII(OH)2(TPA)]m, which is derived from 1-OHm by replacing the entire site with a proton. The calculations for this system place the Sa = 5/2 state well below the Sa = 1/2 state, by a margin of about 3000 cm−1, consistent with experimental data showing that the large majority of FeIII(TPA) complexes with two additional O ligands are high-spin. On the basis of this DFT result and the strong experimental evidence for the high-spin state of the site in 1-OH, we did not pursue DFT solutions for 1-OHm with Sa < 5/2.
Interestingly, the calculations show that the site is high-spin in the ground state of 1-OHm (see Table 4), implying that the 1e-reduction of the FeOH site in 4 has induced a change in the spin of the adjacent site from Sb = 1 in to Sb = 2 in . Concomitantly, the exchange-coupling constant has changed sign, from ferromagnetic in to antiferromagnetic in , leading to an S = 1/2 ground state (see Table 4). As shown graphically in Figure 13, the (5/2, 2) 1/2 ground state is considerably lower in energy than the other three spin states. This is an outcome resulting from the antiferromagnetic exchange interaction in the (5/2, 2) pair, which is substantially larger than for the (5/2, 1) pair. This result establishes that the exchange interaction between the metal ions in 1-OHm, owing to its dependence on the local spins, is an essential determinant of the spin states of the individual metal ions. To our knowledge, 1-OH (as well as 1-F, see Supporting Information) is the first example of a polynuclear metal complex where the exchange interaction between the paramagnetic sites plays a decisive role in changing the spin at one of the sites.
4.3 Why is the FeIV Site Low-Spin in 4 and High-Spin in 1-OH?
In this section, we analyze the spin state change of the site from Sb = 1 in 4 to Sb = 2 in 1-OH; we treat the slightly more complicated case of 1-F separately in Supporting Information. The following observations are relevant for identifying the roots of the spin transition. The cryoreduction experiment of section 3.6 indicates that the reduction of 4 yields an essentially isostructural 1-OH complex but in which the FeOH site has become high-spin FeIII. According to our DFT calculations, this spin-state change results in a lengthening of the FeIII-OB bond and, in compensation, a shortening of the FeIV-OB bond, causing a change in the ligand field at the site and affecting the energy gap between the Sb = 1 and 2 states; thus there is a ligand-field contribution to the spin transition. Estimating the reduction-induced ligand-field changes in the energy gap between the local spin states is hampered by the simultaneous presence of the exchange interaction between and . In Figure 13 we propose a scheme for evaluating the difference that the and "ligands" exert on the relative spin state energies of to which they are attached. The scheme is based on the use of a O-H diamagnetic mimic for the "ligands" and . The optimized geometries for the Sb = 1 ground state and Sb = 2 excited state of the mononuclear complex have distances (1.88 Å and 1.82 Å) that closely match those for the Sb = 1 and 2 states of 1-OHm (1.87 Å and 1.81 Å). Thus, −OBH appears to be a faithful, diamagnetic mimic for the paramagnetic ligand. As a diamagnetic mimic for the ligand in 4, we have again taken the −{OBH} ligand, but now with an distance that is fixed at 1.97 Å in the geometry optimization of , i.e. the value of the distance in the optimized structure of 4 (In 4m this bond is 0.13 Å longer than in 1-OHm).59 Use of the diamagnetic mimics for and produces for ground states with spins Sb = 1 and Sb = 2; corresponding excited states with spins Sb = 2 and Sb = 1 are found at 134 cm−1 and 441 cm−1, respectively. Thus, by passing from to , the energy gap E(Sb = 2) - E(Sb = 1) is estimated to change from +134 cm−1 to −441 cm−1, representing a total shift of 575 cm−1 (marked in Figure 13) that we attribute to the reduction-induced ligand-field change.60 The spin level crossing induced by the ligand-field change is illustrated in the left and middle columns of Figure 13. It can be seen that the reduction-induced ligand-field effect on the spin state energies gives the observed spin crossover in 1-OHm but fails to reproduce the much larger energy splittings between the (5/2, Sb = 1) 3/2 and (5/2, Sb = 2) 1/2 states (Figure 13, right column). Perhaps the most important feature revealed by the calculations for the diamagnetic mimics is that the Sb = 1 and 2 states of in the ligand environments encountered in 1-OHm (and 1-Fm) are rather close in energy, creating conditions that make the energy ordering of the local spin states susceptible to weaker interactions, such as the exchange interactions between the irons.61, 62 Most importantly, the Sb = 1 → 2 transition adds two unpaired electrons to , leading to a substantial increase of the antiferromagnetic exchange. In the following we outline some of the details of these considerations.
The exchange-coupling constants listed in Tables 4 and S1 for spin pair (Sa = 5/2, Sb = 1) include both positive and negative values and expose intricate dependences on geometrical factors, such as the bond angle and distances of the bridges in these systems. In contrast, the J values for the (Sa = 5/2, Sb = 2) pairs in Tables 4 and S1 are much larger and positive, and resemble those observed in (µ2-oxo)diiron(III) complexes.63, 64 The similarity with the diferric species is not unexpected given that the number of unpaired electrons in the (5/2, 2) complexes differs only by one from the unpaired electron count of ten in (5/2, 5/2). The similarity can be quantified by using the exponential relationship63 between J and the average bridging bond length (denoted P by Gorun and Lippard) for binuclear FeIII centers bridged by a ligand oxygen atom (µ2-oxo, µ2-hydroxo, µ2-alkoxo, etc.) and supported by at least one other bridging ligand. Using this relationship and our calculated bond lengths we obtain for 1-OHm the values JGorun-Lippard (5/2, 2) = 122 cm−1 for the P value in the broken symmetry state. This value is remarkably similar to the J (5/2, 2) value listed in Table 4, adding support to the calculated J values.65 In the following paragraphs we discuss the anticipated change in J when the site in 1-OHm is reduced to high-spin on the basis of the orbital structure for this site gleaned from the magnetic hyperfine interactions.
We can use the 57Fe spin dipolar coupling tensor (ASD ≈ A - Aiso) to gain insight into the exchange pathways added by the transition Sb = 1 to Sb = 2. The calculated ASD for the high-spin FeIV site has a vanishing component along x and negative and positive values with approximately equal magnitudes along y and z, respectively. As the Sb = 2 state has a t2g3eg1 configuration, the dominant valence contribution to ASD can be ascribed to the eg electron. The calculated ASD components correspond to an orbital of the form |de> ≈ −0.26 |z2> + 0.97 |x2−y2> with z||FeO=O and x||Fe⋯Fe (see Figure 12). The experimental ASD is nearly axial along z and not as rhombic as in the calculation, suggesting that the de orbital in the molecule is less admixed, i. e. |de> ≈ |x2−y2> (Given the complexity of the system, the agreement between the experimental and theoretical ASDis quite reasonable).
Using this knowledge of the orbital configuration, we now address the difference in the J values for the (5/2, 1) and (5/2, 2) pairs on the basis of the pathway model for J.66, 67 For each singly occupied 3d orbital at an of a given symmetry, there is a matching partner in the half-filled 3d shell of the FeIII site. The local spin change Sb = 1 → 2, due to the transfer xyβ → deα, adds two additional unpaired electrons and associated antiferromagnetic pathways for which Jπ, ∝ tπ2/U and Jσ′ ∝ tσ′2/U, where tπ = <xyb|h|xya> and tσ′ = <(de)b|h|(3x2-r2)a> are transfer integrals between the two metals, labeled (a) for and (b) for . These additional contributions rationalize why the J values for the (5/2, 2) pair are larger than for (5/2, 1). As |de> ≈ |x2-y2> = 31/2/2 |3x2-r2> − 1/2 |y2-z2>, we obtain for the unpaired electron in de the exchange parameter Jσ′ = 3/4 Jσ with Jσ ∝ tσ2/U and tσ = <(3x2-r2)b|h|(3x2-r2)a>. Thus, the channel sum J ∝ (3/4 Jσ + 2 Jπ)/10 for mixed-valent (5/2, 2) differs from J ∝ (Jσ + 2 Jπ)/12.5 for the diferric (5/2, 5/2) only by 0.005 Jσ − 0.040 Jπ, which rationalizes the similarity in the J values for the FeIIIHS-O-FeIVHS and FeIIIHS-O-FeIIIHS bridges. The J values for the excited states with (5/2, 1) parentage contains the antiferromagnetic contribution Jπ ~ tπ2/U with tπ = <yzb|h|yza>. The overall exchange splitting, i.e. the energy gap between Smin and Smax, for (5/2, 1) is 414 cm−1 in 1-OHm and is about four times smaller than the corresponding values 1620 cm−1 for the (5/2, 2) couple. Similar or even smaller overall exchange splittings than for (5/2, 1) are present in the core of 4.23
Conclusions
As illustrated by Figure 13, the antiferromagnetic exchange in the (5/2, 2) pair of 1-OH gives rise to splittings within the (5/2, 2) manifold that are larger than both the exchange splittings within the (5/2, 1) manifold and the reduction-induced ligand-field changes on the energy gap between the local Sb = 1 and 2 states. The reduction-induced spin transition of the site emerges from this discussion as a process that is not primarily driven by the conventional mechanism that proceeds through changes in the ligand field, but by one that is based on the reduction-induced enhancement of the exchange interaction with an adjacent acceptor site. The change in the spin of the Feb site from Sb = 1 in the diiron(IV) complex 4 to Sb = 2 in the iron(III)iron(IV) complex 1-OH (Sb = 2) indicates that the corresponding spin states of the uncoupled FeIV(O)(L)(O-X) unit are close in energy. Unlike 1-OH, Wieghardt’s bis(carboxylato)-bridged FeIII-O-FeIV complexes62 have S = 3/2 ground states that derive from the (5/2, 1) couple. In these cases, the FeIV centers are S = 1 despite being coupled to S = 5/2 FeIII ions. Whatever the explanation for this difference, the 1e-reduction of 4 to generate 1-OH not only engenders a change in the spin state of the site but also enhances its H-atom abstraction ability a thousand-fold,29 providing a compelling rationale for Nature’s choice of high-spin iron(IV) centers to carry out such transformations in nonheme iron enzymes.
Supplementary Material
Table 3.
Experimental and theoretical 19F hyperfine parameters of 1-F.
| Ax (MHz) |
Ay (MHz) |
Az (MHz) |
|
|---|---|---|---|
| EPR | 92 | 113 | 253 |
| DFT | +50 | +106 | +260 |
ACKNOWLEDGMENT
This work was supported by NIH grants GM38767 (to L.Q.), GM077387 (to M. P. H.), and EB-001475 (to E.M.). This research was also supported in part by the National Science Foundation through TeraGrid resources provided by NCSA under grant number TG-CHE070073 (to E. L. B.).
Footnotes
Supporting Information Available. Temperature dependence of EPR spectra for 1-OH in 3:1 CH2Cl2/MeCN, temperature dependence of integrated EPR intensity for EPR for 1-F, and additional details of Mössbauer and DFT analyses for 1-OH and 1-F. This material is available free of charge via the Internet at http://pubs.acs.org.
References
- 1.Wallar BJ, Lipscomb JD. Chem. Rev. 1996;96:2625–2658. doi: 10.1021/cr9500489. [DOI] [PubMed] [Google Scholar]
- 2.Kurtz DM., Jr J. Biol. Inorg. Chem. 1997;2:159–167. [Google Scholar]
- 3.Solomon EI, Brunold TC, Davis MI, Kemsley JN, Lee S-K, Lehnert N, Neese F, Skulan AJ, Yang Y-S, Zhou J. Chem. Rev. 2000;100:235–350. doi: 10.1021/cr9900275. [DOI] [PubMed] [Google Scholar]
- 4.Murray LJ, Lippard SJ. Acc. Chem. Res. 2007;40:466–474. doi: 10.1021/ar600040e. [DOI] [PubMed] [Google Scholar]
- 5.Fox BG, Lyle KS, Rogge CE. Acc. Chem. Res. 2004;37:421–429. doi: 10.1021/ar030186h. [DOI] [PubMed] [Google Scholar]
- 6.Nordlund P, Reichard P. Annu. Rev. Biochem. 2006;75:681–706. doi: 10.1146/annurev.biochem.75.103004.142443. [DOI] [PubMed] [Google Scholar]
- 7.Groves JT. J. Inorg. Biochem. 2006;100:434–447. doi: 10.1016/j.jinorgbio.2006.01.012. [DOI] [PubMed] [Google Scholar]
- 8.Lee S-K, Fox BG, Froland WA, Lipscomb JD, Münck E. J. Am. Chem. Soc. 1993;115:6450–6451. [Google Scholar]
- 9.Lee S-K, Nesheim JC, Lipscomb JD. J. Biol. Chem. 1993;268:21569–21577. [PubMed] [Google Scholar]
- 10.Liu KE, Valentine AM, Wang D, Huynh BH, Edmondson DE, Salifoglou A, Lippard SJ. J. Am. Chem. Soc. 1995;117:10174–10185. [Google Scholar]
- 11.Brazeau BJ, Wallar BJ, Lipscomb JD. J. Am. Chem. Soc. 2001;123:10421–10422. doi: 10.1021/ja016632i. [DOI] [PubMed] [Google Scholar]
- 12.Baik M-H, Newcomb M, Friesner RA, Lippard SJ. Chem. Rev. 2003;103:2385–2420. doi: 10.1021/cr950244f. [DOI] [PubMed] [Google Scholar]
- 13.Shu L, Nesheim JC, Kauffmann K, Münck E, Lipscomb JD, Que L., Jr Science. 1997;275:515–518. doi: 10.1126/science.275.5299.515. [DOI] [PubMed] [Google Scholar]
- 14.Broadwater JA, Ai J, Loehr TM, Sanders-Loehr J, Fox BG. Biochemistry. 1998;37:14664–14671. doi: 10.1021/bi981839i. [DOI] [PubMed] [Google Scholar]
- 15.Murray LJ, Naik SG, Ortillo DO, García-Serres R, Lee JK, Huynh BH, Lippard SJ. J. Am. Chem. Soc. 2007;129:14500–14510. doi: 10.1021/ja076121h. [DOI] [PMC free article] [PubMed] [Google Scholar]
- 16.Vu VV, Emerson JP, Martinho M, Kim YS, Münck E, Park MH, Que L., Jr Proc. Natl. Acad. Sci. USA. 2009;106:14814–14819. doi: 10.1073/pnas.0904553106. [DOI] [PMC free article] [PubMed] [Google Scholar]
- 17.Sturgeon BE, Burdi D, Chen S, Huynh BH, Edmondson DE, Stubbe J, Hoffman BM. J. Am. Chem. Soc. 1996;118:7551–7557. [Google Scholar]
- 18.Riggs-Gelasco PJ, Shu L, Chen S, Burdi D, Huynh BH, Que L, Jr, Stubbe J. J. Am. Chem. Soc. 1998;120:849–860. [Google Scholar]
- 19.Murray LJ, García-Serres R, McCormick MS, Davydov R, Naik SG, Kim S-H, Hoffman BM, Huynh BH, Lippard S. J. Biochemistry. 2007;46:14795–14809. doi: 10.1021/bi7017128. [DOI] [PMC free article] [PubMed] [Google Scholar]
- 20.Dong Y, Fujii H, Hendrich MP, Leising RA, Pan G, Randall CR, Wilkinson EC, Zang Y, Que L, Jr, Fox BG, Kauffmann K, Münck E. J. Am. Chem. Soc. 1995;117:2778–2792. [Google Scholar]
- 21.Hsu H-F, Dong Y, Shu L, Young VG, Jr, Que L., Jr J. Am. ChemSoc. 1999;121:5230–5237. [Google Scholar]
- 22.Xue G, Wang D, De Hont R, Fiedler AT, Shan X, Münck E, Que L., Jr Proc. Nat. Acad. Sci. U.S.A. 2007;104:20713–20718. doi: 10.1073/pnas.0708516105. [DOI] [PMC free article] [PubMed] [Google Scholar]
- 23.Martinho M, Xue G, Fiedler AT, Que L, Jr, Bominaar EL, Münck E. J. Am. Chem. Soc. 2009;131:5823–5830. doi: 10.1021/ja8098917. [DOI] [PMC free article] [PubMed] [Google Scholar]
- 24.Xue G, Fiedler AT, Martinho M, Münck E, Que L., Jr Proc. Nat. Acad. Sci. U.S.A. 2008;105:20615–20620. [Google Scholar]
- 25.Krebs C, Fujimori DG, Walsh CT, Bollinger JM. Acc. Chem. Res. 2007;40:484–492. doi: 10.1021/ar700066p. [DOI] [PMC free article] [PubMed] [Google Scholar]
- 26.Decker A, Clay MD, Solomon EI. J. Inorg. Biochem. 2006;100:697–706. doi: 10.1016/j.jinorgbio.2006.01.013. [DOI] [PubMed] [Google Scholar]
- 27.Hirao H, Kumar D, Que L, Jr, Shaik S. J. Am. Chem. Soc. 2006;128:8590–8606. doi: 10.1021/ja061609o. [DOI] [PubMed] [Google Scholar]
- 28.Sastri CV, Lee J, Oh K, Lee YJ, Lee J, Jackson TA, Ray K, Hirao H, Shin W, Halfen JA, Kim J, Que L, Jr, Shaik S, Nam W. Proc. Nat. Acad. Sci. U.S.A. 2007;49:19181–19186. doi: 10.1073/pnas.0709471104. [DOI] [PMC free article] [PubMed] [Google Scholar]
- 29.Xue G, De Hont R, Münck E, Que L., Jr Nature Chem. 2010;2:400–405. doi: 10.1038/nchem.586. [DOI] [PMC free article] [PubMed] [Google Scholar]
- 30.Cox DP, Terpinski J, Lawrynowicz W. J. Org. Chem. 1984;49:3216–3219. [Google Scholar]
- 31.Armarego WL, Perrin DD. Purification of Laboratory Chemicals. Butterworth-Heinemann. 1997 [Google Scholar]
- 32.Kojima T, Leising RA, Yan S, Que L., Jr J. Am. Chem. Soc. 1993;115:11328–11335. [Google Scholar]
- 33.Frisch MJ, Trucks GW, Schlegel HB, Scuseria GE, Robb MA, Cheeseman JR, Montgomery JA, Vreven T, Kudin KN, Burant JC, Millam JM, Iyengar SS, Tomasi J, Barone V, Mennucci B, Cossi M, Scalmani G, Rega N, Petersson GA, Nakatsuji H, Hada M, Ehara M, Toyota K, Fukuda R, Hasegawa J, Ishida M, Nakajima T, Honda Y, Kitao O, Nakai H, Klene M, Li X, Knox JE, Hratchian HP, Cross JB, Bakken V, Adamo C, Jaramillo J, Gomperts R, Stratmann RE, Yazyev O, Austin AJ, Cammi R, Pomelli C, Ochterski J, Ayala PY, Morokuma K, Voth GA, Salvador P, Dannenberg JJ, Zakrzewski VG, Dapprich S, Daniels AD, Strain MC, Farkas Ö, Malick DK, Rabuck AD, Raghavachari K, Foresman JB, Ortiz JV, Cui Q, Baboul AG, Clifford S, Cioslowski J, Stefanov BB, Liu G, Liashenko A, Piskorz P, Komáromi I, Martin RL, Fox DJ, Keith T, Al-Laham MA, Peng CY, Nanayakkara A, Challacombe M, Gill PMW, Johnson B, Chen W, Wong MW, Gonzalez C, Pople JA. Gaussian 03 (revision E.01) Wallingford, CT: Gaussian, Inc; 2004. [Google Scholar]
- 34.Vrajmasu V, Münck E, Bominaar EL. Inorg. Chem. 2003;42:5974–5988. doi: 10.1021/ic0301371. [DOI] [PubMed] [Google Scholar]
- 35.Morimoto H, Kotani M. Biochim. Biophys. Acta. 1966;126:176–178. doi: 10.1016/0926-6585(66)90050-1. [DOI] [PubMed] [Google Scholar]
- 36.Münck E, Huynh BH. Iron-sulfur Proteins: Combined Mössbauer and EPR Studies. In: Bertini ID, Drago RS, editors. ESR and NMR of Paramagnetic Species in Biological and Related Systems. Holland: Reidel Publishing Company; 1979. pp. 275–288. [Google Scholar]
- 37.Mitou G, Higgins C, Wittung-Stafshede P, Conover RC, Smith AD, Johnson MK, Gaillard J, Stubna A, Münck E, Meyer J. Biochemistry. 2003;42:1354–1364. doi: 10.1021/bi027116n. [DOI] [PubMed] [Google Scholar]
- 38.Münck E. Aspects of 57Fe Mössbauer Spectroscopy. In: Que L Jr, editor. In Physical Methods in Bioinorganic Chemistry. Sausalito, CA: University Science Books; 2000. pp. 287–319. [Google Scholar]
- 39.Münck E, Debrunner P, Tsibris JCM, Gunsalus IC. Biochemistry. 1972;11:855–863. doi: 10.1021/bi00755a027. [DOI] [PubMed] [Google Scholar]
- 40.Dong Y, Kauffmann K, Que L, Jr, Münck E. J. Am. Chem. Soc. 1995;117:11377–11378. [Google Scholar]
- 41.Lee D, Du Bois J, Petasis D, Hendrich MP, Krebs C, Huynh BH, Lippard SJ. J. Am. Chem. Soc. 1999;121:9893–9894. [Google Scholar]
- 42.Zheng H, Yoo SJ, Münck E, Que L., Jr J. Am. Chem. Soc. 2000;122:3789–3790. [Google Scholar]
- 43.Makinen MW, Wells GB. Application of EPR Saturation Methods to Paramagnetic Metal Ions in Proteins. In: Sigel H, editor. Metal Ions in Biological Systems: ENDOR, EPR, and Electron Spin Echo for Probing Coordination Spheres. Vol. 22. CRC Press; 1987. pp. 129–206. [Google Scholar]
- 44.Sage JT, Xia YM, Debrunner P, Keough DT, De Jersey J, Zerner B. J. Am. Chem. Soc. 1989;111:7239–7247. [Google Scholar]
- 45.Fox BG, Hendrich MP, Surerus KK, Andersson KK, Froland WA, Lipscomb JD, Münck E. J. Am. Chem. Soc. 1993;115:3688–3701. [Google Scholar]
- 46.Pestovsky O, Stoian S, Bominaar EL, Shan X, Münck E, Que L, Jr, Bakac A. Angew. Chem. Int. Ed. 2005;44:6871–6874. doi: 10.1002/anie.200502686. [DOI] [PubMed] [Google Scholar]
- 47.Price JC, Barr EW, Tirupati B, Bollinger JM, Krebs C. Biochemistry. 2003;42:7497–7508. doi: 10.1021/bi030011f. [DOI] [PubMed] [Google Scholar]
- 48.Davydov R, Smieja J, Dikanov SA, Zang Y, Que L, Jr, Bowman MK. J. Biol. Inorg. Chem. 1999;49:292–301. doi: 10.1007/s007750050315. [DOI] [PubMed] [Google Scholar]
- 49.Atta M, Andersson KK, Ingemarson R, Thelander L, Graeslund A. J. Am. Chem. Soc. 1994;116:6429–6430. [Google Scholar]
- 50.Fox BG, Liu Y, Dege JE, Lipscomb JD. J. Biol. Chem. 1991;266:540–550. [PubMed] [Google Scholar]
- 51.Lee D, Pierce B, Krebs C, Hendrich MP, Huynh BH, Lippard SJ. J. Am. Chem. Soc. 2002;124:3993–4007. doi: 10.1021/ja012251t. [DOI] [PubMed] [Google Scholar]
- 52.The DFT results listed in Table 2 reveal for the a-tensor of the FeIII sites of 1-OH and 1-F an anisotropy attributable to spin-dipolar contributions, which is < 20% of the anisotropy due to D/J mixing. We do not know the accuracy of this DFT calculated contribution and have therefore not made a correction to the D/J contributions.
- 53.Burdi D, Willems J-P, Riggs-Gelasco PJ, Antholine WE, Stubbe J, Hoffman BM. J. Am. Chem. Soc. 1998;120:12910–12919. [Google Scholar]
- 54.Shanmugam M, Doan PE, Lees NS, Stubbe J, Hoffman BM. J. Am. Chem. Soc. 2009;131:3370–3376. doi: 10.1021/ja809223s. [DOI] [PMC free article] [PubMed] [Google Scholar]
- 55.Han W-G, Liu T, Lovell T, Noodleman L. J. Am. Chem. Soc. 2005;127:15778–15790. doi: 10.1021/ja050904q. [DOI] [PubMed] [Google Scholar]
- 56.Mitić N, Clay MD, Saleh L, Bollinger JM, Solomon EI. J. Am. Chem. Soc. 2007;129:9049–9065. doi: 10.1021/ja070909i. [DOI] [PMC free article] [PubMed] [Google Scholar]
- 57.Jullien J, Juhász G, Mialane P, Dumas E, Mayer CR, Marrot J, Rivière E, Bominaar EL, Münck E, Sécheresse F. Inorg. Chem. 2006;45:6922–6927. doi: 10.1021/ic0604009. [DOI] [PubMed] [Google Scholar]
- 58.Noodleman L. J. Chem. Phys. 1981;74:5737–5743. [Google Scholar]
- 59.Although this change is on the high side, there is little doubt that the underlying trend, i.e., a contraction of the distance upon reduction of the , is correctly reproduced.
- 60.The relation between E(Sb = 1) – E(Sb = 2) and bond length is discussed in Supporting Information.
- 61.Wieghardt and coworkers (ref. 62) have reported FeIV(µ-O)(µ-carboxylato)2FeIII complexes with local FeN3O3 coordination. These complexes have antiferromagnetically coupled sites with S(FeIII) = 5/2 and S(FeIV) = 1, resulting in an S = 3/2 system spin. Their FeIV sites have Sb = 1, presumably because the energy gap E(Sb = 2) – E(Sb = 1) is positive and larger in magnitude than in 1-OH and 1-F
- 62.Slep LD, Mijovilovich A, Meyer-Klaucke W, Weyhermüller T, Bill E, Bothe E, Neese F, Wieghardt K. J. Am. Chem. Soc. 2003;125:15554–15570. doi: 10.1021/ja030377f. [DOI] [PubMed] [Google Scholar]
- 63.Gorun SM, Lippard SJ. Inorg. Chem. 1991;30:1625–1630. [Google Scholar]
- 64.Kurtz DM., Jr Chem. Rev. 1990;90:585–606. [Google Scholar]
- 65.The Fe-O-Fe bridge is supported by a hydrogen bond bridge in 1-OH m
- 66.Kahn O. Molecular Magnetism. New York: VCH Publishers, Inc; 1993. [Google Scholar]
- 67.For simplicity, we assume here that the ferromagnetic contributions from σ-π pathways are zero.
Associated Data
This section collects any data citations, data availability statements, or supplementary materials included in this article.


