

Abstract
Nitrite-hemoglobin reactions have been studied extensively in vitro, but there is a lack of information on the kinetics of nitrite and its metabolites in humans. In this study, we developed a nine-compartment physiological pharmacokinetic model to describe the in vivo erythrocytic uptake and release and disposition pathways of nitrite, nitrate, methemoglobin, and iron-nitrosyl hemoglobin in the human circulation. Our model revealed that nitrite entered erythrocytes rapidly with a rate constant of 0.256 min−1 (i.e., half-life = 2.71 min). The formation of iron-nitrosyl hemoglobin from nitrite, which involves the reduction of nitrite by deoxyhemoglobin to generate nitric oxide (NO) and reaction of NO with deoxyhemoglobin to form iron-nitrosyl hemoglobin, occurred rapidly as well (k = 2.02 min−1; half-life = 0.343 min = 21 s). The disposition kinetics of methemoglobin was complex. Nitrate formation occurred primarily in erythrocytes through the nitrite-oxyhemoglobin reaction and was higher when nitrite was administered intra-arterially than intravenously. Nitrate reduction was an insignificant metabolic pathway. This study is the first to comprehensively evaluate the kinetics of nitrite and its metabolites in humans and provides unique insights into the rapid equilibrium of nitrite into erythrocytes and conversion to NO in the red cell, which is kinetically associated with vasodilation.
Introduction
Nitric oxide (NO), a key biological signaling molecule that plays a critical role in vascular homeostasis and pathophysiology, is synthesized from l-arginine and oxygen by endothelial nitric-oxide synthase (eNOS). It undergoes oxidative and reductive reactions to produce various NO species such as nitrite (NO2−) (Ford et al., 1993), nitrosothiols (Stamler et al., 1992), nitrosoamines (Rassaf et al., 2002), nitrated lipids (Lim et al., 2002), and iron-nitrosyl complexes and is scavenged by reactions with hemoglobin in the red blood cells (RBCs) to form nitrate (NO3−), methemoglobin (HbFe3+), and iron-nitrosyl hemoglobin (HbFe2+-NO) (Wennmalm et al., 1992).
Nitrite anion, one of these NO metabolites, has recently been suggested to be a stabilized storage form of NO in blood (Gladwin et al., 2004). It can be transported to deliver NO to various tissues under certain physiological and pathological conditions and can potentially be used as a therapeutic agent for various diseases such as myocardial infarction, stroke, solid organ transplantation, sickle cell disease, drug-induced ulcers, pulmonary and systemic hypertension, and subarachnoid hemorrhage (Lundberg et al., 2008). Nitrite has been shown to increase forearm blood flow by vasodilation in human volunteers (Cosby et al., 2003; Dejam et al., 2007; Maher et al., 2008), exert cytoprotective effects during ischemia-reperfusion of the heart and liver in vitro and in animals (Webb et al., 2004; Duranski et al., 2005; Gonzalez et al., 2008), improve hemodynamics in a canine model of acute pulmonary thromboembolism (Dias-Junior et al., 2006), and prevent delayed cerebral vasospasm in a primate model of subarachnoid hemorrhage (Pluta et al., 2005). In addition, the administration of inhaled nebulized nitrite elicited a sustained reduction in hypoxic-induced pulmonary hypertension in newborn lambs (Hunter et al., 2004).
The hypothesized mechanism underlying the vasodilatory effects of nitrite in human circulation is the release of NO as a result of nitrite reduction by deoxyhemoglobin (Doyle et al., 1981). Nitrite reacts with deoxyhemoglobin (HbFe2+) in the presence of a proton to form NO and HbFe3+, a reaction that is allosterically regulated by pH, hemoglobin oxygen saturation, and the R and T conformations of the hemoglobin tetramer (Huang et al., 2005). The NO generated can then bind to a second deoxyhemoglobin to form iron-nitrosyl hemoglobin as outlined in eqs. 1 and 2:
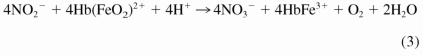
In addition, nitrite can react with oxyhemoglobin (HbFeO2) through a complex autocatalysis reaction to form methemoglobin and nitrate as described in eq. 3 by Kosaka and colleagues (Kosaka et al., 1979, 1982; Kosaka and Tyuma, 1987):
 |
It has been shown that in a partially oxygenated environment, this nitrite-oxyhemoglobin reaction runs in parallel and interacts with the nitrite-deoxyhemoglobin reaction to generate an intermediate that can oxidize iron-nitrosyl hemoglobin to release NO (Grubina et al., 2007). In addition, a third novel nitrite-hemoglobin chemistry was proposed by Basu et al. (2007). It has been suggested that nitrite can bind to methemoglobin to produce a nitrite-bound methemoglobin intermediate, which can interconvert to a ferrous-nitrogen dioxide species that reacts with NO to form ferrous hemoglobin and dinitrogen trioxide (N2O3) as in eqs. 4 and 5:
By combining eqs. 1, 4, and 5, the stoichiometry of the overall nitrite-deoxyhemoglobin reaction then becomes
The end product, N2O3, which is a small, uncharged, and nitrosating molecule, is suggested to be capable of diffusing across the red cell membrane, forming red cell S-nitrosothiols and exporting NO by homolysis to NO and the NO2• radical (Basu et al., 2007). Although all of these complex nitrite-hemoglobin reactions are proposed on the basis of carefully designed in vitro experiments, the characterization and validation of some or all of these reactions in vivo have not been reported.
We previously conducted a physiological/pharmacological study in healthy volunteers, which was designed to examine the effect of exogenous sodium nitrite on human forearm blood flow and to characterize sodium nitrite pharmacokinetics (Dejam et al., 2007). We measured plasma nitrite and nitrate, whole blood nitrite, methemoglobin, and iron-nitrosyl hemoglobin concentrations at multiple time points. We modeled the concentration changes of nitrite and the various NO moieties during and after drug administration. The objective was to characterize the in vivo erythrocytic uptake and release and disposition pathways of nitrite and NO species. We hypothesized that the nitrite-hemoglobin reactions as described by eqs. 1 to 3 indeed occur in vivo and that it would be able to characterize the kinetic conversions of nitrite into nitrate, methemoglobin, and iron-nitrosyl hemoglobin in human blood, based on the current knowledge of nitrite-hemoglobin chemistry. The study resulted in a physiological relevant pharmacokinetic model that is a powerful tool in predicting nitrite and NO species concentrations under different dosages and schedules and administration routes. This model further provides insights into the mechanisms of biochemical reactions involving nitrite and other NO species.
Materials and Methods
Human Subjects.
The human study protocol was approved by the institutional review board of the National Heart, Lung, and Blood Institute, National Institutes of Health. All participants provided written informed consent. Five healthy volunteers, 1 male and 4 females, with median (range) age of 27 (22–36) years and weight of 70.8 ± 15.3 kg participated in part A of a previously described forearm blood flow study (Dejam et al., 2007). Subjects were excluded if they had cardiovascular risk factors, liver disease, renal failure, acute and chronic infections, glucose-6-phosphate dehydrogenase deficiency, or cytochrome b5 deficiency. Female participants were not eligible if they had a positive pregnancy test or were breastfeeding. The baseline characteristics of the subjects are summarized in Table 1.
TABLE 1.
Baseline characteristics of the subjects
| Parameter | Mean ± S.D. |
|---|---|
| Hematocrit (%) | 41.4 ± 1.61 |
| Hemoglobin (g/dl) | 13.3 ± 1.16 |
| Methemoglobin (μmol/l) | 13.9 ± 6.92 |
| Iron-nitrosyl hemoglobin (μmol/l) | 0.135 ± 0.053 |
| Plasma nitrite (μmol/l) | 0.113 ± 0.052 |
| Red blood cell nitrite (μmol/l) | 0.291 ± 0.133 |
| Plasma nitrate (μmol/l) | 17.7 ± 5.18 |
Study Procedures.
Study procedures were performed in a quiet hospital room and began at 7:00 AM after subjects had fasted overnight. Venous angiocatheters were inserted into the antecubital veins of both arms for blood collection to determine nitrite and NO species concentrations. An arterial angiocatheter was inserted into the right brachial artery for infusions of saline and sodium nitrite solution and for blood pressure measurements. Heart rate was determined by electrocardiography and pulse oximetry. Methemoglobin was determined by cooximetry at bedside. The sodium nitrite solution was prepared in the Clinical Center Pharmacy Department Pharmaceutical Development Section and administered under Investigational New Drug 70,411.
After line placement, saline was infused via the brachial artery at a rate of 120 ml/h while the subjects were at rest for 20 min. Baseline measurements and blood samples from both arms were then obtained. Saline infusion was continued for another 30 min, and physiological measurements and sample collection were repeated 5 min before drug administration. Sodium nitrite, along with saline to maintain a total infusion volume of 120 ml/h, was then infused at doubling rates of 100, 200, 400, 800, and 1600 nmol/(min · kg) every 5 min for a total of 25 min. After each dose was infused (i.e., every 5 min), blood was drawn from both veins (i.e., ipsilateral and contralateral to the infusion site) for measurement of nitrite and NO species concentrations, and the infusion was paused briefly to determine blood pressure and heart rate. Cooximetry was performed with venous blood obtained from the arm contralateral to the infusion site.
After the dose escalation, the sodium nitrite infusion was stopped, and saline was infused for 180 min. Venous blood samples were collected from the arm contralateral to the infusion site at 5, 10, 20, 30, 60, 90, 120, and 180 min after the cessation of sodium nitrite. Methemoglobin levels at these time points were measured as described above.
After completion of the 180-min saline infusion, nitrite was reinfused at a rate of 400 nmol/(min · kg) for 20 min, followed by 100 nmol/(min · kg) for 100 min. Venous blood samples from the arm contralateral to the infusion site were drawn at 5, 10, 20, 30, 60, 90, and 120 min after the reinitiation of sodium nitrite. Methemoglobin was measured at these time points as well.
Determination of Nitrite and NO Species Concentrations.
Acquisition and processing of blood samples and measurement of whole blood nitrite, plasma nitrite and nitrate, and iron-nitrosyl hemoglobin were described in detail elsewhere (Pelletier et al., 2006). Erythrocyte nitrite concentrations were calculated by eq. 7:
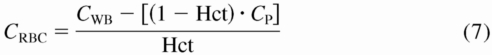 |
where CRBC is erythrocyte concentration, CWB is whole blood concentration, CP is plasma concentration, and Hct is the hematocrit. Methemoglobin levels obtained from cooximetry were converted from percent to micromoles per liter as in eq. 8:
where Hb is hemoglobin.
Characterization of In Vivo Erythrocytic Uptake and Release and Disposition Pathways of Nitrite and NO Species at the Administration Site and in the Systemic Circulation.
Using a base structure model obtained from systemic nitrite pharmacokinetics (Y. Y. Hon, H. Sun, A. Dejam, and M. Gladwin, unpublished data), a physiological pharmacokinetic model was built to characterize the in vivo erythrocytic uptake and release and disposition pathways of nitrite and NO species in plasma and RBCs. Mean concentrations obtained from venous blood samples at the administration site and in the systemic circulation were used for the modeling.
Various physiological pharmacokinetic models with microparameterization were fitted to seven observed NO moieties simultaneously using SAAM II (University of Washington, Seattle, WA). The species modeled included plasma nitrite and nitrate at the administration site and in the systemic circulation, and erythrocyte nitrite, methemoglobin, and iron-nitrosyl hemoglobin in the systemic circulation. During the model-building process, goodness of fit including residual plots, Akaike information criterion, objective function, physiological reasoning, stability, and simplicity, as well as robustness of fit were applied to select the best model. For NO species that have significant baseline values (i.e., plasma nitrate and methemoglobin), the endogenous levels were assumed to be stable and the baseline values were added to the fitted concentrations to reflect the actual observed concentrations.
Results
In this study, two separate nitrite infusions were administered intra-arterially with a 180-min washout in between. The first infusion consisted of five doubling doses of sodium nitrite given consecutively, and the second infusion was administered by a loading dose followed by a maintenance infusion. Figure 1 depicts the mean observed and model predicted concentrations for plasma nitrite and nitrate, erythrocyte nitrite, methemoglobin, and iron-nitrosyl hemoglobin in the systemic circulation. It was observed that the concentration versus time curve of plasma nitrite was very similar to that of the RBCs, and both profiles closely resembled that of the whole blood nitrite (data not shown). Plasma and RBC nitrite concentrations gradually increased for the first 5 to 10 min, probably mediated by the intra-arterial route of delivery and low doses of nitrite during initial infusions and then rapidly increased during the rest of the infusion during dose escalation. Concentrations continued to further increase after the infusion was stopped until peak levels were reached at approximately 10 min postdose. Thereafter, concentrations declined in a manner that resembled monoexponential decay and reached levels close to baseline values 180 min after the end of the infusion. When sodium nitrite was reinitiated at 205 min (20 min loading + 100 min maintenance infusion), concentrations increased immediately, and peak levels were again attained 10 min later after reduction of the infusion rate. During the maintenance infusion, nitrite concentrations decreased slowly to maintain steady-state levels.
Fig. 1.

The mean observed and model predicted concentration versus time profiles for plasma nitrite and nitrate, erythrocyte nitrite, methemoglobin, and iron-nitrosyl hemoglobin in the systemic circulation. Lines represent model-predicted curves and symbols represent actual observations. The nitrate concentration versus time curve during intravenous administration is simulated and included. Predicted profiles for nitrite, methemoglobin, and iron-nitrosyl hemoglobin during intravenous administration are not shown because these curves are similar to those observed during intra-arterial administration. The inset depicts plasma nitrite and nitrate concentrations at the site of administration.
The changes in iron-nitrosyl hemoglobin followed closely those in plasma and RBC nitrite. Concentration rose slowly for the first 5 to 10 min and then increased rapidly and reached the peak level at approximately 10 min after the infusion was stopped. Concentrations decreased thereafter in a logarithmic fashion; the decline was almost parallel to but was slightly slower than those of the nitrite curves. No iron-nitrosyl hemoglobin measurements were available during the reinfusion of sodium nitrite.
Plasma nitrate and methemoglobin exhibited different kinetic behaviors compared with those of nitrite and iron-nitrosyl hemoglobin. An approximate 10-min time delay after the initiation of sodium nitrite was observed before concentrations began to increase from baselines, which were 18 and 14 μM for plasma nitrate and methemoglobin, respectively. Peak concentrations were reached at approximately 30 min after the end of infusion (i.e., approximately 50 min from the start of nitrite infusion), when concentrations started to decrease. Methemoglobin declined faster than plasma nitrate; decline rates for both were slower than those of plasma and RBC nitrite. At the time when nitrite was reinfused, plasma nitrate and methemoglobin had not returned to their baselines. Concentrations of these moieties increased immediately upon the initiation of the second loading infusion, followed by a slower increase over the maintenance infusion.
The inset of Fig. 1 depicts the mean observed and predicted concentrations for venous nitrite and nitrate at the administration site where nitrite was infused intra-arterially. Plasma nitrite and nitrate rapidly increased during dose escalation and reached their peaks at the end of the infusion. These peaks were in the range of 400 to 600 μM and were an order of magnitude higher than those observed in the systemic circulation. In addition, the nitrite peak was higher than the nitrate peak, which was in reverse order of that found in the systemic circulation.
The erythrocytic uptake and release and disposition pathways for each NO moiety at the administration site and in the systemic circulation were well described by a nine-compartment model (Fig. 2), which was expanded from a two-compartment model (Y. Y. Hon, H. Sun, A. Dejam, and M. Gladwin, unpublished data). This physiological pharmacokinetic model consists of three separate components: the “tissue,” “arterial,” and “blood” compartments. The tissue compartment represents tissues into which nitrite distributes from the central compartment as defined below. The arterial compartment, which includes a plasma nitrite and a plasma nitrate compartment, describes the conversion of plasma nitrite into nitrate in venous blood at the administration site. It is also the compartment from which nitrite and nitrate diffuse to the systemic circulation. The term arterial was used because we assumed that venous nitrite concentrations at the administration site were representative of those in the arterial blood, conceivably due to the short transit from the brachial artery to the antecubital vein. The blood compartment, which represents venous blood in the systemic circulation, is divided into plasma and RBC components with six compartments, namely plasma nitrite and nitrate, RBC nitrite, methemoglobin, and iron-nitrosyl hemoglobin. Plasma nitrite is the central compartment of the model, and it represents the parent drug observed in the systemic circulation after intra-arterial administration and tissue distribution of sodium nitrite. In plasma, nitrite is oxidized directly to nitrate, which is subsequently eliminated from the circulation. Alternatively, it undergoes transmembrane uptake by the erythrocytes and is further biotransformed to give nitrate, methemoglobin, and iron-nitrosyl hemoglobin. Nitrate formed in the RBCs is in turn released to the plasma and eliminated, and methemoglobin and iron-nitrosyl hemoglobin are further metabolized to other biological species.
Fig. 2.

Schematic representation of the nine-compartment model for the in vivo erythrocytic uptake and release and disposition pathways of erythrocyte nitrite, plasma nitrite and nitrate, methemoglobin, and iron-nitrosyl hemoglobin. Shaded circles represent compartments in which NO species were modeled. Parameter definitions are found in Table 2.
The definitions and estimated values for all parameters of the physiological pharmacokinetic model are summarized in Table 2. All distribution and disposition pathways of nitrite and various species were well characterized by first-order kinetics. However, the kinetics of methemoglobin during the first infusion was different from that during the second infusion, and two formation rate constants were needed to describe adequately the changes in methemoglobin throughout the entire study period. During dose escalation, methemoglobin was formed with a higher rate constant of 0.155 min−1, compared with 0.090 min−1 during the second infusion. The values for the volumes of distribution were estimated to be within reasonable ranges, with the exception that Va was fixed to 0.071 liter. The model was able to capture the approximate 5- to 10-min slow initial increases in nitrite concentrations during the first infusion, but the delays in nitrite peak concentrations were not adequately described.
TABLE 2.
Parameter estimates for the physiological pharmacokinetic model of plasma nitrite and nitrate, erythrocyte nitrite, methemoglobin, and iron-nitrosyl hemoglobin
| Parameter (Unit) | Definition | Estimate |
|---|---|---|
| k12 (min−1) | Diffusion rate constant of plasma nitrite from the administration site to the systemic circulation | 2.13 |
| k45 (min−1) | Diffusion rate constant of plasma nitrate from the administration site to the systemic circulation | 0.306 |
| k23 (min−1) | Distribution rate constant from the blood to the tissue compartment | 6.04 |
| k32 (min−1) | Distribution rate constant from the tissue to the blood compartment | 0.467 |
| k26 (min−1) | Uptake rate constant of plasma nitrite into red blood cells | 0.256 |
| k75 (min−1) | Diffusion rate constant of nitrate from red blood cells to plasma | 0.013 |
| k14 (min−1) | Formation rate constant of plasma nitrate from nitrite at the administration site | 0.238 |
| k25 (min−1) | Formation rate constant of nitrate from nitrite in plasma | 0.016 |
| k67 (min−) | Formation rate constant of nitrate from nitrite in red blood cells | 0.808 |
| k68 (min−1) | Formation rate constant of iron-nitrosyl hemoglobin | 2.02 |
| k69a (min−1) | Formation rate constant of methemoglobin during the first infusion | 0.155 |
| K69b (min−1) | Formation rate constant of methemoglobin during the second infusion | 0.090 |
| k50 (min−1) | Elimination rate constant of plasma nitrate | 0.014 |
| k80 (min−1) | Elimination rate constant of iron-nitrosyl hemoglobin | 0.161 |
| k90 (min−1) | Elimination rate constant of methemoglobin | 0.043 |
| Va (liters) | Volume of distribution for plasma nitrite and nitrate at the administration site | 0.071a |
| Vp (liters) | Volume of distribution for plasma nitrite and nitrate in the systemic circulation | 2.76 |
| VRBC (liters) | Volume of distribution for red blood cell nitrite and methemoglobin | 0.214 |
| VNOHb (liters) | Volume of distribution for iron-nitrosyl hemoglobin | 6.93 |
Fixed parameter value.
Discussion
Systemic plasma and RBC nitrite concentration versus time profiles exhibited two distinctive features during intra-arterial administration of sodium nitrite in our study. There was a 5- to 10-min slow concentration increase during the first but not the second infusion, and nitrite peaked at approximately 5 to 10 min after cessation and dosage reduction of sodium nitrite. These delays in initial increase and in peak levels are probably due to the intra-arterial route of delivery as well as the low doses of nitrite during initial infusions compared to the second infusion [100 versus 400 nmol/(kg · min)]. Apparently, nitrite did not accumulate fast enough to result in an immediate concentration increase at doses <400 nmol/(kg · min), presumably due to the extensive metabolism (extraction ratio = 0.97) and short half-life (35 min) of sodium nitrite (Y. Y. Hon, H. Sun, A. Dejam, and M. Gladwin, unpublished data).
Using a structural two-compartment model obtained from the systemic circulation (Y. Y. Hon, H. Sun, A. Dejam, and M. Gladwin, unpublished data), we integrated our current understanding of nitrite-hemoglobin chemistry and developed a physiological pharmacokinetic model for nitrite, nitrate, methemoglobin, and iron-nitrosyl hemoglobin. The overall fittings for all the moieties were excellent, considering the complexity of the model and the simultaneous estimation of all but one parameter value. These results suggest that the model adequately characterized the kinetics of the disposition pathways of the NO species and provide strong support to the biological plausibility of the previously described nitrite-hemoglobin reactions. However, this model lost the ability to characterize the delays in nitrite peak concentrations, which were essential features during intra-arterial administration of sodium nitrite and were adequately characterized by the base model (Y. Y. Hon, H. Sun, A. Dejam, and M. Gladwin, unpublished data). Methemoglobin formation was faster during the first infusion, with a rate constant almost twice as high as that during the second infusion. The reason for this difference in kinetic behavior is not known. Perhaps, it is related to the complex and interacting reactions between nitrite, oxyhemoglobin, and deoxyhemoglobin (Huang et al., 2005; Basu et al., 2007; Grubina et al., 2007), subsequently leading to more complex disposition kinetics of methemoglobin. Of note, the parameters (i.e., rate constants) estimated by the model represent the overall rate constants describing the distribution, formation, and elimination of each NO species by all biological processes in the body and, hence, are not the same as those of the individual biochemical reactions and should not be interpreted as such.
Our model parameter values revealed the surprising finding that despite the negative charge, nitrite entered erythrocytes quickly with a rate constant of 0.256 min−1 (i.e., half-life = 2.71 min), as evidenced by the almost identical concentration-time curves between plasma and RBC nitrite. This erythrocytic uptake rate is approximately 4-fold higher than that reported in an in vitro study using a nitrite concentration of 800 μM (half-life of 11 min) (May et al., 2000). The formation of iron-nitrosyl hemoglobin from erythrocyte nitrite, which involves the reduction of nitrite by deoxyhemoglobin to generate NO and reaction of NO with deoxyhemoglobin to form iron-nitrosyl hemoglobin, occurred rapidly as well (k68 = 2.02 min−1; half-life = 0.343 min = 21 s). The overall consumption of iron-nitrosyl hemoglobin was relatively quick (k80 = 0.161 min−1), compared with the metabolism of methemoglobin and elimination of plasma nitrate (k90 = 0.043 min−1 and k50 = 0.014 min−1, respectively). Because elimination was a slower process than formation and was the rate-limiting step, the apparent half-lives after nitrite administration for the three NO species followed the same order as the elimination rate constants (i.e., iron-nitrosyl hemoglobin < methemoglobin < nitrate; ∼40 min < 105 min < 300 min). These estimates of half-life for methemoglobin and nitrate are similar to those values as reported previously (Wagner et al., 1983; Kirk et al., 1993).
Unlike iron-nitrosyl hemoglobin and methemoglobin, which are formed solely inside RBCs, our model showed that systemic nitrate can also be generated directly from the oxidation of nitrite in plasma. However, nitrate production from this route (k25 = 0.016 min−1) was much slower than that by the nitrite-oxyhemoglobin reaction (k67 = 0.808 min−1), consistent with the inefficiency of NO biotransformation to nitrate in human plasma compared with blood cells (Wennmalm et al., 1992). In the arterial compartment where nitrite was infused, nitrate formation from nitrite was higher with a rate constant of 0.238 min−1. This higher rate is attributed in part to a lower median nitrite RBC/plasma concentration ratio [1.27 (0.267–5.84) versus 0.800 (0.405–3.65), p < 0.001] (Y. Y. Hon, H. Sun, A. Dejam, and M. Gladwin, unpublished data) and hence more plasma nitrite available for conversion at the administration site compared with the systemic circulation. The higher oxygenation of the arterial blood could be a contributing factor as well. Regardless of how it is formed, nitrate eventually enters the plasma where it is eliminated from the body via the kidney (Wagner et al., 1983; Wennmalm et al., 1993). Previously, nitrate reduction to nitrite has been shown to occur in vitro and in vivo (Jansson et al., 2008); nanomolar concentrations of nitrite were generated using nitrate concentrations in the 300 to 600 μM range, which were approximately 5- to 10-fold higher than the nitrate peak that was observed in our subjects. We tested the contribution of nitrate reduction in our model by adding the corresponding conversion pathway. The fittings obtained were not as good as those from the current model, and the parameter value for the formation of plasma nitrate from nitrate was very small. These suggest that nitrate reduction to nitrite was a relatively insignificant metabolic pathway during short-term intra-arterial administration of sodium nitrite, which resulted in systemic nitrite concentrations in the low micromolar range.
With use of the current model, it is predicted that when nitrite is administered intravenously, the nitrate concentration would increase slowly and peak at approximately 115 min after the end of the first infusion (Fig. 1, dashed line with no observation), as opposed to a rapid rise and a peak at approximately 30 min after infusion during intra-arterial administration. This results in a large area difference between the concentration versus time curves during intra-arterial versus intravenous administration and demonstrates that the rapid nitrate generation at the administration site contributed significantly to overall nitrate exposure in the systemic circulation. On the other hand, the predicted time to peak methemoglobin level during intravenous administration is approximately 30 min after infusion (data not shown). This time is similar to our current observation when nitrite was infused intra-arterially, indicating that methemoglobin concentrations were not as affected by the administration route as nitrate. Our predictions for these times to reach nitrate and methemoglobin peaks during intravenous administration are in line with the median times to maximal nitrate and methemoglobin concentrations of approximately 60 and 30 min after infusion, respectively, in healthy volunteers (Hunault et al., 2009). These results suggest that the current physiological pharmacokinetic model adequately described the nitrite-nitrate and nitrite-methemoglobin metabolic pathways and is useful in predicting concentrations for these two NO species.
The major limitation of the study is the inability to validate the current model using the limited amount of data available. Model validation is an important process, and it is preferred especially for models that are submitted for regulatory decision making and for those that have clinical applications. We had attempted to validate our model to increase the confidence in the model, even though it was developed mainly for research purposes at this early stage. Model validation can be performed by an external across-subject prediction check using a data-splitting technique and an internal within-subject prediction method. We were unable to build and validate our model by using the data-splitting method because of the small number of subjects participating in the study (n = 5). In fact, our current model was developed using the mean values obtained from the five subjects to increase the confidence in the model. We were also unable to build and validate the model by using the internal within-subject prediction method by leaving out all data from a compartment, a moiety, or a kinetic process (e.g., oxidation of plasma nitrite to nitrate) during model building and then making a prediction for that compartment, moiety, or kinetic process during model calibration. This internal within-subject prediction approach increased the ratio of the number of parameters to the number of observations, making it difficult to fit the data. More importantly, few physiological parameter values are currently available either from in vitro or animal studies to allow us to further assess and validate the model using this latter approach. Nevertheless, the current model provides unique and important insights into the metabolic processes of nitrite, nitrate, methemoglobin, and iron-nitrosyl hemoglobin in vivo. It also establishes a base for performing simulations to further examine the influence of different parameters or processes on the pharmacokinetic profiles of one or all of the NO species as well as for designing future trials on human subjects.
This work was supported by the Intramural Research Program of the National Institutes of Health Clinical Center and National Heart, Lung, and Blood Institute.
M.T.G. is listed as a coinvestor on a National Institutes of Health government patent application on the use of nitrite salts for cardiovascular conditions. All other authors have no conflict of interest.
Parts of this work were previously presented at the following conference: Hon YY, Sun H, Dejam A, and Gladwin MT (2009) A physiological pharmacokinetic model (PPKM) characterizes the in vivo metabolic and disposition pathways of nitrite (NO2−), nitrate (NO3−), methemoglobin (MetHb), and iron nitrosylhemoglobin (NOHb). American Society for Clinical Pharmacology and Therapeutics 110th Annual Meeting; 2009 Mar 18–21; National Harbor, MD. Clin Pharmacol Ther 85 (Suppl 1): S35. American Society for Clinical Pharmacology and Therapeutics, Alexandria, VA.
Article, publication date, and citation information can be found at http://dmd.aspetjournals.org.
doi:10.1124/dmd.110.034355.
- NO
- nitric oxide
- eNOS
- endothelial nitric-oxide synthase
- RBC
- red blood cell
- NO2−
- nitrite
- NO3−
- nitrate
- HbFe3+
- methemoglobin
- HbFe2+-NO
- iron-nitrosyl hemoglobin
- HbFe2+
- deoxyhemoglobin
- HbFeO2
- oxyhemoglobin
- N2O3
- dinitrogen trioxide.
References
- Basu S, Grubina R, Huang J, Conradie J, Huang Z, Jeffers A, Jiang A, He X, Azarov I, Seibert R, Mehta A, Patel R, King SB, Hogg N, Ghosh A, Gladwin MT, Kim-Shapiro DB. (2007) Catalytic generation of N2O3 by the concerted nitrite reductase and anhydrase activity of hemoglobin. Nat Chem Biol 3:785–794 [DOI] [PubMed] [Google Scholar]
- Cosby K, Partovi KS, Crawford JH, Patel RP, Reiter CD, Martyr S, Yang BK, Waclawiw MA, Zalos G, Xu X, Huang KT, Shields H, Kim-Shapiro DB, Schechter AN, Cannon RO, 3rd, Gladwin MT. (2003) Nitrite reduction to nitric oxide by deoxyhemoglobin vasodilates the human circulation. Nat Med 9:1498–1505 [DOI] [PubMed] [Google Scholar]
- Dejam A, Hunter CJ, Tremonti C, Pluta RM, Hon YY, Grimes G, Partovi K, Pelletier MM, Oldfield EH, Cannon RO, 3rd, Schechter AN, Gladwin MT. (2007) Nitrite infusion in humans and nonhuman primates: endocrine effects, pharmacokinetics, and tolerance formation. Circulation 116:1821–1831 [DOI] [PubMed] [Google Scholar]
- Dias-Junior CA, Gladwin MT, Tanus-Santos JE. (2006) Low-dose intravenous nitrite improves hemodynamics in a canine model of acute pulmonary thromboembolism. Free Radic Biol Med 41:1764–1770 [DOI] [PubMed] [Google Scholar]
- Doyle MP, Pickering RA, DeWeert TM, Hoekstra JW, Pater D. (1981) Kinetics and mechanism of the oxidation of human deoxyhemoglobin by nitrites. J Biol Chem 256:12393–12398 [PubMed] [Google Scholar]
- Duranski MR, Greer JJ, Dejam A, Jaganmohan S, Hogg N, Langston W, Patel RP, Yet SF, Wang X, Kevil CG, Gladwin MT, Lefer DJ. (2005) Cytoprotective effects of nitrite during in vivo ischemia-reperfusion of the heart and liver. J Clin Invest 115:1232–1240 [DOI] [PMC free article] [PubMed] [Google Scholar]
- Ford PC, Wink DA, Stanbury DM. (1993) Autoxidation kinetics of aqueous nitric oxide. FEBS Lett 326:1–3 [DOI] [PubMed] [Google Scholar]
- Gladwin MT, Crawford JH, Patel RP. (2004) The biochemistry of nitric oxide, nitrite, and hemoglobin: role in blood flow regulation. Free Radic Biol Med 36:707–717 [DOI] [PubMed] [Google Scholar]
- Gonzalez FM, Shiva S, Vincent PS, Ringwood LA, Hsu LY, Hon YY, Aletras AH, Cannon RO, 3rd, Gladwin MT, Arai AE. (2008) Nitrite anion provides potent cytoprotective and antiapoptotic effects as adjunctive therapy to reperfusion for acute myocardial infarction. Circulation 117:2986–2994 [DOI] [PMC free article] [PubMed] [Google Scholar]
- Grubina R, Huang Z, Shiva S, Joshi MS, Azarov I, Basu S, Ringwood LA, Jiang A, Hogg N, Kim-Shapiro DB, Gladwin MT. (2007) Concerted nitric oxide formation and release from the simultaneous reactions of nitrite with deoxy- and oxyhemoglobin. J Biol Chem 282:12916–12927 [DOI] [PubMed] [Google Scholar]
- Huang Z, Shiva S, Kim-Shapiro DB, Patel RP, Ringwood LA, Irby CE, Huang KT, Ho C, Hogg N, Schechter AN, Gladwin MT. (2005) Enzymatic function of hemoglobin as a nitrite reductase that produces NO under allosteric control. J Clin Invest 115:2099–2107 [DOI] [PMC free article] [PubMed] [Google Scholar]
- Hunault CC, van Velzen AG, Sips AJ, Schothorst RC, Meulenbelt J. (2009) Bioavailability of sodium nitrite from an aqueous solution in healthy adults. Toxicol Lett 190:48–53 [DOI] [PubMed] [Google Scholar]
- Hunter CJ, Dejam A, Blood AB, Shields H, Kim-Shapiro DB, Machado RF, Tarekegn S, Mulla N, Hopper AO, Schechter AN, Power GG, Gladwin MT. (2004) Inhaled nebulized nitrite is a hypoxia-sensitive NO-dependent selective pulmonary vasodilator. Nat Med 10:1122–1127 [DOI] [PubMed] [Google Scholar]
- Jansson EA, Huang L, Malkey R, Govoni M, Nihlén C, Olsson A, Stensdotter M, Petersson J, Holm L, Weitzberg E, Lundberg JO. (2008) A mammalian functional nitrate reductase that regulates nitrite and nitric oxide homeostasis. Nat Chem Biol 4:411–417 [DOI] [PubMed] [Google Scholar]
- Kirk MA, Gerace R, Kulig KW. (1993) Cyanide and methemoglobin kinetics in smoke inhalation victims treated with the cyanide antidote kit. Ann Emerg Med 22:1413–1418 [DOI] [PubMed] [Google Scholar]
- Kosaka H, Imaizumi K, Imai K, Tyuma I. (1979) Stoichiometry of the reaction of oxyhemoglobin with nitrite. Biochim Biophys Acta 581:184–188 [DOI] [PubMed] [Google Scholar]
- Kosaka H, Imaizumi K, Tyuma I. (1982) Mechanism of autocatalytic oxidation of oxyhemoglobin by nitrite. An intermediate detected by electron spin resonance. Biochim Biophys Acta 702:237–241 [DOI] [PubMed] [Google Scholar]
- Kosaka H, Tyuma I. (1987) Mechanism of autocatalytic oxidation of oxyhemoglobin by nitrite. Environ Health Perspect 73:147–151 [DOI] [PMC free article] [PubMed] [Google Scholar]
- Lim DG, Sweeney S, Bloodsworth A, White CR, Chumley PH, Krishna NR, Schopfer F, O'Donnell VB, Eiserich JP, Freeman BA. (2002) Nitrolinoleate, a nitric oxide-derived mediator of cell function: synthesis, characterization, and vasomotor activity. Proc Natl Acad Sci USA 99:15941–15946 [DOI] [PMC free article] [PubMed] [Google Scholar]
- Lundberg JO, Weitzberg E, Gladwin MT. (2008) The nitrate-nitrite-nitric oxide pathway in physiology and therapeutics. Nat Rev Drug Discov 7:156–167 [DOI] [PubMed] [Google Scholar]
- Maher AR, Milsom AB, Gunaruwan P, Abozguia K, Ahmed I, Weaver RA, Thomas P, Ashrafian H, Born GV, James PE, Frenneaux MP. (2008) Hypoxic modulation of exogenous nitrite-induced vasodilation in humans. Circulation 117:670–677 [DOI] [PubMed] [Google Scholar]
- May JM, Qu ZC, Xia L, Cobb CE. (2000) Nitrite uptake and metabolism and oxidant stress in human erythrocytes. Am J Physiol Cell Physiol 279:C1946–C1954 [DOI] [PubMed] [Google Scholar]
- Pelletier MM, Kleinbongard P, Ringwood L, Hito R, Hunter CJ, Schechter AN, Gladwin MT, Dejam A. (2006) The measurement of blood and plasma nitrite by chemiluminescence: pitfalls and solutions. Free Radic Biol Med 41:541–548 [DOI] [PubMed] [Google Scholar]
- Pluta RM, Dejam A, Grimes G, Gladwin MT, Oldfield EH. (2005) Nitrite infusions to prevent delayed cerebral vasospasm in a primate model of subarachnoid hemorrhage. JAMA 293:1477–1484 [DOI] [PubMed] [Google Scholar]
- Rassaf T, Bryan NS, Kelm M, Feelisch M. (2002) Concomitant presence of N-nitroso and S-nitroso proteins in human plasma. Free Radic Biol Med 33:1590–1596 [DOI] [PubMed] [Google Scholar]
- Stamler JS, Simon DI, Osborne JA, Mullins ME, Jaraki O, Michel T, Singel DJ, Loscalzo J. (1992) S-nitrosylation of proteins with nitric oxide: synthesis and characterization of biologically active compounds. Proc Natl Acad Sci USA 89:444–448 [DOI] [PMC free article] [PubMed] [Google Scholar]
- Wagner DA, Schultz DS, Deen WM, Young VR, Tannenbaum SR. (1983) Metabolic fate of an oral dose of 15N-labeled nitrate in humans: effect of diet supplementation with ascorbic acid. Cancer Res 43:1921–1925 [PubMed] [Google Scholar]
- Webb A, Bond R, McLean P, Uppal R, Benjamin N, Ahluwalia A. (2004) Reduction of nitrite to nitric oxide during ischemia protects against myocardial ischemia-reperfusion damage. Proc Natl Acad Sci USA 101:13683–13688 [DOI] [PMC free article] [PubMed] [Google Scholar]
- Wennmalm A, Benthin G, Edlund A, Jungersten L, Kieler-Jensen N, Lundin S, Westfelt UN, Petersson AS, Waagstein F. (1993) Metabolism and excretion of nitric oxide in humans. An experimental and clinical study. Circ Res 73:1121–1127 [DOI] [PubMed] [Google Scholar]
- Wennmalm A, Benthin G, Petersson AS. (1992) Dependence of the metabolism of nitric oxide (NO) in healthy human whole blood on the oxygenation of its red cell haemoglobin. Br J Pharmacol 106:507–508 [DOI] [PMC free article] [PubMed] [Google Scholar]