Abstract
The sodium-coupled transport of citric acid cycle intermediates in the intestine and kidney is mediated by the Na+-dicarboxylate cotransporter, NaDC1. In the kidney, NaDC1 plays an important role in regulating succinate and citrate concentrations in the urine, which may have physiological consequences including the development of kidney stones. In the present study, the impact of nonsynonymous single nucleotide polymorphisms (SNPs) on NaDC1 expression and function was characterized using the COS-7 cell heterologous expression system. The I550V variant had an increased sensitivity to lithium inhibition although there were no significant effects on protein abundance. The L44F variant had no significant effects on expression or function. The membrane protein abundance of the M45L, V117I, and F254L variants was decreased, with corresponding decreases in transport activity. The A310P variant had decreased protein abundance as well as a change in substrate selectivity. The P385S variant had a large decrease in succinate transport Vmax, as well as altered substrate selectivity, and a change in the protein glycosylation pattern. The most damaging variant was V477M, which had decreased affinity for both succinate and sodium. The V477M variant also exhibited stimulation by lithium, indicating a change in the high-affinity cation binding site. We conclude that most of the naturally occurring nonsynonymous SNPs affect protein processing of NaDC1, and several also affect functional properties. All of these mutations are predicted to decrease transport activity in vivo, which would result in decreased intestinal and renal absorption of citric acid cycle intermediates.
Keywords: site-directed mutagenesis, SLC13 family, sodium, succinate, biotinylation
the na+-dicarboxylate cotransporter, NaDC1, belongs to the SLC13 family of anion transporters and is encoded by the SLC13A2 gene (18). NaDC1 is localized to the apical membrane of epithelial cells of the renal proximal tubule and small intestine, where it absorbs citric acid cycle intermediates such as citrate, succinate, and α-ketoglutarate from the diet or tubular filtrate. The activity of NaDC1 in the proximal tubule has been verified by genetic knockout mice, which have increased urinary concentrations of citrate, succinate, and malate (6). The substrates carried by NaDC1 have important physiological functions. Citrate is an important chelator of calcium in the urine, and hypocitraturia is often associated with kidney stone formation (14). Furthermore, citrate excretion in the urine is important for the maintenance of acid-base balance (13). NaDC1 also participates in organic anion secretion in the kidney by contributing dicarboxylates to the organic anion transporters (OAT) (3). Recent studies suggest a possible role for NaDC1 in blood pressure regulation related to the presence of SUCNR1, a succinate receptor located on the apical membrane of cells in the macula densa and distal tubule (26, 30).
Based on the physiological roles of NaDC1, it is possible that molecular variants in the transporter arising from single nucleotide polymorphisms (SNP) could contribute to disease in humans. Some human patients with kidney stones have been reported to have idiopathic hypocitraturia, unrelated to metabolic disorders (4, 25), which could result from increased activity of NaDC1. However, there is currently very little information on the functional consequences of NaDC1 transporter variants. Several polymorphisms have been reported in humans. A previous study has found an association between increased citrate excretion in the urine and a SNP that produces a variant NaDC1, I550V (15). In addition, the dbSNP database lists a number of mutations identified in human populations, none of which have been characterized functionally (28).
In the present study, we evaluated the effects of missense mutations of the SLC13A2 gene on functional properties and expression of the variant hNaDC1 transporters using the COS-7 cell heterologous expression system. All of the variant transporters were expressed on the plasma membrane and had measurable transport activity. The I550V variant found in humans with hypocitraturia (15) had no significant changes in protein expression, but there was an increased sensitivity to lithium inhibition, and the L44F variant had only a slight decrease in transport activity. The M45L, V117I, and F254L variants had decreased plasma membrane expression, with similar decreases in transport activity. The A310P variant had decreased plasma membrane protein expression, without much effect on succinate transport, but an alteration in succinate:citrate selectivity. The P385S variant had a much greater effect on transport properties compared with expression, with a decrease in succinate Vmax and an alteration in the succinate:citrate substrate selectivity. The V477M variant exhibited decreased affinities for succinate and sodium, and a stimulation of transport by lithium. Based on the results, we would predict that many of the variants of hNaDC1 would have decreased transport activity in the kidney and intestine, leading to decreased dietary absorption and increased excretion of succinate and citrate in the urine. Furthermore, the hypocitraturia that is associated with kidney stone formation is not a consequence of these known variants of NaDC1.
METHODS
Site-directed mutagenesis.
The NCBI SNP database (28) identifies 125 SNPs in SLC13A2, the gene coding for NaDC1. Most of the SNPs are located in introns, but eight SNPs code for missense mutations in NaDC1 (Table 1). The mutations were produced in hNaDC1 cDNA by site-directed mutagenesis with the QuikChange site-directed mutagenesis kit (Stratagene). The plasmid vector for all of the constructs was pcDNA3.1.
Table 1.
Mutations of hNaDC1 made in the present study based on nonsynonymous polymorphisms of the hNaDC1 gene (SLC13A2)
| Amino Acid Mutation | Allele | Location | Allele Frequency | dbSNP ID |
|---|---|---|---|---|
| L44F | C→T | Exon 2 | 0.028 | rs45443898 |
| M45L | A→C | Exon 2 | 0.344 | rs16964363 |
| V117I | G→A | Exon 3 | ND | rs11568463 |
| F254L | T→C | Exon 6 | ND | rs11568461 |
| A310P | G→C | Exon 7 | 0.004 | rs11568441 |
| P385S | C→T | Exon 8 | 0.007 | rs45546232 |
| V477M | G→A | Exon 10 | 0.004 | rs11568476 |
| I550V | A→G | Exon 12 | 0.50 | rs11567842 |
Allele frequency is from the NCBI dbSNP database (www.ncbi.nlm.nih.gov/SNP). NaDC1, Na+-dicarboxylate cotransporter; ND, not determined.
Expression of hNaDC1 variants in COS-7 cells.
Variants were expressed in COS-7 cells, as described previously (32). Briefly, the cells were cultured in DMEM containing Glutamax and 25 mM HEPES (Invitrogen, Carlsbad, CA) supplemented with 10% heat-inactivated fetal calf serum, 100 U/ml penicillin, and 100 μg/ml streptomycin at 37°C in 5% CO2. Cells were plated on collagen-coated plates at 0.7 × 10⁵ cells/well (24 wells) or 2 × 10⁵ cells/well (6 wells) and transfected using Fugene HD (Roche) at a 9:2 ratio (1.8 μl Fugene HD and 0.4 μg plasmid DNA) for 24-well plates or a 6:2 ratio (6 μl Fugene HD and 2 μg plasmid DNA) for 6-well plates. Coexpression experiments with two plasmids were done by combining 1.8 μl Fugene HD with 0.2 μg of each plasmid DNA.
Transport assays.
Transport assays were carried out 48 h after transfections, also as described (20, 21, 32). For the assays, each well was washed twice with choline buffer to remove medium, then incubated with [2,3-14C]succinate (∼50 mCi/mmol, ∼10 μM, Moravek) in sodium buffer for 30 min at room temperature. The transport buffer volume was 0.25 ml (24-well plates) or 1 ml (6-well plates). The sodium transport buffer contained (in mM) 140 NaCl, 2 KCl, 1 MgCl2, 1 CaCl2, and 10 HEPES, pH adjusted to 7.4 with 1 M Tris, and the choline transport buffer contained equimolar cholineCl in place of NaCl. The uptake assays were stopped, and extracellular radioactivity removed with four 1 ml (24-well plates) or 3 ml (6 well plates) washes with choline buffer. Cells were dissolved in 1% SDS, transferred to scintillation vials, and counted. For all experiments, uptakes in vector-transfected cells were subtracted from uptakes in NaDC1 plasmid-transfected cells to correct for background counts.
Succinate kinetic experiments were done using [3H]succinate (ViTrax) to increase the specific activity. Nonradioactive succinate at different concentrations was combined with constant [3H]succinate, and 10-min uptakes were measured in the presence of sodium, as described (32). Kinetic constants were calculated by nonlinear regression to the Michaelis-Menten equation. For sodium activation experiments, the transport of ∼10 μM [14C]succinate was measured in transport buffer containing sodium concentrations from 0 to 140 mM, with NaCl replaced by cholineCl. Data were fitted to the Hill equation, v = (Vmax·[Na+])nH/(KNa + [Na+])nH , where v is the initial rate of succinate uptake, Vmax is the maximum rate at saturating sodium concentrations, [Na+] is the sodium concentration, KNa is the concentration of sodium that produces ½ Vmax , and nH is the Hill coefficient.
Transport specificity ratio measurements.
For dual-label transport assays, the cell monolayers were incubated for 20 min in sodium transport buffer together with 10 μM [3H]succinate and 20 μM [14C]citrate, as described previously (16). The transport specificity ratio (TSR) was calculated using TSR = (vsuccinate/vcitrate)·([citrate]/[succinate]), where vsuccinate and vcitrate are the rates of transport of [3H]succinate and [14C]citrate, and [citrate] and [succinate] are the concentrations of citrate and succinate, respectively (10).
Cell surface biotinylations.
The cell surface expression of NaDC1 variants in COS-7 cells was determined using the membrane-impermeant reagent sulfo-NHS-LC-biotin (Pierce), also as described previously (20). Briefly, each well of cells in six-well plates was washed 3× with 3 ml PBS, pH 9, containing 1 mM each Ca2+ and Mg2+ (PBS/CM), then incubated 30 min at room temperature with 0.5 ml, 1.5 mg/ml sulfo-NHS-LC-biotin (Pierce) prepared in PBS-CM, followed by 20 min on ice with 3 ml cold Quench buffer (PBS/CM with 100 mM glycine). Lysis buffer (1% Triton X-100, 150 mM NaCl, 5 mM EDTA, 20 mM Tris, pH 7.5, supplemented with 10 μg/ml pepstatin, 10 μg/ml leupeptin, and 0.5 mM phenylmethylsulfonyl fluoride) was added (0.5 ml/well) followed by a 30-min incubation on ice with rocking. The lysed cells were pelleted, and the supernatants were incubated with 50 μl Immunopure Immobilized Streptavidin (Pierce) overnight at 4°C with end-over-end rotation. The next day the beads were washed, and the samples were used in Western blotting. Blots were incubated with 1:1,000 dilution of anti-NaDC-1 antibodies, followed by 1:7,500 dilution of peroxidase-conjugated anti-rabbit IgG secondary antibody (Jackson Labs). Detection was done using Pierce Supersignal West Pico chemiluminescent substrate, and images were quantitated using an Image Station 4000R (Carestream Scientific).
Some of the intracellular protein samples were deglycosylated using peptidyl-N-glycanase F (PNGase F; New England Biolabs), according to the manufacturer's directions and as described (24). The samples were denatured by boiling 10 min in glycoprotein denaturing buffer, then incubated at 37°C for 3 h with PNGase F. Controls were treated in the same way but were incubated with buffer instead of enzyme. The samples were analyzed by Western blotting.
Statistics.
Duplicate or quadruplicate measurements were made for each data point. The experiments were repeated with at least three different batches of transfected cells from different passage numbers. Significant differences between groups were identified by Student's t-test or ANOVA with P < 0.05. Data are reported as means ± SE.
RESULTS
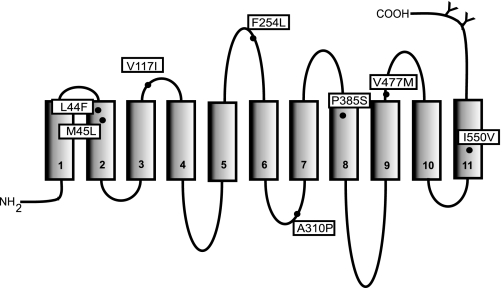
Eight of the ∼125 single nucleotide polymorphisms that have been identified to date in the SLC13A2 gene produce missense mutations in the NaDC1 amino acid sequence. Figure 1 shows the locations of these coding variants in the predicted secondary structure of human NaDC1 (hNaDC1). To determine the functional consequences of the variants, we characterized their functional properties and protein abundance after heterologous expression in COS-7 cells.
Fig. 1.
Predicted topology model of human Na+-dicarboxylate cotransporter (hNaDC1) showing the amino acid variants generated by nonsynonymous single nucleotide polymorphisms (SNPs). The 11 transmembrane helices are shown as numbered rectangles. The N terminus is intracellular, and the extracellular C terminus contains two N-glycosylation sites (indicated by Y). The position of the variant amino acids is shown by a filled circle. The variant names consist of the single-letter amino acid code found in the wild-type transporter, followed by the number of the amino acid, and finally the amino acid found in the variant at that position.
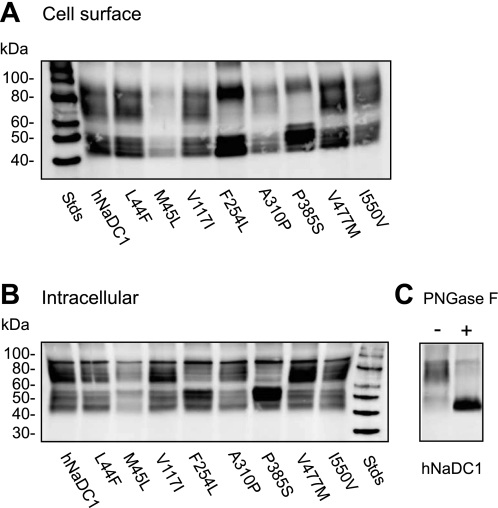
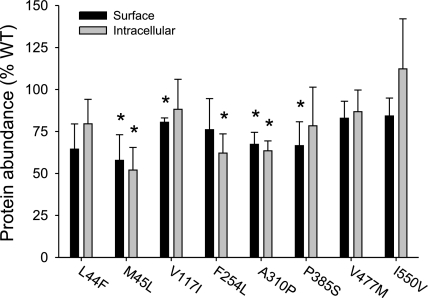
The cell surface protein expression of the hNaDC1 coding variants was determined by cell surface biotinylation with the impermeant reagent sulfo-NHS-LC biotin (Fig. 2). Intracellular labeling of lysed cells was also measured. Western blots of NaDC1 contain multiple protein bands, representing differently glycosylated forms of the protein. The hNaDC1 sequence contains two N-glycosylation sites at the carboxy terminus, one of which is conserved in all the members of the family (22). In the 7.5% acrylamide gels shown here (Fig. 2), the upper highly glycosylated forms were in a broad band centered around ∼75 kDa and the lower core-glycosylated forms were in a broad protein band centered around ∼47 kDa. After deglycosylation with PNGaseF, the broad bands were greatly reduced in abundance, and a sharp protein band with faster mobility appeared. In the blot shown in Fig. 2C, the lower core-glycosylated proteins were ∼50 kDa and the deglycosylated protein was ∼47 kDa. All of the hNaDC1 variants were expressed on the plasma membrane (Figs. 2 and 3). In general, the abundance of the proteins on the plasma membrane was similar to their intracellular abundance (Fig. 3). For example, the M45L variant was ∼50% as abundant as the wild-type hNaDC1, and the abundance was similar in cell-surface and intracellular samples. The P385S variant seemed to be deficient in the higher mass glycosylated form (Fig. 2), which may be a consequence of protein misfolding.
Fig. 2.
Western blots of hNaDC1 and variants. Cell surface (A) and intracellular proteins (B) from the same transfected cells are shown. COS-7 cells were transiently transfected with wild-type or variant hNaDC1 cDNA as described in methods. Forty-eight hours later, cell monolayers were treated with sulfo-NHS-LC-biotin and precipitated with streptavidin-agarose. Intracellular protein samples were taken after cell lysis. Western blots of biotinylated proteins were treated with anti-NaDC1 antibodies. C: deglycosylation of the same hNaDC1 sample (shown in B, lane 1) with PNGase F (+). The control sample was incubated in the same buffer but without the enzyme (−).
Fig. 3.
Summary of cell surface and intracellular protein abundance of hNaDC1 variants expressed in COS-7 cells. The hNaDC1 and variant protein bands from multiple Western blots, such as the one shown in Fig. 2, were quantitated. The results are expressed as a percentage of the wild-type hNaDC1 abundance from the same blot. Values are means ± SE; n = 4 separate biotinylation experiments. *Significant difference from hNaDC1, P < 0.05.
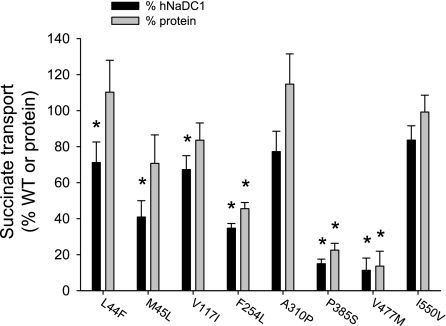
All of the variants had measurable succinate transport activity, although most had reduced activity compared with the wild-type (Fig. 4). Four of the eight variants had <50% of the transport activity of the wild-type (M45L ∼45%, F254L ∼30% and P385S, V477M ∼10%). The transport activity of the variants was also expressed as a percentage of the mean cell surface protein abundance (from Fig. 3). As shown in Fig. 4, the transport activity was still significantly decreased in the F254L, P385S, and V477M variants. The effect of voltage was tested by measuring transport of [14C]succinate in the presence of 25 μg/ml valinomycin, with and without additional extracellular potassium (105 mm NaCl+35 mm cholineCl vs. 105 mm NaCl+35 mm KCl). In all cases, the transport in the presence of increased extracellular potassium resulted in ∼20% inhibition. There were no significant differences between the variants and wild-type hNaDC1 (results not shown).
Fig. 4.
Summary of succinate transport activity of hNaDC1 variants expressed in COS-7 cells. The transport of [14C]succinate (10 μM) was measured in sodium-containing buffer for 30 min. The transport activity for each variant is expressed as a percentage of the transport activity of wild-type hNaDC1 from the same transfection experiment (black bars), or as a percentage of the mean cell surface protein abundance from Fig. 3 (grey bars). Values are means ± SE; n = 3–4 separate experiments. *Significant difference from hNaDC1, P < 0.05.
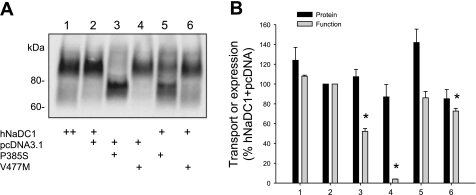
Because the variants are very likely to be found in heterozygous form, we tested whether expression of the P385S and V477M variants, which had low transport activity, had any effect on the function or expression of wild-type hNaDC1. The hNaDC1 transfections were done as usual (Fig. 5A, lane 1) or with half the normal amount of hNaDC1 DNA together with an equal amount of the vector plasmid, pcDNA3.1 (lane 2). There were no significant differences between the two groups in either protein abundance or transport activity (Fig. 5B, lanes 1 and 2). Figure 5A, lanes 3 and 4, shows the cell surface expression of P385S or V477M together with the pcDNA3.1 vector. The cell surface protein abundance of the two variants was not different from the wild-type, but the transport activity of both variants was low, similar to the previous experiments shown in Figs. 2–4. The combination of hNaDC1 and P385S did not have a significant effect on either expression or transport activity (Fig 5, lane 5). However, the combination of hNaDC1 and V477M resulted in a small but significant decrease in transport activity (Fig. 5, lane 6), suggesting a possible interaction between the two proteins.
Fig. 5.
Effects of coexpression of hNaDC1 and the 2 variants with the lowest activity, P385S and V477M. COS-7 cells were transfected with hNaDC1 as usual (0.4 μg/well DNA, lane 1), or with a combination of 0.2 μg/well hNaDC1 or variant cDNA together with 0.2 μg/well vector plasmid (pcDNA31). Lanes 5 and 6 show the cotransfection of 0.2 μg/well hNaDC1 and 0.2 μg/well P385S or V477M. A: Western blot of cell-surface biotinylated proteins. B: summary of protein expression and succinate transport activity relative to the hNaDC1+pcDNA group (control). Values are means ± SE; n = 4 separate experiments. *Significant difference from control, P < 0.05.
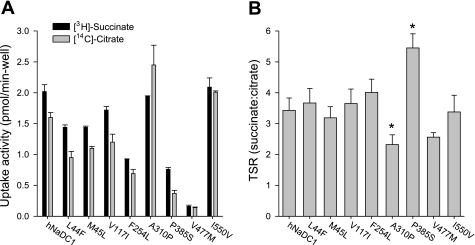
We next determined whether the variants had alterations in substrate specificity by measuring the competitive transport of [3H]succinate and [14C]citrate (in the same transport reaction) (Fig. 6A). The TSR serves to identify mutations that alter the relative changes in catalytic efficiency (kcat/Km) of two substrates, in this case succinate and citrate (10). The TSR is useful for identifying relative changes in substrate selectivity, and it is independent of protein expression. As shown in Fig. 6B, most of the variants exhibited similar TSR values as the wild-type hNaDC1, ∼3.4. However, the A310P variant had a significantly lower TSR value of 2.3, which could be a consequence of a greater inhibition of succinate transport by citrate or less inhibition of citrate transport by succinate (Fig. 6A). P385S had a significantly higher TSR value of 5.5, which could come from lower inhibition of succinate transport by citrate, or increased inhibition of citrate transport by succinate. The results suggest that the residues at positions 310 and 385 may be important in distinguishing succinate from citrate in hNaDC1.
Fig. 6.
Dual-label competitive transport assay of hNaDC1 and variants. A: competitive uptake of [3H]succinate (10 μM) and [14C]citrate (20 μM) by hNaDC1 variants expressed in COS-7 cells. The transport assay was done for 20 min. Values are means ± SE; n = 4 wells from a single transfection. B: transport specificity ratios (TSR; succinate:citrate) of hNaDC1 variants calculated from competitive uptake data, such as those shown in A. Values are means ± range or SE; n = 2 (M45L) of 4 separate experiments. *P < 0.05, significantly different from hNaDC1.
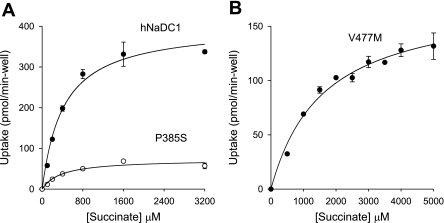
Succinate kinetic parameters were measured for all of the variants (Table 2 and Fig. 7). Most of the Km and Vmax values for the variants were similar to those of the wild-type. The Km for succinate in hNaDC1 expressed in COS-7 cells was 590 μm, similar to the value of 800 μm measured in previous studies using the Xenopus laevis oocyte expression system (23). Although the P385S variant had a much lower transport activity than the wild-type, this was due to a decrease in Vmax rather than Km (Fig. 7A and Table 2). The V477M variant had very low transport activity and had to be assayed in six-well plates. The Km for succinate in V477M was increased to 1.6 mm in the experiment shown in Fig. 7B, and the average of three experiments was 2.6 mm (Table 2). The Vmax of V447M was lower than that of the wild-type (Fig. 7B and Table 2). Note that wells in 6-well plates have about four times the surface area compared with 24-well plates, and the Vmax is expressed per well.
Table 2.
Kinetic parameters for succinate transport by hNaDC1 and variants
| Variant | Km, μM | Vmax, pmol·well−1·min−1 | Number. |
|---|---|---|---|
| hNaDC1 | 590 ± 175 | 483 ± 41 | 3 |
| L44F | 531 ± 5 | 347 ± 49 | 2 |
| M45L | 838 ± 51 | 410 ± 22 | 2 |
| V117I | 430 ± 113 | 329 ± 26 | 2 |
| F254L | 829 ± 61 | 316 ± 43 | 3 |
| A310P | 482 ± 53 | 364 ± 35 | 2 |
| P385S | 470 ± 93 | 84 ± 11 | 2 |
| V477M | 2,572 ± 491* | 274 ± 112 | 3 |
| I550V | 457 ± 49 | 479 ± 54 | 3 |
Values are means ± range (n = 2 experiments) or SE (n = 3). Transporters were expressed in COS-7 cells in 24-well plates (6 wells for V477M), and transport of [3H]succinate was measured for 10 min at room temperature.
Significant difference from human (h) NaDC1, P < 0.05.
Fig. 7.
Succinate kinetics in hNaDC1 and variants. Transport of [3H]succinate at different concentrations was measured in sodium-containing buffer for 10 min. Data are corrected for background transport in vector-transfected cells. Values are means ± range of duplicate measurements from 24-well plate (A) or triplicate measurements from 6-well plate (B). Note that the well area in 6-well plate is approximately 4 times the size of a well from a 24-well plate. Km values (in μM) were 420 (hNaDC1), 376 (P385S), and 1,605 (V477M). Vmax values (in pmol·min−1·well−1) were 403 (hNaDC1), 73 (P385S), and 176 (V477M).
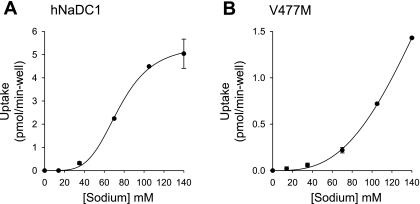
The sodium activation kinetics of hNaDC1 and the variants are shown in Table 3 and Fig. 8. The KNa for hNaDC1 in the single experiment shown in Fig. 8 was 75 mm, and the mean of four separate experiments was 97 mm (Table 3), similar to our previous findings for hNaDC1 expressed in X. laevis (23). Most of the variants had KNa values that were similar to those of hNaDC1 (Table 3). The sodium activation curve for V477M, however, was shifted to the right, and there was no saturation at the highest sodium concentration of 140 mm used in the experiments (Fig. 8). Therefore, it was not possible to accurately fit the data to the Hill equation, although it is likely that the KNa is greater than that of the wild-type.
Table 3.
Sodium activation of [14C]succinate transport (∼12 μM) in hNaDC1 and variants
| Variant | KNa, mM | Vmax, pmol·well−1·min−1 | nH | Number |
|---|---|---|---|---|
| hNaDC1 | 96.5 ± 14.8 | 11.2 ± 2.2 | 3.53 ± 0.44 | 5 |
| L44F | 91.5 ± 5.3 | 9.3 ± 1.5 | 3.03 ± 0.17 | 3 |
| M45L | 75.4 ± 8.5 | 5.4 ± 0.4 | 2.94 ± 0.21 | 3 |
| V117I | 81.1 ± 5.5 | 10.0 ± 1.9 | 4.03 ± 0.50 | 3 |
| F254L | 98.8 ± 4.3 | 4.0 ± 0.6 | 3.12 ± 0.07 | 2 |
| A310P | 85.7 ± 5.2 | 9.0 ± 0.7 | 3.8 ± 0.50 | 3 |
| P385S | 100.2 ± 12.8 | 2.7 ± 0.9 | 3.59 ± 0.53 | 3 |
| V477M | NF | NF | NF | 3 |
| I550V | 71.9 ± 0.8 | 8.6 ± 1.9 | 4.73 ± 1.09 | 3 |
Values are means ± range (n = 2 experiments) or SE (n = 3). Transport was measured in sodium concentrations ranging from 0 to 140 mM, with choline Cl replacing NaCl. NF, not possible to fit the data because the curves did not saturate; nH, Hill coefficient.
Fig. 8.
Sodium activation of succinate transport in hNaDC1 (A) and V477M (B). Transport of 10 μM [14C]succinate was measured in sodium concentrations up to 140 mM (NaCl was replaced by cholineCl). Values are means ± range of duplicate measurements from a single experiment conducted in 24-well plates (A) or 6-well plates (B). The KNa value for hNaDC1 was 75 mM. The data for V477M could not be fitted accurately.
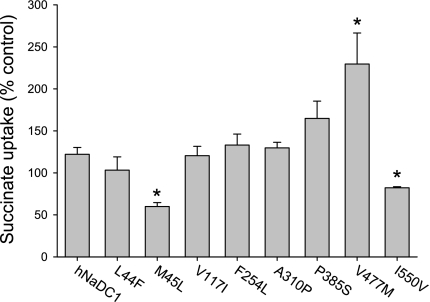
Many of the members of the SLC13 family exhibit sensitivity to lithium, which can compete with one of the three sodium binding sites in the protein. Some NaDC1 orthologs, such as rabbit (rb) NaDC1, are very sensitive to inhibition by lithium in the presence of sodium (23), whereas other members of the family, such as NaCT, are stimulated by low concentrations of lithium (7). Wild-type hNaDC1 is relatively insensitive to the effects of lithium (23). In COS-7 cells, hNaDC1 was slightly stimulated by 14 mm LiCl in the presence of 126 mm NaCl (Fig. 9). Most of the variants were similar in lithium sensitivity to the wild-type. Two of the variants, M45L and I550V, were significantly inhibited by the same concentration of lithium, and the V477M variant had more than double the transport activity in the presence of lithium. The results suggest that these variants have alterations in the high-affinity cation binding site that interacts with lithium.
Fig. 9.
Effect of lithium on sodium-coupled succinate transport. The transport of 10 μM [14C]succinate was measured in transport buffer containing 90% NaCl+10% LiCl or cholineCl (126 mM NaCl with 14 mM LiCl or cholineCl). The transport activity in the presence of lithium was expressed as a percentage of the transport activity in the presence of choline (control). Values are means ± SE; n = 3–5 separate experiments. *Significant difference from hNaDC1, P < 0.05.
DISCUSSION
The dbSNP database lists 125 SNPs in the SLC13A2 gene that codes for NaDC1 (28). Eight of the SNPs are nonsynonymous, leading to a change in amino acid sequence. In the present study, we characterized the functional properties and protein expression of the eight nonsynonymous variants of hNaDC1. Seven of the eight variants had alterations in protein targeting to the plasma membrane or in functional properties, resulting in decreased transport activity. NaDC1 protein is found on the apical membrane in small intestinal and renal proximal tubule cells. Therefore, a decrease in transport activity would be expected to result in decreased absorption of citric acid cycle intermediates from the diet, as well as increased excretion of these metabolites in the urine.
The I550V variant, previously reported in kidney stone patients (15), had only a modest effect on transporter function. There was a decrease in plasma membrane protein abundance of ∼20% and a corresponding decrease in transport activity. The only notable effect on function was an increased sensitivity to inhibition by lithium, indicating that one of the cation binding sites in NaDC1 is affected by a mutation at position 550. NaDC1 contains three cation binding sites, one of which interacts with lithium, leading to an inhibition of transport (19). hNaDC1 is less sensitive to inhibition by lithium than rabbit NaDC1 (23), which contains a valine at the equivalent position. It is possible that a valine at position 550 results in a higher affinity lithium binding site. Isoleucine and valine are both neutral, hydrophobic amino acids with branched side chains. The I550V polymorphism is common, with an allele frequency of 0.5, according to the dbSNP database. There may be an association between hypocitraturia and the presence of isoleucine at position 550 (i.e., the wild-type allele). Human subjects with Ile-550 had somewhat lower urinary citrate excretion compared with those having valine at this position (15), although the patients were not on controlled diets. Lower urinary citrate excretion (hypocitraturia) could be the result of increased transport activity of NaDC1, which would increase citrate reabsorption from the tubular fluid (5). However, there was no clear association of the I550V polymorphism with renal stone formation (15) or with longevity (12). Longevity was investigated because mutations in the Drosophila homolog of NaDC1, named Indy, have been reported to extend lifespan (31), although some recent studies have contradicted this assertion (29).
Two hNaDC1 variants, V117I and F254L, resulted in decreased protein abundance at the plasma membrane and corresponding decreases in transport activity. The L44F variant had no significant effects on protein expression or function. V117I and F254L are predicted to be in extracellular loops two and three (Fig. 1). The results suggest a possible role of the extracellular loops of NaDC1 in trafficking and regulation. It should be noted that protein targeting in the COS-7 cell overexpression system could be different from that in the native epithelia. For example, the CFTR protein is localized primarily on the plasma membrane in epithelial cells, but is also abundant intracellularly when overexpressed in COS-7 cells (1). In addition to changes in protein targeting, the NaDC1 variants could produce slight changes in protein folding that affect protein processing without an effect on transport activity. The three polymorphisms are all predicted to affect function by Panther analysis, whereas SIFT analysis predicts that only L44F and F254L will have an effect (Table 4).
Table 4.
Comparison of experimental results from this study and predictions of the effects of SNPs using Panther subSPEC (2) and SIFT (12) analysis
| Effects on Protein |
Panther |
SIFT |
||||
|---|---|---|---|---|---|---|
| Variant | Expression | Function | Pdeleterious | Predict effect? | SIFT score | Predict effect? |
| L44F | No | No | 0.68 | Yes | 0.04 | Yes |
| M45L | Yes | Yes | 0.56 | Yes | 0.05 | Yes |
| V117I | Yes | No | 0.76 | Yes | 0.60 | No |
| F254L | Yes | No | 0.78 | Yes | 0.00 | Yes |
| A310P | Yes | Yes | 0.86 | Yes | 0.28 | No |
| P385S | Yes | Yes | 0.79 | Yes | 0.00 | Yes |
| V477M | Yes | Yes | 0.87 | Yes | 0.03 | Yes |
| I550V | No | No | 0.47 | No | 1.00 | No |
SNPs, single nucleotide polymorphisms; Pdeleterious, probability that a mutation will impair the function of the protein, where Pdeleterious >0.5 is predicted to be negative. SIFT score predicts whether a mutation will be neutral or not tolerated.
Four of the variants, M45L, A310P, P385S, and V477M, had changes in protein expression as well as function. All are predicted to produce changes in protein function by both Panther and SIFT analysis (Table 4). Met-45 is located in TM2 (Fig. 1). The M45L variant had protein abundance, and corresponding transport activity, ∼40–50% of that of the wild-type. The frequency of the M45L polymorphism is quite high, 0.34 (Table 1). There is a report of a single human subject heterozygous for M45L with increased urinary citrate concentrations, which could come from a decrease in NaDC1 activity (15). It is likely that homozygous M45L would result in even greater urinary citrate excretion. In the present study, the M45L variant also had an increased sensitivity to inhibition by lithium, indicating a change in cation affinity in one of the three cation binding sites.
The A310P variant, predicted to be in an intracellular loop between transmembrane (TM) 6 and 7, did not have any significant changes in succinate Km or Vmax values. However, the succinate kcat may be increased because there was a decrease in protein expression by ∼40% with no change in Vmax. The A310P variant had a change in substrate selectivity between succinate and citrate, as shown by a decreased TSR. The TSR identifies differences in substrate binding affinity in the transition state for one or both of the substrates. In a single experiment, there was only a slight change in citrate kinetics: wild-type Km 3.6 mM, Vmax 540 pmol·min−1·well−1 vs. A310P Km 3.0 mM, Vmax 485 pmol·min−1·well−1. Therefore, the change in TSR could be related to relative changes in kcat for succinate and citrate. In a previous study, the TM7 region including the associated loop and Ala-310 were found to be involved in determining citrate Km; chimeras between hNaDC1 and rbNaDC1 had altered citrate kinetics (9).
There was a large decrease in succinate transport activity in the P385S variant, representing a decrease in succinate Vmax with no change in Km. The Western blots showed a change in the glycosylation pattern compared with hNaDC1; the P385S protein had a decrease in the high-molecular-weight glycosylation products, corresponding to the mature glycosylated protein. Our previous study showed that glycosylation in rbNaDC1 is important for protein targeting but not for activity, but it is possible that the human ortholog is different (22). The proline at position 385 is conserved in all members of the SLC13 family, and it is predicted to be near the extracellular end of TM8. Prolines are often important residues in membrane proteins, including NaDC1 (8) and may act as molecular hinges during conformational changes (27). The P385S variant also had altered recognition of citrate compared with succinate, as shown by an increased TSR.
The greatest impairment of function was seen in the V477M variant. This polymorphism is rare, with an allele frequency of 0.04 (Table 1) and could represent a mutation. Val-477 is located at the outer end of TM9, a region of the protein that changes accessibility to the outside during the conformational changes associated with transport (17). The corresponding amino acid in rbNaDC1 is Ala-480, which is exposed to the outside of the cell in the presence of sodium but seems to be occluded in the absence of sodium. Furthermore, the A480C mutant of rbNaDC1 had a large decrease in Vmax as well as substrate protection of MTSET labeling (17). In the present study, we found that V477M had a 90% decrease in succinate transport activity compared with the wild-type, without a significant decrease in protein abundance. This variant also appeared to interact with wild-type hNaDC1 in coexpression experiments. The V477M variant had decreased affinity for succinate and sodium. The transport of succinate was more than doubled in the presence of 14 mM lithium in V477M, which implies a change in the high-affinity cation binding site.
In conclusion, we have characterized the functional properties and protein expression of eight coding region variants of hNaDC1. Most of the variants appeared to decrease transport activity, by either decreased protein expression or altered transport kinetics and substrate selectivity. These polymorphisms are predicted to result in decreased absorption of citric acid cycle intermediates in the intestine and kidney, leading to increased excretion of these metabolites in the urine. None of these known variants of NaDC1 is likely to result in nephrolithiasis, which is associated with decreased urinary citrate. It is possible that variations in regulatory regions of the SLC13A2 gene will result in increased production of NaDC1 protein and the consequent hypocitraturia, but these SNPs have not been characterized functionally as yet.
GRANTS
This work was supported by National Institute of Diabetes and Digestive and Kidney Diseases Grant DK46269 (AMP).
DISCLOSURES
No conflicts of interest, financial or otherwise, are declared by the authors.
ACKNOWLEDGMENTS
We thank Alva Leung and Jeffrey Young for help in making solutions and Richard Jensen for providing technical assistance during the early stages of this project.
REFERENCES
- 1.Bertrand CA, Frizzell RA. The role of regulated CFTR trafficking in epithelial secretion. Am J Physiol Cell Physiol 285: C1–C18, 2003 [DOI] [PubMed] [Google Scholar]
- 2.Brunham LR, Singaraja RR, Pape TD, Kejariwal A, Thomas PD, Hayden MR. Accurate prediction of the functional significance of single nucleotide polymorphisms and mutations in the ABCA1 gene. PLoS Genet 1: e83, 2005 [DOI] [PMC free article] [PubMed] [Google Scholar]
- 3.Dantzler WH, Evans KK. Effect of αKG in lumen on PAH transport by isolated perfused proximal tubules. Am J Physiol Renal Fluid Electrolyte Physiol 271: F521–F526, 1996 [DOI] [PubMed] [Google Scholar]
- 4.Hamm LL, Hering-Smith KS. Pathophysiology of hypocitraturic nephrolithiasis. Endocrinol Metab Clin North Am 31: 885–893, 2002 [DOI] [PubMed] [Google Scholar]
- 5.He Y, Chen X, Yu Z, Wu D, Lv Y, Shi S, Zhu H. Sodium dicarboxylate cotransporter-1 expression in renal tissues and its role in rat experimental nephrolithiasis. J Nephrol 17: 34–42, 2004 [PubMed] [Google Scholar]
- 6.Ho HT, Ko BC, Cheung AK, Lam AK, Tam S, Chung SK, Chung SS. Generation and characterization of sodium-dicarboxylate cotransporter-deficient mice. Kidney Int 72: 63–71, 2007 [DOI] [PubMed] [Google Scholar]
- 7.Inoue K, Zhuang L, Maddox DM, Smith SB, Ganapathy V. Human sodium-coupled citrate transporter, the orthologue of Drosophila Indy, as a novel target for lithium action. Biochem J 374: 21–26, 2003 [DOI] [PMC free article] [PubMed] [Google Scholar]
- 8.Joshi AD, Pajor AM. Role of conserved prolines in the structure and function of the Na+/dicarboxylate cotransporter 1, NaDC1. Biochemistry 45: 4231–4239, 2006 [DOI] [PMC free article] [PubMed] [Google Scholar]
- 9.Kahn ES, Pajor AM. Determinants of substrate and cation affinities in the Na+/dicarboxylate cotransporter. Biochemistry 38: 6151–6156, 1999 [DOI] [PubMed] [Google Scholar]
- 10.King SC. The “Transport Specificity Ratio”: a structure-function tool to search the protein fold for loci that control transition state stability in membrane transport catalysis. BMC Biochem 5: 16, 2004 [DOI] [PMC free article] [PubMed] [Google Scholar]
- 11.Kumar P, Henikoff S, Ng PC. Predicting the effects of coding non-synonymous variants on protein function using the SIFT algorithm. Nat Protoc 4: 1073–1081, 2009 [DOI] [PubMed] [Google Scholar]
- 12.Lee P, Ho N, Gelbart T, Beutler E. Polymorphisms in the human homologue of the Drosophila Indy (I'm not dead yet) gene. Mech Ageing Dev 124: 897–902, 2003 [DOI] [PubMed] [Google Scholar]
- 13.Moe OW, Preisig PA. Dual role of citrate in mammalian urine. Curr Opin Nephrol Hypertens 15: 419–424, 2006 [DOI] [PubMed] [Google Scholar]
- 14.Nicar MJ, Skurla C, Sakhaee K, Pak CYC. Low urinary citrate excretion in nephrolithiasis. Urology 21: 8–14, 1983 [DOI] [PubMed] [Google Scholar]
- 15.Okamoto N, Aruga S, Matsuzaki S, Takahashi S, Matsushita K, Kitamura T. Associations between renal sodium-citrate cotransporter (hNaDC-1) gene polymorphism and urinary citrate excretion in recurrent renal calcium stone formers and normal controls. Int J Urol 14: 344–349, 2007 [DOI] [PubMed] [Google Scholar]
- 16.Oshiro N, King SC, Pajor AM. Transmembrane helices 3 and 4 are involved in substrate recognition by the Na+/dicarboxylate cotransporter, NaDC1. Biochemistry 45: 2302–2310, 2006 [DOI] [PubMed] [Google Scholar]
- 17.Pajor AM. Conformationally-sensitive residues in transmembrane domain 9 of the Na+/dicarboxylate cotransporter. J Biol Chem 276: 29961–29968, 2001 [DOI] [PubMed] [Google Scholar]
- 18.Pajor AM. Molecular properties of the SLC13 family of dicarboxylate and sulfate transporters. Pflügers Arch 451: 597–605, 2006 [DOI] [PMC free article] [PubMed] [Google Scholar]
- 19.Pajor AM, Hirayama BA, Loo DDF. Sodium and lithium interactions with the Na+/dicarboxylate cotransporter. J Biol Chem 273: 18923–18929, 1998 [DOI] [PubMed] [Google Scholar]
- 20.Pajor AM, Randolph KM. Conformationally sensitive residues in extracellular loop 5 of the Na+/dicarboxylate co-transporter. J Biol Chem 280: 18728–18735, 2005 [DOI] [PMC free article] [PubMed] [Google Scholar]
- 21.Pajor AM, Randolph KM, Kerner SA, Smith CD. Inhibitor binding in the human renal low- and high-affinity Na+/glucose cotransporters. J Pharmacol Exp Ther 324: 985–991, 2008 [DOI] [PubMed] [Google Scholar]
- 22.Pajor AM, Sun N. Characterization of the rabbit renal Na+/dicarboxylate cotransporter using anti-fusion protein antibodies. Am J Physiol Cell Physiol 271: C1808–C1816, 1996 [DOI] [PubMed] [Google Scholar]
- 23.Pajor AM, Sun N. Functional differences between rabbit and human Na+-dicarboxylate cotransporters, NaDC-1 and hNaDC-1. Am J Physiol Renal Fluid Electrolyte Physiol 271: F1093–F1099, 1996 [DOI] [PubMed] [Google Scholar]
- 24.Pajor AM, Sun N, Valmonte HG. Mutational analysis of histidines in the Na+/dicarboxylate cotransporter, NaDC-1264. Biochem J 331: 257–264, 1998 [DOI] [PMC free article] [PubMed] [Google Scholar]
- 25.Pak CYC, Fuller C. Idiopathic hypocitraturic calcium-oxalate nephrolithiasis successfully treated with potassium citrate. Ann Int Med 104: 33–37, 1986 [DOI] [PubMed] [Google Scholar]
- 26.Robben JH, Fenton RA, Vargas SL, Schweer H, Peti-Peterdi J, Deen PM, Milligan G. Localization of the succinate receptor in the distal nephron and its signaling in polarized MDCK cells. Kidney Int 76: 1258–1267, 2009 [DOI] [PubMed] [Google Scholar]
- 27.Sansom MS, Weinstein H. Hinges, swivels and switches: the role of prolines in signalling via transmembrane alpha-helices. Trends Pharmacol Sci 21: 445–451, 2000 [DOI] [PubMed] [Google Scholar]
- 28.Smigielski EM, Sirotkin K, Ward M, Sherry ST. dbSNP: a database of single nucleotide polymorphisms. Nucleic Acids Res 28: 352–355, 2000 [DOI] [PMC free article] [PubMed] [Google Scholar]
- 29.Toivonen JM, Walker GA, Martinez-Diaz P, Bjedov I, Driege Y, Jacobs HT, Gems D, Partridge L. No influence of Indy on lifespan in Drosophila after correction for genetic and cytoplasmic background effects. PLoS Genet 3: e95, 2007 [DOI] [PMC free article] [PubMed] [Google Scholar]
- 30.Vargas SL, Toma I, Kang JJ, Meer EJ, Peti-Peterdi J. Activation of the succinate receptor GPR91 in macula densa cells causes renin release. J Am Soc Nephrol 20: 1002–1011, 2009 [DOI] [PMC free article] [PubMed] [Google Scholar]
- 31.Wang PY, Neretti N, Whitaker R, Hosier S, Chang C, Lu D, Rogina B, Helfand SL. Long-lived Indy and calorie restriction interact to extend life span. Proc Natl Acad Sci USA 106: 9262–9267, 2009 [DOI] [PMC free article] [PubMed] [Google Scholar]
- 32.Weerachayaphorn J, Pajor AM. Threonine-509 is a determinant of apparent affinity for both substrate and cations in the human Na+/dicarboxylate cotransporter. Biochemistry 47: 1087–1093, 2008 [DOI] [PMC free article] [PubMed] [Google Scholar]


