Abstract
Changes in apical surface expression of ion channels and transporters in the superficial rat renal cortex were assessed using biotinylation and immunoblotting during alterations in dietary K intake. A high-K diet increased, and a low-K diet decreased, both the overall and surface abundance of the β- and γ-subunits of the epithelial Na channel (ENaC). In the case of γ-ENaC, the effect was specific for the 65-kDa cleaved form of the protein. The overall amount of α-ENAC was also increased with increasing K intake. The total expression of the secretory K+ channels (ROMK) increased with a high-K diet and decreased with a low-K diet. The surface expression of ROMK increased with high K intake but was not significantly altered by a low-K diet. In contrast, the amounts of total and surface protein representing the thiazide-sensitive NaCl cotransporter (NCC) decreased with increasing K intake. We conclude that modulation of K+ secretion in response to changes in dietary K intake involves changes in apical K+ permeability through regulation of K+ channels and in driving force subsequent to alterations in both Na delivery to the distal nephron and Na+ uptake across the apical membrane of the K+ secretory cells.
Keywords: K loading, K depletion, ENaC, ROMK, NCC
the kidney maintains K homeostasis in response to changes in dietary intake by modulating the rate of K+ secretion in distal nephron segments (15). This adaptation involves, in part, the regulation of the activity of apical membrane K+ channels in these segments. This activity was shown to increase with high K intake and to decrease with low K intake using both cell-attached and whole-cell recordings from the cortical collecting duct (CCD) and connecting tubule (CNT) (11, 21, 26, 28). Other membrane transport proteins also affect K+ secretion. In particular, activation of apical Na+ channels (ENaC) expressed in the same principal cells as the K+ channels will lead to Na+ influx and apical membrane depolarization, increasing the driving force for K+ secretion. Indeed, ENaC activity increases with dietary K loading (9, 21). Finally, the delivery of Na+ to the K+-secreting segments may also affect Na+ entry and K+ efflux through this electrical coupling mechanism. Thus downregulation of Na+ transport proteins in upstream segments is expected to shift Na+ reabsorption to more distal parts of the nephron, increasing K+ secretion (13, 23, 24).
Alterations in the surface expression of these membrane transport proteins may contribute to these physiological responses to changes in dietary K intake. For secretory K+ channels (ROMK), internalization of channel protein secondary to activation of tyrosine kinases has been proposed to account for responses to K depletion (27), and immunocytochemical data were consistent with this idea (2, 14). More quantitative approaches have been applied to heterologous expression systems (14) but not to the kidney itself. The overall expression of ENaC protein subunits increases with a high-K diet (5), but how much of the additional protein gets to the surface has not been determined.
We have developed a technique for biotinylating the rat kidney in situ for the purposes of assessing the surface expression of membrane transport proteins under various chronic conditions (8, 10). Here, we use this approach to determine the patterns of expression during both increases and decreases in dietary K intake.
METHODS
Rats.
All procedures using animals were approved by the Institutional Animal Care and Use Committee of Weill-Cornell Medical College. Sprague-Dawley rats (250–300 g) of either gender (Charles River Laboratories, Kingston, NY) raised free of viral infections were used for all experiments. Animals were fed for 6–8 days with one of three matched synthetic diets (Harlan-Teklad, Madison, WI) containing 0.1%, (low K), 1% (control K), or 10% (high K) KCl. The K contents were 0.52, 5.2, and 52 g/kg, and the Cl contents were 2.9, 7.1, and 49.4 g/kg, respectively. The Na content of all diets was 4 g/kg.
Expression of ROMK2 in oocytes.
pSport plasmids containing rat ROMK2 cDNA were linearized with NotI restriction enzyme (New England Biolabs); cRNAs were transcribed with T7 RNA polymerase using an mMESSAGE mMACHINE kit (Ambion). Oocytes were harvested from Xenopus laevis and injected with ∼0.5 ng cRNA. They were stored at 17°C for 48 h in modified Barth's solution to permit channel expression. Oocytes were broken with trituration in lysis buffer, and total membrane pellets were isolated by centrifugation at 17,000 rpm for 4 h.
Biotinylation procedure.
The biotinylation procedure has been described in detail previously (8, 10). Briefly, rats were anesthetized with inactin (100 mg/kg ip, Sigma, St. Louis, MO), the abdominal cavity was opened, and the entire animal was placed on an ice block. A steady stream of ice-cold PBS kept the abdomen at <7°C. The kidneys were perfused through the aorta by gravity at a rate of ∼10 ml/min with ice-cold solution. Perfusions were done for 10–15 min with PBS, for 20–25 min with biotinylation solution (PBS with 4.5 mM KCl, pH 8.0 and 0.5 mg/ml sulfosuccinimidyl-2-[biotinamido]ethyl-1,3-dithiopropionate; sulfo-NHS-biotin; Pierce, Rockford, IL) and finally for 30 min with biotin-quenching solution (PBS in which 25 mM Tris·HCl, pH 8.0 replaced 25 mM NaCl).
The kidneys were excised and sliced into segments of ∼1-mm thickness of superficial cortex using a razor blade. These pieces were homogenized with a tight-fitting Dounce in ice-cold lysis buffer containing 250 mM sucrose, 10 mM triethanolamine (pH 7.4) and protease inhibitors leupeptin (1 μg/ml) and PMSF (0.1 mg/ml). The homogenate was centrifuged for 10 min at 1,000 g, and the supernatant was centrifuged at 18,000 g for 6 h to sediment a total membrane fraction. Aliquots of this fraction containing 3 mg protein were solubilized in 0.5 ml buffer containing 150 mM NaCl, 5 mM EDTA, 50 mM Tris·HCl (pH 7.4) and 3% Triton X-100. This was added to 0.8 ml of a 50% suspension of neutravidin beads (Pierce) at a ratio of 3.8 mg protein/ml bead suspension and kept for 3 h or more at 4°C with gentle rocking. The beads were washed three times with wash buffer [150 mM NaCl, 5 mM EDTA, 50 mM Tris·HCl (pH 7.4), and 1% Triton X-100], twice with high-salt wash buffer [500 mM NaCl, 5 mM EDTA, 50 mM Tris-HCl (pH 7.4), and 0.1% Triton X-100], and twice with no-salt wash buffer [10 mM Tris·HCl (pH 7.4)]. The supernatant was decanted and protein bound to the beads was eluted in 60 μl 4× Laemmli sample buffer plus 25 μl of 0.5 M DTT for 15 min at 90°C. Then, 10–25 μl of the eluate were loaded onto 4–12% bis-Tris gels for separation by SDS-PAGE.
In some experiments, to examine the overall abundance of ROMK protein, the kidneys were not perfused. Outer cortical pieces were quickly frozen in liquid nitrogen as described previously (7). Frozen pieces were homogenized in cold solution containing (in mM) 125 NaCl, 1 EDTA-Na2, 1 EGTA, 20 HEPES (pH 7.6), and 10% glycerol, 1% Triton X-100, 0.5% SDS, and protease inhibitors (see above). This extract was used directly for Western blot analysis.
ROMK was analyzed for N-glycosylation using PNGase F (New England BioLabs). For neutravidin eluates, protein was prepared from 3 mg superficial cortex membrane protein. The elution was carried out with 5 μl 10× glycoprotein denaturing buffer (5% SDS, 10% β-mercaptoethanol), 10 μl 0.5 M DTT, and 35 μl 10 mM Tris (pH 7.4) for 30 min at 50°C. An aliquot of the eluate corresponding to 750 μg membrane protein was treated with PNGaseF at a final concentration of 50 U/μl for 60 min at 37°C following the manufacturer's instructions. Another aliquot was treated identically but without enzyme. Subsequently, these samples were prepared for electrophoresis. Equal volumes of each sample corresponding to 550 mg initial protein were loaded onto each gel lane. For samples of solubilized superficial cortex, 50 μg protein was incubated with or without PNGaseF (75 U/μl) for 90 min. Samples were prepared for PAGE as described above.
Antibodies.
Polyclonal antibodies against the α-, β-, and γ-subunits of the rat ENaC were described previously (5, 16). Polyclonal antibodies against ROMK were generated in two rabbits against a C-terminal peptide CKRGYDNPNFVLSEVDETDD (3, 18). Antisera were purified from one rabbit (R80) using peptide-linked agarose bead affinity columns (Sulfolink Kit, Pierce Biotechnology). Other antibodies raised against the thiazide-sensitive NaCl cotransporter (NCC) and apical Na-K-2Cl cotransporter (NKCC2) were purchased from Chemicon International (Millipore, Billerica, MA).
Protein in the membrane fractions and homogenates was measured (BCA Kit, Pierce Biotechnology, Rockford, IL). Equal amounts of protein (40–50 μg/sample) were solubilized at 70°C for 10 min in Laemmli sample buffer and were resolved on 4–12% bis-Tris gels (Invitrogen, Carlsbad, CA) by SDS-PAGE. For immunoblotting, the proteins were transferred electrophoretically from unstained gels to polyvinylidene difluoride (PVDF) membranes. After blocking with BSA, membranes were incubated overnight at 4°C with primary antibodies at 1:500 or 1:1,000 dilutions for α-, β-, or γ-ENaC subunits and 1:2,000 for NKCC2 and NCC. Bound antibodies were detected using anti-rabbit IgG conjugated with alkaline phosphatase and detected with a chemiluminescence substrate (Western Breeze, Invitrogen) on autoradiography film (Denville Scientific, Metuchen, NJ). Films were scanned with Image Zone software (Hewlett-Packard, Palo Alto, CA), and band densities were quantitated using Photoshop (Adobe Systems, San Jose, CA).
Statistical analysis.
To compare expression of proteins, we compared background-subtracted optical densities of individual bands on the same film and used Student's t-test. The criterion of P < 0.05 was used to assess statistical significance. For presentation, the means ± SE for ratios of the band densities, normalized to values for control K conditions, were plotted.
RESULTS
Isolation of outer cortex.
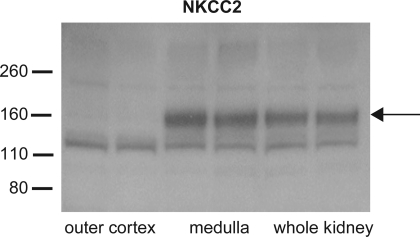
We assessed the surface expression of various membrane transport proteins that could have an impact on renal K+ excretion, including the apical K+ channel ROMK. However, this channel is expressed in two parts of the nephron, the thick ascending limb of Henle's loop (TALH) and the CNT/CCD, that have very different functions with respect to epithelial K+ transport. In Henle's loop, the K+ channels recycle K+ brought into the cell by the triple cotransporter NKCC2 , whereas in the CNT/CCD they serve as a pathway for net K+ secretion into the urine (25). We designed our procedures to focus on changes in the latter segments. After excision of the kidneys from the animals, we isolated the outer part of the cortex to maximize the contributions from CNT and initial CCD segments and minimize that from the TALH. In preliminary experiments shown in Fig. 1, we found that this fraction of the kidney was nearly devoid of protein for NKCC2, a marker of the TALH. Both the whole kidney and the medulla had abundant expression of the cotransporter. We concluded that this dissection procedure was adequate to isolate the K+-secreting parts of the nephron from those that mainly recycle K+.
Fig. 1.
Immunoblot of apical Na-K-2Cl cotransporter (NKCC2) from homogenates of kidney tissue from 2 rats. Samples were taken from whole kidney, whole medulla, or slices of outer cortex as described in the text. Each lane was loaded with 50 μg protein. The monomeric form of the protein has an apparent molecular mass of 160 kDa and is present only in the whole kidney and medulla. The lower band at ∼115 kDa is presumed to represent nonspecific staining.
Surface expression of ENaC.
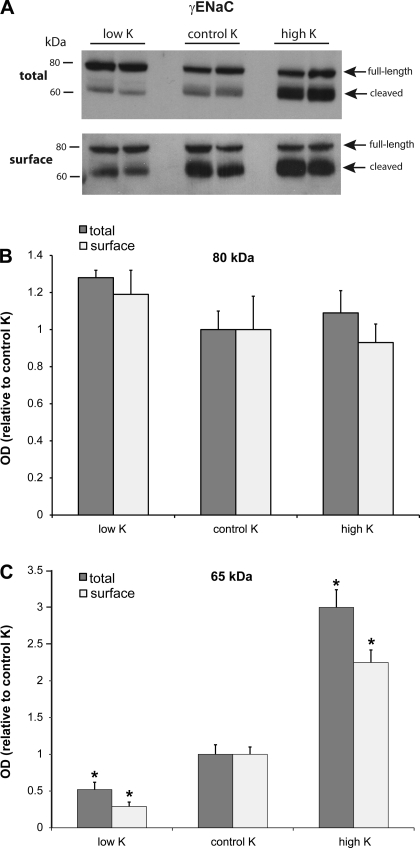
We previously found that both a low-Na diet and aldosterone administration increased the surface expression of β- and γ-ENaC in rat kidney (8, 10). We therefore examined whether a high-K diet had similar effects. Figure 2 shows a representative immunoblot for total and surface expression of γ-ENaC in the outer cortex. There were progressive increases in both the total and surface fractions of this subunit as K in the diet was increased from low to control to high K. As we found previously (8, 10), the surface fraction had a higher percentage of the low-molecular-mass (∼65 kDa) form of the protein that reflects proteolytic cleavage of the subunit. The preponderance of the 65-kDa form at the surface could indicate proteolysis that occurs either during trafficking to the plasma membrane or while the channels are resident at the surface. Thus, consistent with previous results, the surface abundance of the 65-kDa form of γ-ENaC correlates well with the measured activity of the channels (10).
Fig. 2.
Effect of dietary K on expression of γ-subunit of epithelial Na channel (γ-ENaC). A: representative immunoblots of outer cortex tissue obtained from rats on low-K, control K, and high-K diets. For total membranes, each lane was loaded with 60 μg protein from a different animal. Surface fractions represent neutravidin eluates corresponding to 500 μg protein added initially to the beads. B: quantitation of densities of the 80-kDa bands. OD, optical density. C: quantitation of densities of 65-kDa bands; n = 4. *Significant difference compared with control K diet, P < 0.05.
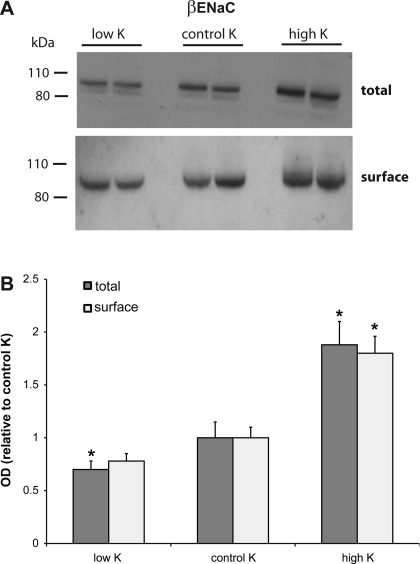
The expression of β-ENaC was also increased by dietary K (Fig. 3), both in the total and in the surface fractions. In this case, the effect of a high-K diet, relative to controls, was more pronounced than that of the low-K diet; the differences between low-K and control K diets were not statistically significant. The increase in the total membrane fraction was similar to that found previously (5).
Fig. 3.
Effect of dietary K on expression of β-ENaC. A: representative immunoblots of outer cortex tissue obtained from rats on low-K, control K, and high-K diets. For total membranes, each lane was loaded with 60 μg protein from a different animal. Surface fractions represent neutravidin eluates corresponding to 500 μg protein added initially to the beads. B: quantitation of densities; n = 4. *Significant difference compared with control K diet, P < 0.05.
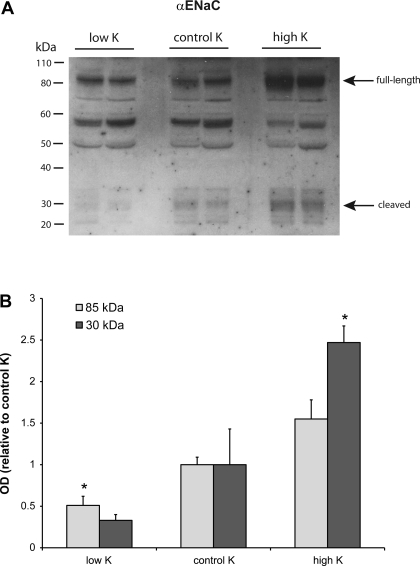
As discussed previously (8), it was not possible to assess the surface expression of α-ENaC using this approach. We did, however, measure the total membrane pool of this subunit in the same samples, as shown in Fig. 4. Both the full-length (85 kDa) and the putative cleaved (30 kDa) forms of the protein were increased by high and decreased by low dietary K. Changes in this subunit with a high-K diet were larger than those reported previously (5).
Fig. 4.
Effect of dietary K on expression of α-ENaC. A: representative immunoblot of outer cortex tissue obtained from rats on low-K, control K, and high-K diets. For total membranes, each lane was loaded with 60 μg protein from a different animal. B: quantitation of densities of the 85- and 30-kDa bands. Bands at 55 and 50 kDa were assumed to represent nonspecific staining; n = 4. *Significant difference compared with control K diet, P < 0.05.
Detection of ROMK protein.
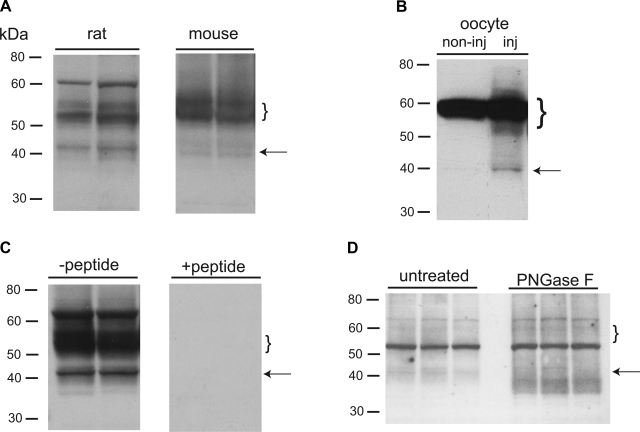
Antibodies were raised against peptides corresponding to the same C-terminal epitope of ROMK used previously (5, 16). For optimal results with Western blots of total membrane fractions, we used rapid freezing of kidney tissue followed by simultaneous solubilization and homogenization in SDS-containing medium. Results for both rat and mouse kidney are shown in Fig. 5. In both species, the antiserum detects a well-defined band at ∼40 kDa and a much more diffuse band at ∼50–55 kDa. These could correspond to core-glycosylated and fully glycosylated forms of the protein as suggested previously (4, 6, 30). The lower molecular mass band is more prominent in the rat than in the mouse, where it appears as a doublet. Similar results were obtained with X. laevis oocytes expressing ROMK2 (Fig. 5B). Discrete bands at ∼40 kDa and diffuse staining at 50–65 kDa were seen in ROMK-expressing oocytes but not in uninjected controls. However, a strong discrete band at 60 kDa was seen in both and presumably indicates interaction of the antibody with a protein other than ROMK. A similar staining of a prominent band at ∼60 kDa in rat kidney was also considered to be nonspecific since it was not seen in every preparation and does not appear in the surface membrane fractions (see below). All staining in the rat tissue was ablated in the presence of an excess of the immunizing peptide (Fig. 5C). The glycosidase PNGaseF reduced the apparent size of the presumed core-glycosylated band to ∼38 kDa and also increased the intensity of staining, consistent with deglycoslyation of fully glycosylated material as well (Fig. 5D). However, a corresponding decrease in the high-molecular-mass staining could not be documented.
Fig. 5.
Detection of secretory K+ channels (ROMK) protein. A: rat and mouse kidney. Samples were homogenized and solubilized in SDS-Triton X-100 buffer as described in methods. Each lane was loaded with 50 μg protein from a different animal. B: Xenopus laevis oocytes. Oocytes were injected with cRNA encoding ROMK2. Equivalent extracts of noninjected oocytes from the same batch were used as controls. C: peptide competition. Samples of whole rat kidney were homogenized and solubilized in SDS-Triton X-100 buffer; 75 μg protein from each of 2 different animals were loaded twice on the same gel. The gel was cut and incubated with antibody either with (right) or without (left) a 50-fold molar excess of the immunizing peptide. Even under conditions of deliberate overexposure, no nonspecific staining was detected in the presence of the peptide. D: effects of glycosidase. Samples of superficial cortex from 3 rats on a high-K diet were homogenized and solubilized in SDS-Triton X-100 buffer. Samples were then incubated in the presence or absence of PNGaseF as described in methods. Each lane was loaded with 50 μg protein. Arrows and brackets indicate core and fully glycosylated forms, respectively.
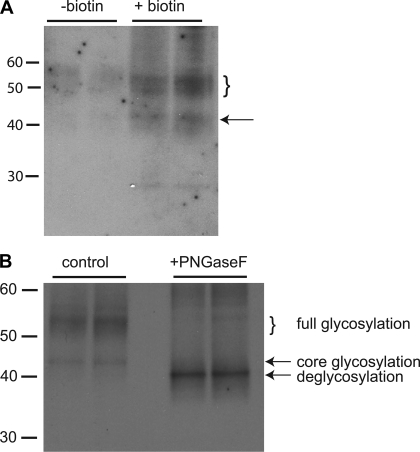
Figure 6 shows the detection of ROMK in the biotinylated fraction of the cell extract. In this case, the kidneys were processed in the same way as those shown in Figs. 1–4. Again, both core-glycosylated and fully glycosylated forms were detected, but the presumed nonspecific band at 50 kDa is absent. Figure 6A shows that both of these forms were eluted from the neutravidin beads only when the kidneys were treated with the biotinylating reagent. Figure 6B shows results of treatment of the eluate with the glycosidase PNGase F. Both forms of the protein convert to one with an apparent mass slightly less than 40 kDa, consistent with the enzyme's cleaving, all added sugar residues.
Fig. 6.
Detection of ROMK surface membrane protein in biotinylated rat kidneys. A: each lane was loaded with neutravidin eluates obtained from 500 μg total membrane protein. In the 2 lanes on the right, the kidneys were perfused with biotinylating reagent. In the 2 lanes on the left, the kidneys were perfused without the biotinylating reagent. B: blot similar to that in A of neutravidin eluates from kidneys perfused with biotinylating reagent. The right lanes were loaded with samples treated with PNGase F as described in methods. The left lanes were loaded with control samples treated identically but without PNGaseF.
Effect of dietary K on ROMK expression.
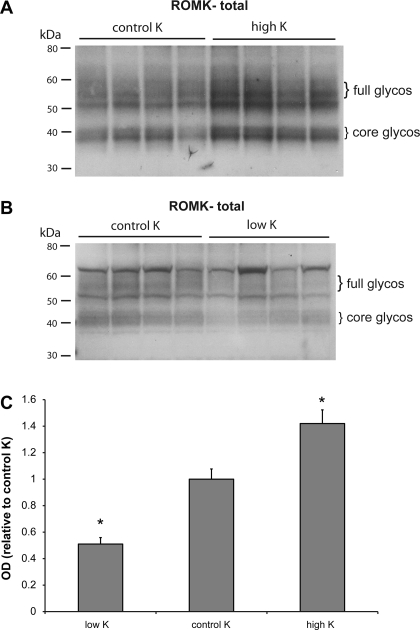
Changes in the amount of ROMK protein in the total membrane and surface fractions of the kidney cortex were measured in separate experiments, since different methods of preparation of the tissue were required. Figure 7 illustrates the effects of a high-K and low-K diet on the total expression of the channel protein. Although the changes were not large, the high-K animals had increased ROMK abundance while the K-depleted group had decreased abundance. Changes in the 40- and the 50/60-kDa forms were similar, although the latter was more difficult to measure due to the presence of the presumed nonspecific band. Quantification of the 40-kDa bands is shown in Fig. 7C.
Fig. 7.
Effect of dietary K on expression of ROMK. A: immunoblots of outer cortex tissue obtained from rats on control K and high-K diets. Each lane was loaded with 70 μg protein from a different animal. B: immunoblots of outer cortex tissue obtained from rats on control K and low-K diets. Each lane was loaded with 70 μg protein from a different animal. C: quantitation of densities of the 40-kDa bands. *Significant difference compared with control K diet, P < 0.05.
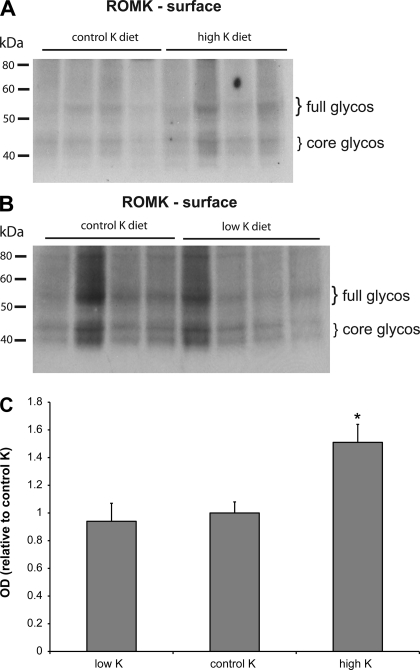
The effect of diet on the surface expression of ROMK is shown in Fig. 8. Here the K-loaded animals had increased protein abundance at the surface. The increase relative to controls was similar to that for the total membrane fraction (Fig. 7). In the K-depleted animals, the surface expression of the K channels was not significantly different from controls.
Fig. 8.
Effect of dietary K on surface expression of ROMK. A: immunoblots of outer cortex tissue obtained from rats on control K and high-K diets. Each lane was loaded with neutravidin eluate from 600 μg protein from a different animal. B: immunoblots of outer cortex tissue obtained from rats on control K and low-K diets. Each lane was loaded with neutravidin eluate from 590 μg protein from a different animal C: quantitation of densities, expressed as the sum of the 40- and 50- to 55-kDa bands, from 2 sets of eluates. *Significant difference compared with control K diet, P < 0.05.
Expression of NCC.
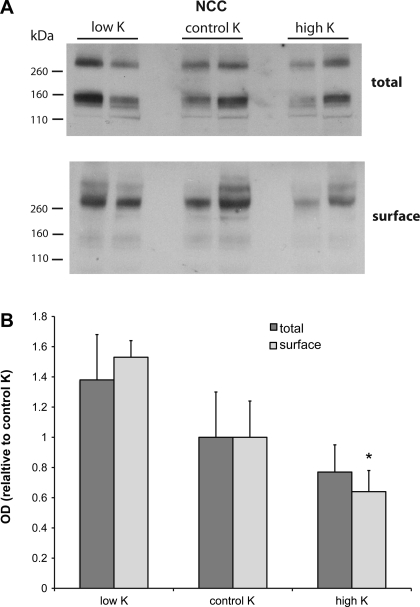
A number of recent results have suggested a role for modulation of NCC in the regulation of electrolyte balance (13, 24, 29). We therefore investigated the effects of dietary K intake on the total and surface expression of NCC in the rat superficial cortex. Representative blots are shown in Fig. 9A. As was previously reported, the total membrane fraction had two forms of the cotransporter protein, presumably corresponding to monomers and dimers, while the dimeric form predominated in the surface fraction. Both total and surface NCC tended to be inversely related to K intake. The changes were modest and, in the case of the total membrane pool, not statistically significant. The difference in surface expression between the high-K and low-K groups was highly significant.
Fig. 9.
Effect of dietary K on expression of NaCl cotransporter (NCC). A: representative immunoblots of outer cortex tissue obtained from rats on low-K, control K, and high-K diets. For total membranes, each lane was loaded with 50 μg protein from a different animal. Surface fractions represent neutravidin eluates of samples containing 560 μg protein. B: quantitation of densities. For total membranes, densities are expressed as the weighted sum of the 160- and 320-kDa bands. For surface fractions, densities were measured only for the 320-kDa bands. *Significant difference compared with a low-K diet, P < 0.05.
DISCUSSION
Regulation of Na+ channels.
In previous studies, the biochemical event that correlated best with measurements of Na+ channel activity was the abundance of the 65-kDa form of γ-ENaC at the cell surface (10). In response to 1 wk of a high-K diet, the surface expression of this protein increased twofold (Fig. 2). This is somewhat less than that observed with Na depletion for the same time period (8), a finding in agreement with the smaller overall channel activity under the two conditions (9, 20, 21). There was a similar twofold increase in the amount of the β-ENaC subunit at the cell surface (Fig. 3). This is comparable to the effects of a low-Na diet (8). Somewhat smaller decreases in the surface expression of these two subunits were observed with K restriction. As in previous studies, we could not assay the surface expression of α-ENaC using this approach, since the full-length form of the subunit was not detected and the cleaved form bound nonspecifically to the neutravidin beads. The increase in the overall abundance of α-ENaC was also around twofold.
These changes are unlikely to fully account for the regulation of Na+ channels. Under our control conditions, the activity of the channels is virtually undetectable using electrophysiological techniques (9, 20). Other laboratories have reported small but significant activities in the CNT and/or CCD under similar conditions (19, 22). However, the amount of channel protein, at least the β- and γ-subunits, at the surface is easily measurable. This implies that mechanisms controlling the activity of the channels in the plasma membrane also contribute to the responses to alterations in K intake.
Regulation of K+ channels.
One surprising finding with respect to the regulation of ROMK channels was the change in the total amount of protein with dietary K. In particular, in a previous study we found no change in protein with K loading (17). However, in that case we did not separate parts of the kidney containing TALH segments from those containing the secretory apparatus, i.e., the CNT and CCD. It seems likely that ROMK protein is regulated differently in the TALH, a segment whose main functions involve Na reabsorption, dilution of the urine, and the establishment of interstitial osmolarity. Since in whole kidney the majority of the ROMK will probably come from the TALH, it is perhaps not surprising that the increased expression in the CNT/CCD was missed.
We previously found no detectable change in mRNA expression in the CCD in response to K loading of similar extent and duration (12). Thus the changes in protein levels observed in this study most likely involve an increased efficiency of protein synthesis from a fixed pool of mRNA, or an inhibition of protein degradation rates.
In a recent study using whole-cell currents to assess overall ROMK activity in the CCD and CNT, we found that a high-K diet increased K+ currents by about threefold, while a low-K diet decreased them by about twofold. Similar effects had previously been found in the case of the high-K diet using single-channel analysis (11, 21, 26, 28). As with the ENaC measurements, the increase in ROMK surface expression with a high-K diet was less than that of channel activity. Furthermore, the decrease in surface expression with K restriction was not statistically significant.
We were surprised not to see a larger decrease in surface expression of ROMK with K depletion. This condition is associated with an increase in c-src levels (1, 28), and tyrosine phosphorylation can promote internalization of the channel, at least in heterologous expression systems (14). Furthermore, immunocytochemical studies indicated a decreased surface expression of ROMK in the distal nephron in response to K depletion (2, 14). We do not know the reason for the apparent discrepancy of the biotinylation results with these earlier studies. It is possible that contributions to the ROMK signal from cTALH segments constitutively expressing the channel reduce the measured differences, although the lack of NKCC2 in our samples suggests that the number of these segments is minimal. In any case, we think it is likely that inactivation of channels in the apical membrane contributes to the suppression of K+ secretion under these conditions.
Regulation of NCC.
NCC has been increasingly recognized as an important site of regulation of salt homeostasis (13, 23). We previously found an increase in the surface expression of NCC with Na depletion that was not mimicked by exogenous aldosterone administration (11). In the case of changes in dietary K, the amount of NCC at the surface decreased with high-K intake and increased with low-K intake. These changes are in the opposite direction from those of ENaC, the Na transporter immediately downstream from NCC. A similar modest change in the overall expression of NCC was observed in mice fed high-K and low-K diets (24). In that study, a larger change in the phosphorylation of NCC protein, presumably associated with an increased activity, was also observed.
In principle, these effects could represent responses to changes in Cl intake, since this anion was added to the diets along with K. In a previous study, we found no changes in NCC surface expression in response to increased NaCl intake (10). We therefore conclude that changes in K intake are the major mediators for regulation of NCC, although we cannot rule out a role for Cl.
Regulation of K+ secretion.
All three of the transport proteins studies here will contribute to the control of renal K+ secretion by the CNT/CCD, and ultimately of renal K+ excretion. ROMK channels in the apical membranes of K+-secreting segments directly participate in the secretory process. Insertion/activation of Na+ channels in the same segments will serve to depolarize the apical membrane, increasing the driving force for K+ secretion. This effect will be amplified by the downregulation of NCC, thus inhibiting Na transport in DCT immediately upstream of the CNT/CCD. This will increase delivery of Na+ to the K+-secreting segments, enhancing Na+ entry and, through electrical coupling, K+ efflux across the apical membrane. The net effect will be to shift the reabsorption of Na+ from a segment that reabsorbs Cl− in parallel with the Na+ to segments that can exchange K+ for Na+, allowing more K+ to be secreted without a net increase in Na+ reabsorption.
GRANTS
This work was supported by National Institutes of Health Grants DK27847 and DK59659. Expenses for antibody development were funded in part by Grant DK54231 to Paul Welling.
DISCLOSURES
No conflicts of interest, financial or otherwise, are declared by the authors.
ACKNOWLEDGMENTS
We thank Drs. James Wade and Paul Welling for help with raising the anti-ROMK antibodies.
REFERENCES
- 1.Chen P, Guzman JP, Leong PK, Yang LE, Perianayagam A, Babilonia E, Ho JS, Youn JH, Wang WH, McDonough AA. Modest dietary K+ restriction provokes insulin resistance of cellular K+ uptake and phosphorylation of renal outer medulla K+ channel without fall in plasma K+ concentration. Am J Physiol Cell Physiol 290: C1355–C1363, 2006 [DOI] [PubMed] [Google Scholar]
- 2.Chu PY, Quigley R, Babich V, Huang CL. Dietary potassium restriction stimulates endocytosis of ROMK channel in rat cortical collecting duct. Am J Physiol Renal Physiol 285: F1179–F1187, 2003 [DOI] [PubMed] [Google Scholar]
- 3.Ecelbarger CA, Kim GH, Knepper MA, FM, Kachar B. Regulation of potassium channel Kir1.1 (ROMK) abundance in the thick ascending limb of Henle's loop. J Am Soc Nephrol 12: 10–18, 2001 [DOI] [PubMed] [Google Scholar]
- 4.Ecelbarger CA, Terris J, Hoyer JR, Nielsen S, Wade JB, Knepper MA. Localization and regulation of the rat renal Na-K-2Cl cotransporter, BSC-1. Am J Physiol Renal Fluid Electrolyte Physiol 271: F619–F628, 1996 [DOI] [PubMed] [Google Scholar]
- 5.Ergonul Z, Frindt G, Palmer LG. Regulation of maturation and processing of ENaC subunits in the rat kidney. Am J Physiol Renal Physiol 291: F683–F693, 2006 [DOI] [PubMed] [Google Scholar]
- 6.Fallen K, Banerjee S, Sheehan J, Addison D, Lewis LM, Meiler J, Denton JS. The Kir channel immunoglobulin domain is essential for Kir1.1 (ROMK) thermodynamic stability, trafficking and gating. Channels (Austin) 3: 57–68, 2009 [DOI] [PMC free article] [PubMed] [Google Scholar]
- 7.Fang L, Garuti R, Kim BY, Wade JB, Welling PA. The ARH adaptor protein regulates endocytosis of the ROMK potassium secretory channel in mouse kidney. J Clin Invest 119: 3278–3289, 2009 [DOI] [PMC free article] [PubMed] [Google Scholar]
- 8.Frindt G, Ergonul Z, Palmer LG. Surface expression of epithelial Na channel protein in rat kidney. J Gen Physiol 131: 617–627, 2008 [DOI] [PMC free article] [PubMed] [Google Scholar]
- 9.Frindt G, Palmer LG. Na channels in the rat connecting tubule. Am J Physiol Renal Physiol 286: F669–F674, 2004 [DOI] [PubMed] [Google Scholar]
- 10.Frindt G, Palmer LG. Surface expression of sodium channels and transporters in rat kidney: effects of dietary sodium. Am J Physiol Renal Physiol 297: F1249–F1255, 2009 [DOI] [PMC free article] [PubMed] [Google Scholar]
- 11.Frindt G, Shah A, Edvinsson JM, Palmer LG. Dietary K regulates ROMK channels in connecting tubule and cortical collecting duct of rat kidney. Am J Physiol Renal Physiol 296: F347–F354, 2009 [DOI] [PMC free article] [PubMed] [Google Scholar]
- 12.Frindt G, Zhou H, Sackin H, Palmer LG. Dissociation of K channel density and ROMK mRNA in rat cortical collecting tubule during K adaptation. Am J Physiol Renal Physiol 274: F525–F531, 1998 [DOI] [PubMed] [Google Scholar]
- 13.Kahle KT, Wilson FH, Leng Q, Lalioti MD, O'Connell AD, Dong K, Rapson AK, MacGregor GG, Giebisch G, Hebert SC, Lifton RP. WNK4 regulates the balance between renal NaCl reabsorption and K+ secretion. Nat Genet 35: 372–376, 2003 [DOI] [PubMed] [Google Scholar]
- 14.Lin DH, Sterling H, Yang B, Hebert SC, Giebisch G, Wang WH. Protein tyrosine kinase is expressed and regulates ROMK1 location in the cortical collecting duct. Am J Physiol Renal Physiol 286: F881–F892, 2004 [DOI] [PMC free article] [PubMed] [Google Scholar]
- 15.Malnic G, Muto S, Giebisch G. Regulation of potassium excretion. In: The Kidney Physiology and Pathophysiology, edited by Alpern RJ, Hebert SC. Burlington, MA: Academic, 2008 [Google Scholar]
- 16.Masilamani S, Kim GH, Mitchell C, Wade JB, Knepper MA. Aldosterone-mediated regulation of ENaC alpha, beta, and gamma subunit proteins in rat kidney. J Clin Invest 104: R19–R23, 1999 [DOI] [PMC free article] [PubMed] [Google Scholar]
- 17.Mennitt PA, Frindt G, Silver RB, Palmer LG. Potassium restriction downregulates ROMK expression in rat kidney. Am J Physiol Renal Physiol 278: F916–F924, 2000 [DOI] [PubMed] [Google Scholar]
- 18.Mennitt PA, Wade JB, Ecelbarger CA, Palmer LG, Frindt G. Localization of ROMK channels in the rat kidney. J Am Soc Nephrol 8: 1823–1830, 1997 [DOI] [PubMed] [Google Scholar]
- 19.Nesterov V, Dahlmann A, Bertog M, Korbmacher C. Trypsin can activate the epithelial sodium channel (ENaC) in microdissected mouse distal nephron. Am J Physiol Renal Physiol 295: F1052–F1062, 2008 [DOI] [PubMed] [Google Scholar]
- 20.Pácha J, Frindt G, Antonian L, Silver R, Palmer LG. Regulation of Na channels of the rat cortical collecting tubule by aldosterone. J Gen Physiol 102: 25–42, 1993 [DOI] [PMC free article] [PubMed] [Google Scholar]
- 21.Palmer LG, Antonian L, Frindt G. Regulation of apical K and Na channels and Na/K pumps in rat cortical collecting tubule by dietary K. J Gen Physiol 104: 693–710, 1994 [DOI] [PMC free article] [PubMed] [Google Scholar]
- 22.Pochynyuk O, Rieg T, Bugaj V, Schroth J, Fridman A, Boss GR, Insel PA, Stockand JD, Vallon V. Dietary Na+ inhibits the open probability of the epithelial sodium channel in the kidney by enhancing apical P2Y2-receptor tone. FASEB J 24: 2056–2065, 2010 [DOI] [PMC free article] [PubMed] [Google Scholar]
- 23.Subramanya AR, Yang CL, McCormick JA, Ellison DH. WNK kinases regulate sodium chloride and potassium transport by the aldosterone-sensitive distal nephron. Kidney Int 70: 630–634, 2006 [DOI] [PubMed] [Google Scholar]
- 24.Vallon V, Schroth J, Lang F, Kuhl D, Uchida S. Expression and phosphorylation of the Na+-Cl− cotransporter NCC in vivo is regulated by dietary salt, potassium, and SGK1. Am J Physiol Renal Physiol 297: F704–F712, 2009 [DOI] [PMC free article] [PubMed] [Google Scholar]
- 25.Wang W, Sackin H, Giebisch G. Renal potassium channels and their regulation. Annu Rev Physiol 54: 81–96, 1992 [DOI] [PubMed] [Google Scholar]
- 26.Wang W, Schwab A, Giebisch G. Regulation of small conductance K+ channel in apical membrane of rat cortical collecting tubule. Am J Physiol Renal Fluid Electrolyte Physiol 259: F494–F502, 1990 [DOI] [PubMed] [Google Scholar]
- 27.Wang WH, Giebisch G. Regulation of potassium (K) handling in the renal collecting duct. Pflügers Arch 458: 157–168, 2009 [DOI] [PMC free article] [PubMed] [Google Scholar]
- 28.Wei Y, Bloom P, Lin D, Gu R, Wang WH. Effect of dietary K intake on apical small-conductance K channel in CCD: role of protein tyrosine kinase. Am J Physiol Renal Physiol 281: F206–F212, 2001 [DOI] [PubMed] [Google Scholar]
- 29.Yang CL, Angell J, Mitchell R, Ellison DH. WNK kinases regulate thiazide-sensitive Na-Cl cotransport. J Clin Invest 111: 1039–1045, 2003 [DOI] [PMC free article] [PubMed] [Google Scholar]
- 30.Yoo D, Fang L, Mason A, Kim BY, Welling PA. A phosphorylation-dependent export structure in ROMK (KIR 1.1) channel overides an ER- localization signal. J Biol Chem 280: 35281–35289, 2005 [DOI] [PubMed] [Google Scholar]


