Abstract
Angiotensinogen (AGT) expression in renal proximal tubular cells (RPTCs) and intrarenal tumor necrosis factor-α (TNF-α) levels are increased in hypertension and renal diseases However, the contribution of TNF-α to AGT expression in RPTCs has not been established. Therefore, the objective of the present study was to determine influence of TNF-α on AGT expression in RPTCs. Human kidney-2 (HK-2) cells, immortalized human RPTCs, were treated with several concentrations of TNF-α up to 24 h. AGT mRNA and protein expression were evaluated by RT-PCR and ELISA, respectively. Activation of nuclear factor-κB (NF-κB) by TNF-α was evaluated by Western blot analysis, immunocytochemistry, and electrophoretic mobility shift assay (EMSA). TNF-α suppressed AGT mRNA expression in a dose- and time-dependent manner. Maximum AGT mRNA reduction was caused by 40 ng/ml of TNF-α (0.52 ± 0.09, ratio to control, at 24 h) and at 24 h (0.66 ± 0.05, ratio to control, by 10 ng/ml TNF-α). TNF-α reduced AGT protein accumulation in the medium between 8 and 24 h (0.62 ± 0.13 by 40 ng/ml TNF-α, ratio to control). TNF-α activated and induced translocalization of p50 and p65, which are NF-κB subunits. Elevated formation of p50/p65 and p50/p50 dimers by TNF-α were observed by EMSA and supershift assay. Gene silencing of p50, but not p65, attenuated the effect of TNF-α on reduction of AGT expression in RPTCs. These results indicate that TNF-α suppresses AGT expression through p50/p50 homodimer formation in human RPTCs, suggesting a possible counteracting mechanism that limits excessive intrarenal AGT production.
Keywords: nuclear factor-κB, human kidney-2
the renin-angiotensin system (RAS) plays important roles in controlling blood pressure and in the regulation of electrolyte and body fluid homeostasis. Because intrarenal angiotensin II (ANG II) is elevated in many forms of hypertension, it is acknowledged as a key target for clinical and biochemical studies (24).
Some of the intrarenal ANG II is derived from intrarenal angiotensinogen (AGT), which is produced mainly in renal proximal tubular cells (RPTCs) (10, 36). Therefore, regulation of AGT expression in the RPTCs may play an important role in regulating intrarenal ANG II levels. AGT expression in RPTCs are augmented in several hypertensive animal models (8, 13, 14, 33).
In hypertensive animal models, tumor necrosis factor-α (TNF-α) is elevated in the vasculature (28), the heart (20), the liver (39), and the kidney (29). Additionally, TNF-α is well known as a strong activator of nuclear factor-κB (NF-κB) (2, 34). Activated IκB kinase complex (IKK) induces phosphorylation of IκB inhibitors leading to degradation of the IκB inhibitors (17). Phosphorylation of p105, a precursor of p50, by IKK is also essential for activation of NF-κB (16). Phosphorylation of p105 leads to production of p50, an NF-κB component. Phosphorylation of p65 plays an important role in NF-κB activation (30). Activated p50 and p65 form heterodimers or p50/p50 homodimers that are translocalized to the nucleus and induce gene transcription (9, 11, 37). NF-κB plays biphasic roles in gene transcription, namely, NF-κB works as an activator of gene transcription by the p50/p65 heterodimer and also as a repressor of gene transcription by the p50/p50 homodimer (37). These mechanisms underlying regulation of NF-κB signaling play important roles in the development of renal diseases (27).
TNF-α contributes to an augmentation of AGT in several tissues (25). In contrast, TNF-α reduces AGT expression in the heart (6) and adipocytes (38). Therefore, the effects of TNF-α on AGT expression may be tissue and cell specific. In the kidney, infusion of TNF-α increases urine volume and urinary sodium excretion (35). Moreover, the infusion of TNF-α suppresses blood pressure (35). We recently demonstrated that treatment with TNF-α decreases AGT mRNA expression in primary cultured human RPTCs, although the details of the action of TNF-α were not elucidated in the paper (32). These results suggest a possibility that TNF-α may be able to suppress the RAS activity (35). However, details of the effects of TNF-α on AGT expression, and particularly, its mechanism of action in RPTCs have not been delineated.
In the present study, we hypothesized that TNF-α reduces AGT levels in RPTCs. Therefore, this study was performed to elucidate the contribution of TNF-α to AGT expression and its mechanisms in human RPTCs.
MATERIALS AND METHODS
Antibodies.
Mouse anti-TNF-α type 1 receptor (TNFR1) antibody, rabbit anti-TNF-α type 2 receptor (TNFR2) antibody, and rabbit anti-p52 antibody were purchased from Santa Cruz Biotechnology. Rabbit anti-phospho-IKK α/β kinase (IKK) α/β antibody (Ser 176/180), rabbit anti-IKK α antibody, rabbit anti-IKK β antibody, rabbit anti-p105/p50 antibody, rabbit anti-p65 antibody, mouse anti-phospho-p105 antibody (Ser 933), mouse anti-phospho-p65 antibody (Ser 536), rabbit anti-phospho-IκBα antibody (Ser 32), and rabbit anti-IκBα antibody were obtained from Cell Signaling Technology. Another rabbit anti-p65 antibody was purchased from Santa Cruz for a supershift assay. Mouse anti-AGT antibody was purchased from IBL. Mouse anti-β-actin antibody was purchased from Abcam. Mouse anti-lamin A/C antibody was purchased from Active Motif. IRDye-labeled anti-mouse IgG antibody and anti-rabbit IgG antibody were obtained from Li-Cor as secondary antibodies for Western blot analysis.
Cell culture.
Human kidney-2 (HK-2) cells, an immortalized human RPTC line, were obtained from ATCC. The cells were cultured as previously described (31) and were plated at a density of 2×10⁵ cells/well in six-well plates. Before stimulation, the cells were exposed to serum-free medium for 24 h. RPTCs were subsequently treated with 0–40 ng/ml human recombinant soluble TNF-α (Pierce, IL) up to 24 h in a medium containing 1% serum.
Quantitative real-time RT-PCR.
Quantitative real-time RT-PCR (qRT-PCR) was performed to evaluate human AGT mRNA expression using the TaqMan PCR system. For total RNA isolation, treated cells were washed with 3 ml of PBS. PBS was aspirated and total RNA was isolated from the cells using the BIO-ROBOT EZ 1 (Qiagen, CA). Subsequently, qRT-PCR was performed as previously described (15, 31). All samples were analyzed in triplicate, and the data were normalized based on the expression level of human GAPDH mRNA.
Human AGT ELISA.
To quantify human AGT protein in the culture medium, human AGT ELISA was performed as previously described (12, 31). HK-2 cells were cultured in six-well plates with 1.5 ml/well of medium. An initial sample of 100 μl of each medium was collected at 8 h, and the remaining medium was collected at 24 h. In the 24-h medium samples, total volume of medium was measured; thereafter, AGT protein level was normalized based on the medium volume. Because levels of AGT protein accumulated in the medium were not changed by TNF-α treatment up to 8 h, AGT protein levels were calculated from 8 to 24 h to evaluate changes in AGT protein expression solely from TNF-α treatment. Total protein concentration in medium was quantified using Micro BCA Protein Assay Kit (Pierce) to examine nonspecific degradation of proteins by TNF-α treatment.
Western blot analysis.
To determine basal expression levels of TNFR1 and TNFR2 in HK-2 cells, Western blot analysis was performed using 20 μg of unstimulated whole cell lysates as previously described (31). Basal expression levels of these two receptors in HK-2 cells were compared with those in MCF-7 (a breast cancer whole cell lysate, Santa Cruz Biotechnology), which is recommended by the company as a positive control for the antibodies. To determine the expression levels of intracellular AGT protein, cells were treated with 0–40 ng/ml TNF-α for 24 h. Twenty micrograms of cell lysates were used for this Western blot analysis. The expression levels of AGT were normalized based on β-actin levels. To evaluate NF-κB activation by TNF-α, cells were treated with 20 ng/ml TNF-α up to 90 min. Phosphorylation levels of IKKα/β, IκBα, p105, and p65, and degradation of p105 and IκBα were determined using 20 μg of cell lysates. Phosphorylation levels of IKKα/β were normalized based on combination of total IKK α and total IKK β levels. In activation of NF-κB, IκB protein is phosphorylated and cleaved. Therefore, the phosphorylation levels of IκBα were normalized based on β-actin levels because of instability of total IκBα levels. p105 is the protein precursor of p50, one of the subunits of NF-κB along with p65 (7). Upon activation of the NF-κB pathway, p105 is phosphorylated and cleaved to produce p50. The phosphorylation levels of p105 were normalized based on β-actin levels because of instability of total p105 levels. The phosphorylation levels of p65 were normalized based on total p65 expression levels. Subsequently, translocalization of p50, p52, and p65 by TNF-α treatment were evaluated by Western blot analysis using nuclear extracts from cells. The nuclear protein samples were prepared by a NE-PER kit (Pierce) after TNF-α treatment. Levels of nuclear p50, p52, and p65 were normalized based on lamin A/C level.
Immunofluorescence staining.
HK-2 cells were cultured in four-well chambers (Lab-Tek). After treatment with 20 ng/ml TNF-α for 30 min, the cells were rinsed with PBS and then fixed for 20 min by 4% paraformaldehyde. After 4 min incubation with 0.2% Triton X-100, the blocking agent Image-iT FX signal enhancer (Invitrogen) was added to the chambers. The cells were incubated with antibodies against p50, p52, and p65 for 30 min. After being washed with PBS, the cells were incubated with an Alexa Fluor 488-labeled secondary antibody. ProLong Gold anti-fade reagent with DAPI (Invitrogen) was used as a nuclear stain and a mount reagent. Localization of NF-κB subunits in HK-2 cells were observed and photographed under a fluorescence microscope (Olympus BX51, Olympus Optical).
Electrophoretic mobility shift assay.
Binding activities of the complexes of NF-κB subunits to DNA were tested using electrophoretic mobility shift assay (EMSA), and a supershift assay was carried out to identify shifted bands in EMSA. After 5–90 min TNF-α treatment, nuclear protein extraction was performed using a NE-PER kit (Pierce). The protein concentrations were determined using a Micro BCA Protein Assay Kit (Pierce). TNF-α-treated nuclear extracts were incubated with p52, p50, and p65 antibodies for 20 min before EMSA. EMSA was performed as previously described (31).
RNA interference.
Contributions of the p50/p65 heterodimer and p50/p50 homodimer to changes in AGT expression by TNF-α treatment were examined using RNA interference. An inhibitor against NF-κB activation suppressed basal AGT expression in HK-2 cells suggesting that NF-κB plays a role in the basal AGT expression of HK-2 cells (31). Therefore, we partially suppressed p105/p50 or p65 expression by administrating small interfering RNAs (siRNAs) to observe the effect of TNF-α on AGT expression under conditions of RNA interference. HK-2 cells were plated into six-well plates with siPORT NeoFX (Ambion, TX) containing human Negative Control-siRNA (Ambion, NS group), p105/p50-siRNA (Ambion, sense sequence; 5′-CCACCUUCAUUCUCAACUUTT-3′), or p65-siRNA (Ambion, sense sequence; 5′-CCCUUUACGUCAUCCCUGATT-3′). The final concentrations of the three siRNAs were 20 nmol/l each. To test how transfection reagents affected NF-κB expression, another negative control group was also prepared without any siRNA transfection (NC group). OPTI-MEM I medium (Invitrogen) was used for these transfections. After 48 h transfection of siRNA, cells were harvested to determine suppression of p105, p50, and p65 protein expression using Western blot analysis, and a second group of cells were harvested later after 24 h TNF-α (10 ng/ml) treatment with 1% FBS medium to evaluate the contributions of p50 and p65 to changes in AGT expression by TNF-α treatment using qRT-PCR and Western blot analysis.
Statistical analysis.
Data are expressed as means ± SD. The data were analyzed using Student's t-test or one-way ANOVA followed by Bonferroni/Dunn multiple comparison post hoc test. A value of P < 0.05 was considered statistically significant.
RESULTS
Basal expression levels of TNFR1 and TNFR2 in HK-2 cells.
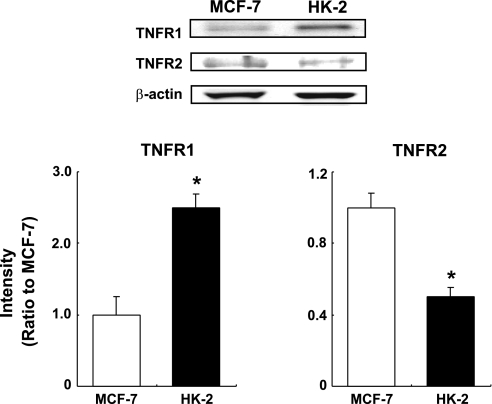
Both TNF-α receptors were detected in Western blot analysis using 20 μg of unstimulated whole cell lysates (Fig. 1). Because it is difficult to compare expression levels of two different proteins that are each detected by different antibodies in Western blot analysis, the expression levels of TNFR1 and TNFR2 in HK-2 cells were evaluated by comparison with those expression levels in MCF-7 lysate, respectively (MCF-7 lysate is a breast cancer whole cell lysate recommended by the company as a positive control for TNFR1 and TNFR2 antibodies). The comparison of expression levels of TNFR1 in MCF-7 and HK-2 cells showed that the basal expression level of TNFR1 in HK-2 was higher than that in MCF-7 (2.49 ± 0.20, ratio to MCF-7, n = 3). Conversely, basal TNFR2 expression in HK-2 was lower than that in MCF-7 (0.50 ± 0.05, ratio to MCF-7, n = 3). The intensity of the detected TNFR2 band in the Western blot analysis was low even in the positive control MCF-7 although it was a detectable level.
Fig. 1.
Basal expression levels of tumor necrosis factor (TNF)-α type 1 receptor (TNFR1) and TNF-α type2 receptor (TNFR2) in human kidney-2 (HK-2) cells. Basal expression levels of TNFR1 and TNFR2 in HK-2 cells were compared with those in MCF-7 by Western blot analysis (n = 3). Expression levels of the receptors were normalized based on β-actin levels. Open columns, expression levels of the receptors in MCF-7; filled columns, expression levels of TNFR1 and TNFR2 in HK-2 cells. Data are means ± SD. *Significant difference compared with MCF-7 (P < 0.05).
Effect of TNF-α on AGT mRNA and protein expression in HK-2 cells.
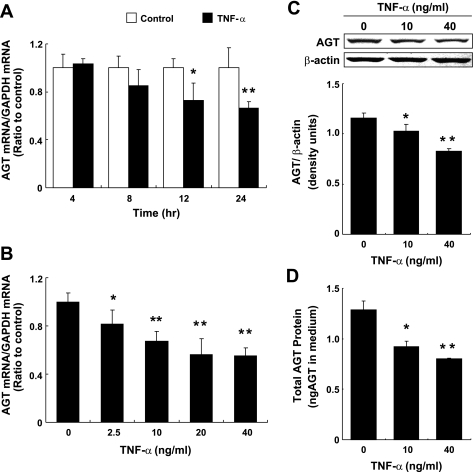
Treatment with 10 ng/ml TNF-α suppressed AGT mRNA expression at 12 and 24 h (Fig. 2A, 0.66 ± 0.05, ratio to control at 24 h, n = 4). Changes in AGT mRNA expression were not observed in control groups at any experimental time point (Fig. 2A). The suppressive effect of TNF-α on AGT mRNA expression was observed to occur in a dose-dependent manner (Fig. 2B, n = 4). The maximum reduction of AGT mRNA expression was induced by 40 ng/ml of TNF-α treatment (0.52 ± 0.09 ratio to control, at 24 h). The effect of TNF-α on AGT protein levels in cell lysate and culture medium were tested using Western blot analysis and human AGT ELISA, respectively. Ten and 40 ng/ml TNF-α suppressed intracellular AGT protein levels (Fig. 2C, 0.71 ± 0.03 by 40 ng/ml TNF-α, ratio to control, n = 4). Treatment with 10 ng/ml TNF-α had no effect on the accumulation of AGT protein in culture medium up to 8 h (data not shown). During 8 to 24 h, the accumulation of AGT protein was reduced by both 10 and 40 ng/ml TNF-α treatment (Fig. 2D, 0.62 ± 0.13 by 40 ng/ml TNF-α, ratio to control, n = 4). Total protein concentration in medium was measured to confirm that the suppression of AGT protein levels was not due to nonspecific degradation triggered by TNF-α treatment. There was no significant difference between control groups and TNF-α-treated groups in total protein concentration (0.56 ± 0.02 mg/ml in control group vs. 0.54 ± 0.02 mg/ml in 40 ng/ml TNF-α-treated group, n = 4).
Fig. 2.
Effect of TNF-α on angiotensinogen (AGT) mRNA expression in HK-2 cells. HK-2 cells were treated with 10 ng/ml TNF-α up to 24 h (A, n = 4). HK-2 cells also were treated with 0–40 ng/ml TNF-α for 24 h (B, n = 4). After these treatments, AGT mRNA was measured by quantitative real-time RT-PCR. Expression levels of AGT mRNA were normalized based on GAPDH levels. Data are expressed as relative values compared with the control group at each time point (A) or 0 ng/ml TNF-α (B) and represent the means ± SD. Open columns, control groups; filled columns, 10 ng/ml TNF-α-treated group in A. *P < 0.05 and **P < 0.01, significant difference compared with the control. To determine the expression levels of intracellular AGT protein, cells were treated with 0–40 ng/ml TNF-α for 24 h. Intracellular AGT protein levels were determined by Western blot analysis (C, n = 3). The expression levels of AGT were normalized based on β-actin levels. HK-2 cells were treated with 0–40 ng/ml TNF-α for 24 h (n = 4). Moreover, AGT protein levels in media were measured by human AGT ELISA. The media were collected at 8 and 24 h. AGT protein levels were calculated by the difference between 8 and 24 h levels of AGT protein and then evaluated for changes in AGT by TNF-α treatment (D, n = 4). Expression levels of AGT protein were normalized based on total volume of the medium. Data are means ± SD. *P < 0.05 and **P < 0.01, significant difference compared with the control.
Activation of NF-κB by TNF-α treatment in HK-2 cells.
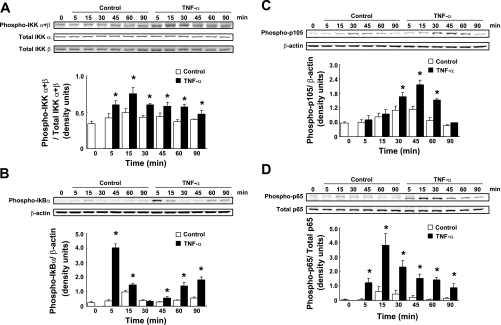
Phosphorylation levels of IKKα/β (Ser 176/180), IκBα (Ser 32), p105 (Ser 933), and p65 (Ser 536) were determined after 20 ng/ml TNF-α treatment by Western blot analysis. Phosphorylation levels of IKKα/β were induced by TNF-α treatment compared with control groups from 5 to 90 min (Fig. 3A, n = 4). Maximum phosphorylation of IKKα/β was observed at 15 min (1.52 ± 0.15, ratio to control at 15 min). The TNF-α treatment also induced phosphorylation levels of IκBα from 5 min (Fig. 3B, n = 4). Maximum phosphorylation of IκBα was observed at 5 min (10.87 ± 0.66, ratio to control at 5 min). Increased phosphorylation levels of p105 were induced by TNF-α treatment compared with control groups from 30 to 60 min (Fig. 3C, n = 4). TNF-α treatment induced maximum phosphorylation of p105 at 45 min (1.91 ± 0.16, ratio to control at 45 min, 3.80 ± 0.31, ratio to 0 min). Phosphorylation levels of p65 were increased by TNF-α-treated groups compared with control groups from 5 to 90 min (Fig. 3D, n = 4). TNF-α treatment induced maximum phosphorylation of p65 at 15 min (6.76 ± 1.30, ratio to control at 15 min, 26.5 ± 5.10, ratio to 0 min). In both experiments, small differences in phosphorylation levels were detected among control groups compared with 0 min (Fig. 3, A and B).
Fig. 3.
Phosphorylation of IKB kinase (IKK)α/β, IκBα, p105, and p65 by TNF-α treatment. HK-2 cells were treated with 20 ng/ml TNF-α for 0–90 min. After treatment, IKKα/β phosphorylation levels (A, n = 4), IκBα phosphorylation levels (B, n = 4), p105 phosphorylation levels (C, n = 4), and p65 phosphorylation levels (D, n = 4) were evaluated by Western blot analysis. Phosphorylation levels of IKKα/β and p65 were normalized based on combination of total IKK α with total IKK β levels and total p65, respectively. Phosphorylation levels of IκBα and p105 were normalized based on β-actin levels because of instability of total IκBα and total p105 levels. Open columns, control groups; filled columns, TNF-α-treated groups. Data are means ± SD. *Significant difference compared with each time point control (P < 0.05).
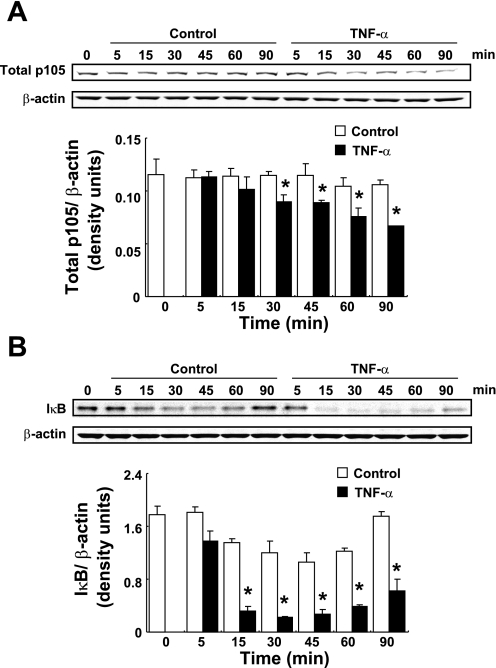
As other indicators of the activation of NF-κB, degradation of p105 and IκBα by TNF-α treatment were examined using Western blot analysis. Treatment with 20 ng/ml TNF-α slowly induced the degradation of p105 from 30 to 90 min (Fig. 4A, 0.63 ± 0.08, ratio to control group at 90 min, n = 4). TNF-α treatment increased IκBα degradation from 15 to 90 min (Fig. 4B), and the maximum degradation of IκBα was observed at 30 min (0.19 ± 0.01, ratio to control at 30 min, 0.13 ± 0.004, ratio to 0 min). Although a reduction of IκBα was observed among control groups, IκBα protein levels recovered at 90 min in control groups compared with 0 min level. In contrast, TNF-α-treated groups showed a greater IκBα degradation and IκBα protein levels remained significantly low compared with control groups at 90 min.
Fig. 4.
Degradation of p105 and IκB by TNF-α treatment. HK-2 cells were treated with 20 ng/ml TNF-α for 0–90 min. After treatment, degradation of p105 (A, n = 4) and IκBα (B, n = 4) were evaluated by Western blot analysis. Degradation levels of p105 and p65 were normalized based on β-actin expression levels. Open columns, control groups; filled columns, TNF-α-treated groups. Data are means ± SD. *Significant difference compared with each time point control (P < 0.05).
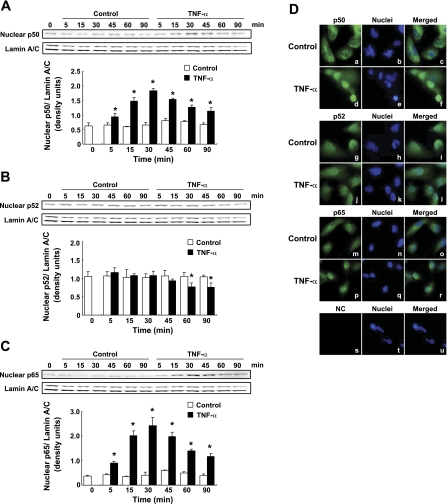
Translocalization of NF-κB subunits were examined by Western blot analysis using isolated nuclear protein. TNF-α treatment induced translocalization of p50 into nucleus from 5 to 90 min (Fig. 5A, n = 3). In the control groups, slight augmentation of nuclear p50 protein levels were observed at 45 min compared with 0 min. Nuclear p52 protein was found to be present at constant levels in the control groups from 0 to 90 min (Fig. 5B, n = 3). TNF-α treatment did not increase nuclear p52 levels but rather reduced nuclear p52 levels at 60 and 90 min (Fig. 5B, n = 3). TNF-α treatment induced translocalization of p65 into the nucleus from 5 to 90 min (Fig. 5C). There was a slight increase in nuclear p65 observed at 45 min compared with 0 min among control groups.
Fig. 5.
Translocalization of nuclear factor (NF)-κB subunits by TNF-α treatment. Translocalization of NF-κB subunits were examined by Western blot analysis using isolated nuclear protein after treatment with 20 ng/ml TNF-α from 0 to 90 min. Nuclear p50 (A, n = 3), p52 (B, n = 3), and p65 (C, n = 3) levels were normalized based on expression level of lamin A/C. Open columns, control groups; filled columns, TNF-α-treated groups. Data are means ± SD. *Significant difference compared with each time point control (P < 0.05). These translocalization of NF-κB subunits were examined using immunofluorescence staining. HK-2 cells were treated with 20 ng/ml TNF-α for 30 min. NF-κB subunits were stained by p50 antibody (a and d), p52 antibody (g and j), and p65 antibody (m and p). Nuclei were stained by DAPI (center panels). Pictures on the right side indicate the merged results. The negative control (NC, s-u) was stained without any primary antibody.
The translocalization of these NF-κB subunits induced by TNF-α treatment was further examined using immunofluorescence staining. In control groups, p50 was localized in the cytoplasm (Fig. 5D, a–c). TNF-α treatment (20 ng/ml for 30 min) induced translocalization of p50 into the nucleus (Fig. 5D, d–f). The p52 staining was detected in both the cytoplasm and the nucleus of control groups (Fig. 5D, g–i). In TNF-α-treated groups, there was no change in the localization of p52 (Fig. 5D, j–l) and this finding was confirmed by Western blot analysis. TNF-α treatment induced translocalization of p65 into the nucleus (Fig. 5D, m–r). Additionally, nonspecific staining was not detected in absence of the primary antibody (Fig. 5D, s–u).
DNA binding activities of NF-κB subunits complexes induced by TNF-α treatment.
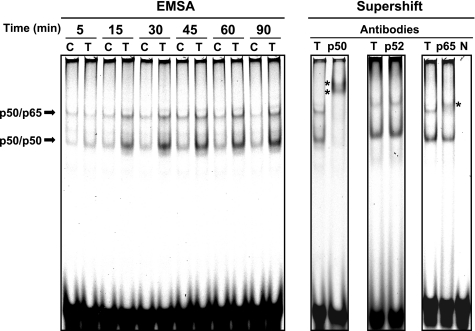
Increased DNA binding activities of complexes of NF-κB subunits stimulated by TNF-α treatment were examined using EMSA. Two major bands were detected by EMSA in both control and TNF-α-treated group from 5 to 90 min (Fig. 6). TNF-α treatment facilitated formation of these DNA-protein complexes. To identify these bands in EMSA, a supershift assay was performed. Application of an anti-p50 antibody changed the migrations of the two bands induced by TNF-α treatment (Fig. 6). An anti-p52 antibody did not alter these migrations. Use of an anti-p65 antibody changed the migrations of only the upper band. Therefore, the upper band in EMSA was identified as a p50/p65 complex bound to DNA, whereas the lower band was a complex composed of p50/p50 homodimer bound to DNA. The intensity of the lower p50/p50-DNA complex induced by TNF-α treatment was stronger than that of upper p50/p65-DNA complex. The negative control (N), which lacked any nuclear protein, did not show any shifted band.
Fig. 6.
DNA binding activities of NF-κB subunits complexes induced by TNF-α treatment. HK-2 cells were treated with 20 ng/ml TNF-α for 0–90 min. After treatment, the binding activities of NF-κB subunits to DNA were determined using EMSA. Bands were identified by supershift assay using anti-p50, anti-p52, and anti-p65 antibodies. *Supershift bands by antibodies. C, control group; T, TNF-α-treated group; N, negative control (without any protein).
Contributions of p50/p65 heterodimer and p50/p50 homodimer to the suppression of AGT expression by TNF-α.
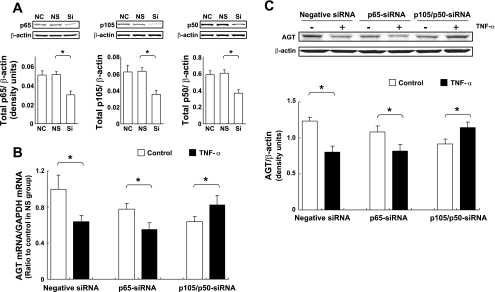
Since there was an increase in the formation of p50/p65 and p50/p50 complexes, and augmentation of their DNA binding activities by TNF-α treatment was shown in EMSA, contributions of p50/p65 heterodimer and p50/p50 homodimer to the suppression of AGT expression by TNF-α were tested using weak RNA interference against p65 and p105/p50. The effects of the siRNAs on p65 and p105/p50 expressions were determined by Western blot analysis. Treatment with p65-siRNA suppressed p65 expression [Fig. 7A, 0.59 ± 0.08, ratio to human negative control siRNA-treated (NS) group, n = 3]. Treatment with p105/p50-siRNA reduced expression levels of p105 (Fig. 7A, 0.56 ± 0.08, ratio to NS group, n = 3) and p50 (0.61 ± 0.07, ratio to NS group, n = 3). There was no difference between non-siRNA-treated (NC) groups and NS groups in p65, p105, and p50 basal expressions (Fig. 7A). Under these conditions of NF-κB suppression, the effect of TNF-α treatment on AGT mRNA and protein expression were tested.
Fig. 7.
Contributions of p50/p65 heterodimer and p50/p50 homodimer to suppression of AGT expression by TNF-α. HK-2 cells were treated with negative small interfering RNA (siRNA), p65-siRNA, and p105/p50-siRNA for 48 h. After treatment, expression levels of p65 (A, left, n = 3), p105 (A, center, n = 3), and p50 (A, right, n = 3) were determined using Western blot analysis. NC, negative control group (absent of any siRNA treatment); NS, negative siRNA-treated group; Si, siRNA-treated group (p65-siRNA or p105/p50-siRNA). Data are expressed as means ± SD. In A: *significant difference compared with the corresponding NS group (P < 0.05). Under the presence of siRNA treatments, the effect of TNF-α on AGT mRNA (B, n = 4) and protein (C, n = 3) expressions were tested. HK-2 cells were treated with 10 ng/ml TNF-α for 24 h following 48 h siRNA treatment. Data are expressed as relative values compared with the negative siRNA-treated control group and represent the means ± SD. Open columns, control groups; filled columns, TNF-α-treated groups. In B and C: *significant difference compared with the corresponding control group (P < 0.05).
Upon comparison of basal AGT expression among controls to the three siRNA-treated groups, the suppressions of p65 and p105/p50 decreased basal AGT mRNA expression compared with the NS control group (Fig. 7B, 0.78 ± 0.08 in the control of the p65 siRNA-treated groups, 0.64 ± 0.05 in the control of the p105/p50 siRNA-treated groups, ratio to the control of the NS group, n = 4). In the NS group, TNF-α treatment (10 ng/ml for 24 h) reduced AGT mRNA expression (Fig. 7B, two left columns, 0.64 ± 0.07, ratio to the NS control group). Under suppression of p65, TNF-α treatment decreased AGT expression (Fig. 7B, two center columns, 0.71 ± 0.10, ratio to the p65-siRNA control group). In contrast, TNF-α treatment slightly but significantly increased AGT expression under p105/p50 suppression (Fig. 7B, two right columns, 1.29 ± 0.16, ratio to the p105/p50-siRNA control group), although p50 expression was suppressed by siRNA similarly to that of p65 (Fig. 7A). Moreover, the changes in AGT protein levels corresponded with the changes in mRNA levels (Fig. 7C).
DISCUSSION
The present study demonstrates the effects of TNF-α on AGT expression in human RPTCs and the role of NF-κB in this phenomenon. To elucidate these effects, the human RPTC line HK-2 was used in this study. In this cell line, basal expression levels of TNFR1 and TNFR2 were determined by Western blot analysis and compared with expression levels of the corresponding receptors. It has been shown that MCF-7 cells express TNFR1 and that TNF-α treatment induces gene expression including vascular endothelial growth factor and interleukin 1β in these cells (26). These results indicate that the expression level of TNFR1 is enough to mediate TNF-α action via downstream signal transduction pathways in MCF-7. The expression level of TNFR1 in HK-2 was higher than that in MCF-7; conversely, the expression level of TNFR2 in HK-2 was lower than that in MCF-7 (Fig. 1). Soluble TNF-α, such as that used in this study, induces greater activation of TNFR1 rather than TNFR2, though TNFR2 plays many pathogenic roles with membrane TNF-α (19). In human kidneys, TNFR2 is detected only in glomeruli by immunohistochemistry (1). In the present study, Western blot analysis was performed using a highly sensitive system (coupled with an infrared-labeled antibody). Despite this sensitivity, the intensity of the detected TNFR2 band was very low in HK-2 cells. These results indicate that TNF-α may express activity through TNFR1 in HK-2 cells.
The present study demonstrates that TNF-α suppresses AGT expression in human RPTCs. The decrease in AGT expression by TNF-α treatment was observed in both mRNA (Fig. 2, A and B) and protein studies (Fig. 2, C and D). In contrast, TNF-α contributes to an augmentation of AGT levels in several tissues (25). However, cardiac-restricted overexpression of TNF-α reduced cardiac AGT expression (6). Furthermore, TNF-α suppressed AGT expression in human adipocytes (38). Thus the effects of TNF-α on AGT expression appear to be cell and/or tissue specific. As shown in this study using HK-2 cells, we recently demonstrated that TNF-α suppressed AGT expression in human primary cultured RPTCs, although details of this phenomenon had not been elucidated in the human primary cultured cells (32). Until now the effects of TNF-α have not been fully studied in RPTCs, although these cells are the major source of AGT in the kidney. Our results may help to delineate the roles of TNF-α in regulation of RAS in the kidney of several diseases including hypertension. In many tissues, including the kidney, TNF-α has been shown to act as a pathogenic factor such as a proinflammatory cytokine (3). Recently, antipathogenic roles of TNF-α have been also suggested. For example, development of renal interstitial fibrosis induced by unilateral ureteral obstruction was accelerated in TNF-α-deficient mice (22). In the kidney, ANG II infusion augments TNF-α levels in the glomeruli, renal arteries, and renal tubules (29). Long-term treatment with losartan, an ANG II type 1 receptor antagonist, mitigated the development of renal interstitial fibrosis induced by adriamycin infusion in spontaneously hypertensive rats indicating ANG II contributes to the development of renal interstitial fibrosis (21). These results suggest the possibility that an ANG II-TNF-α-AGT negative feedback system may help mitigate the development of renal injury by acting as a counteracting pathway in the kidney. However, further animal studies will be required to investigate the possibility of an anti-pathogenic ANG II-TNF-α-AGT negative feedback system and how this affects renal hemodynamics and the development of renal injury despite TNF-α itself being considered a pathogenic factor. We recently revealed that interleukin 6 (IL-6) contributes to the augmentation of AGT expression in RPTCs (31, 32). Change in AGT expression in RPTCs may depend on the balance of these positive and negative feedback systems by cytokines in some hypertensive and renal disease animal models.
In rat AGT, an acute-phase response element was identified in the promoter region, which includes the NF-κB and CCAAT/enhancer-binding protein (CEBP) binding sites (4, 5). This finding revealed a molecular mechanism underlying the augmentation of rodent AGT through activation of NF-κB. However, little information is available regarding the cis- and trans-acting elements that regulate AGT expression in human cells (4). Our previous study demonstrated that parthenolide, an inhibitor of NF-κB activation, suppressed basal AGT expression levels in HK-2 cells, suggesting that NF-κB contributes to basal AGT expression levels in these cells (31). Further studies such as ChIP assay and DNA-protein pull-down assay will help to demonstrate interactions between human AGT promoter and NF-κB.
TNF-α activates NF-κB, which produces many physiological changes (2). In this study, phosphorylation levels of IKKα/β and IκBα were increased by TNF-α treatment (Fig. 3, A and B). Additionally, the degradation of IκB by TNF-α treatment was also observed (Fig. 4B). The increase in phosphorylation of IKKα/β was induced by TNF-α treatment from 5 min, and maximum phosphorylation of IKKα/β was observed at 15 min. On the other hand, maximum phosphorylation of IκBα by TNF-α treatment was detected at 5 min, and prolonged treatment with TNF-α reduced the phosphorylation levels of IκBα. This reduction in phosphorylation levels of IκBα may be due to degradation of IκBα protein started from 15 min. Phosphorylation of p105 on Ser 933 by IKK is essential for TNF-α-induced activation of NF-κB (16). Ser 933 phosphorylation signals p105 for degradation and leads to production of p50. Phosphorylation of p65 on Ser 536 also plays an important role in NF-κB activation (30). In the present study, TNF-α induced the phosphorylation of p105 on Ser 933 (Fig. 3C), the phosphorylation of p65 on Ser 536 (Fig. 3D), and the degradation of p105 (Fig. 4A). A slight activation of NF-κB was observed in control groups. It has been reported that serum albumin activates NF-κB in RPTCs (18). Therefore, the minor activation of NF-κB in the control groups might have been caused by the replacement of medium containing 1% FBS, which was required to prevent the loss of RPTCs character caused by prolonged cell starvation. TNF-α treatment induced translocalization of p50 and p65 into the nucleus (Fig. 5, A and C) as evidenced by immunofluorescence staining (Fig. 5D). Although there was a larger increase of p65 in the nucleus in response to TNF-α (Fig. 5, A and C), specific methods such as ELISAs will be required to compare nuclear protein levels of p50 and p65. Nuclear p52 was detected from 0 to 90 min in the control groups (Fig. 5B). TNF-α treatment did not increase the level of nuclear p52 but rather showed slightly decreased levels at 60 and 90 min. The slight decrease in nuclear p52 may be attributed to TNF-α induced activation of nuclear ubiquitin ligases, such as E3 ubiquitin ligase, which targets nuclear NF-κB subunits for degradation thereby terminating NF-κB activity (23). In this study, phosphorylation and degradation of p105 by TNF-α treatment were delayed compared with the activation of p65 (Fig. 3). However, the phosphorylation levels of p105 were slightly increased by 5 min TNF-α treatment when it is compared with the phosphorylation levels at 0 min (1.33 ± 0.27, ratio to 0 min, P = 0.07). Moreover, the phosphorylation levels of p105 were significantly increased by 15 min TNF-α treatment when it is compared with the phosphorylation levels at 0 min (1.78 ± 0.18, ratio to 0 min). Therefore, phosphorylation of p105 was started from 5 min (at least 15 min) by TNF-α treatment, although the phosphorylation levels were not significantly different from the level in control group due to NF-κB was slightly activated even in the control group as described above.
EMSA and supershift assay showed that TNF-α increased NF-κB binding activity to DNA (Fig. 6). In EMSA, two major bands were detected in the 5-min control groups, indicating that the RPTCs possess a low NF-κB binding activity to DNA. These two bands were identified as a p50/p65 heterodimer and a p50/p50 homodimer by the supershift assay. Although the changes in migration of these bands by anti-p50 and anti-p65 antibodies were different in the supershift assay, this disparity might be attributed to the antibodies that were obtained from different companies. Therefore, the effect of TNF-α on AGT expression was tested under conditions of either p65 or p50 suppression by siRNAs. It is difficult to test the TNF-α induced suppression of AGT expression under complete suppression of NF-κB subunits because basal NF-κB activity contributes to basal AGT expression in HK-2 cells (31). Therefore, a RNA knockdown technique was used in this study to partially suppress p65 and p50. Under approximately 40% p65 and p50 suppression (Fig. 7A), basal AGT expression was reduced suggesting that basal NF-κB activity plays a role in basal AGT expression (Fig. 7B). TNF-α treatment decreased AGT expression in the p65-suppressed group as well as in the negative siRNA-treated group (Fig. 7, B and C). In contrast, TNF-α treatment augmented AGT expression in the p50-suppressed group (Fig. 7, B and C). It has been demonstrated that the p50/p50 homodimer induces transcriptional repression by competing with the p50/p65 heterodimer for NF-κB-DNA binding sites (9, 37). These results indicate that TNF-α augments not only formation of the p50/p65 complex but also formation of the p50/p50 complex leading to a reduction of AGT expression in RPTCs. There is a possibility that the p50 suppression could have changed the ratio of the p50/p65 heterodimer to the p50/p50 homodimer resulting in a small increase in AGT expression by TNF-α treatment. Moreover, these results suggest that NF-κB can mediate human AGT expression in RPTCs, although the binding motif in the promoter region has not been identified.
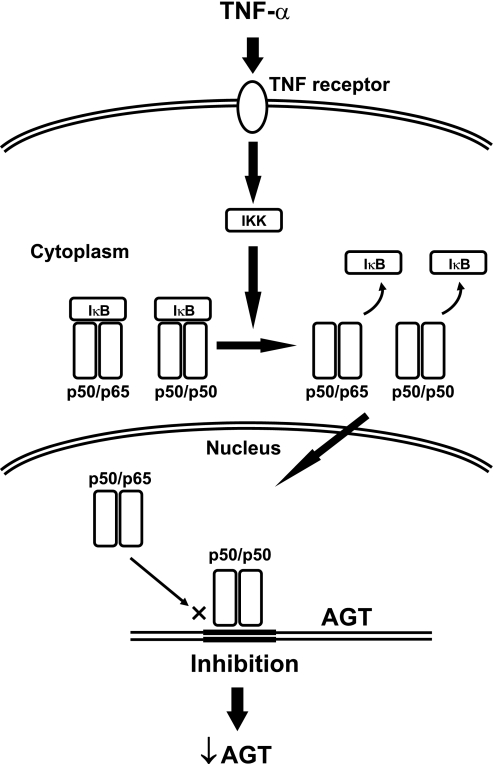
In summary, we have demonstrated that TNF-α suppresses AGT expression through formation of a p50/p50 homodimer in human RPTCs (Fig. 8), suggesting that TNF-α plays an integral role in the regulation of AGT expression in human RPTCs. Consequently, the implications of these results underlying the mechanism regulating intrarenal AGT expression may lead to new strategies to treat hypertension, cardiovascular, and renal diseases associated with the activated RAS.
Fig. 8.
Schematic summary of AGT suppression by TNF-α in human RPTCs. TNF-α facilitates formation of a p50/p65 heterodimer and a p50/p50 homodimer via a TNFR. After these dimers transfer to nuclei, the excess p50/p50 homodimer inhibits AGT mRNA transcription.
GRANTS
This study was supported by grants from the National Institute of Diabetes and Digestive and Kidney Diseases (R01DK-072408), National Center for Research Resources (P20RR-017659), and National Heart, Lung, and Blood Institute (R01HL-026371).
DISCLOSURES
No conflicts of interest, financial or otherwise, are declared by the author(s).
ACKNOWLEDGMENTS
The authors acknowledge the valuable comments and excellent technical assistance of Dr. Romer A. Gonzalez-Villalobos, Dr. Maki Urushihara, Omar W. Acres, G. Michael Upchurch, and Nina A. Perrault (Tulane University).
REFERENCES
- 1.Al-Lamki RS, Wang J, Vandenabeele P, Bradley JA, Thiru S, Luo D, Min W, Pober JS, Bradley JR. TNFR1- and TNFR2-mediated signaling pathways in human kidney are cell type-specific and differentially contribute to renal injury. FASEB J 19: 1637–1645, 2005 [DOI] [PubMed] [Google Scholar]
- 2.Bouwmeester T, Bauch A, Ruffner H, Angrand PO, Bergamini G, Croughton K, Cruciat C, Eberhard D, Gagneur J, Ghidelli S, Hopf C, Huhse B, Mangano R, Michon AM, Schirle M, Schlegl J, Schwab M, Stein MA, Bauer A, Casari G, Drewes G, Gavin AC, Jackson DB, Joberty G, Neubauer G, Rick J, Kuster B, Superti-Furga G. A physical and functional map of the human TNF-alpha/NF-kappa B signal transduction pathway. Nature Cell biol 6: 97–105, 2004 [DOI] [PubMed] [Google Scholar]
- 3.Bradley JR. TNF-mediated inflammatory disease. J Pathol 214: 149–160, 2008 [DOI] [PubMed] [Google Scholar]
- 4.Brasier AR, Han Y, Sherman CT. Transcriptional regulation of angiotensinogen gene expression. Vitam Horm 57: 217–247, 1999 [DOI] [PubMed] [Google Scholar]
- 5.Brasier AR, Ron D, Tate JE, Habener JF. A family of constitutive C/EBP-like DNA binding proteins attenuate the IL-1 alpha induced, NF kappa B mediated trans-activation of the angiotensinogen gene acute-phase response element. EMBO J 9: 3933–3944, 1990 [DOI] [PMC free article] [PubMed] [Google Scholar]
- 6.Flesch M, Hoper A, Dell'Italia L, Evans K, Bond R, Peshock R, Diwan A, Brinsa TA, Wei CC, Sivasubramanian N, Spinale FG, Mann DL. Activation and functional significance of the renin-angiotensin system in mice with cardiac restricted overexpression of tumor necrosis factor. Circulation 108: 598–604, 2003 [DOI] [PubMed] [Google Scholar]
- 7.Ghosh S, Hayden MS. New regulators of NF-kappaB in inflammation. Nat Rev Immunol 8: 837–848, 2008 [DOI] [PubMed] [Google Scholar]
- 8.Gonzalez-Villalobos RA, Seth DM, Satou R, Horton H, Ohashi N, Miyata K, Katsurada A, Tran DV, Kobori H, Navar LG. Intrarenal angiotensin II and angiotensinogen augmentation in chronic angiotensin II-infused mice. Am J Physiol Renal Physiol 295: F772–F779, 2008 [DOI] [PMC free article] [PubMed] [Google Scholar]
- 9.Guan H, Hou S, Ricciardi RP. DNA binding of repressor nuclear factor-kappaB p50/p50 depends on phosphorylation of Ser337 by the protein kinase A catalytic subunit. J Biol Chem 280: 9957–9962, 2005 [DOI] [PubMed] [Google Scholar]
- 10.Ingelfinger JR, Zuo WM, Fon EA, Ellison KE, Dzau VJ. In situ hybridization evidence for angiotensinogen messenger RNA in the rat proximal tubule. An hypothesis for the intrarenal renin angiotensin system. J Clin Invest 85: 417–423, 1990 [DOI] [PMC free article] [PubMed] [Google Scholar]
- 11.Karin M, Ben-Neriah Y. Phosphorylation meets ubiquitination: the control of NF-kappa B activity. Annu Rev Immunol 18: 621–663, 2000 [DOI] [PubMed] [Google Scholar]
- 12.Katsurada A, Hagiwara Y, Miyashita K, Satou R, Miyata K, Ohashi N, Navar LG, Kobori H. Novel sandwich ELISA for human angiotensinogen. Am J Physiol Renal Physiol 293: F956–F960, 2007 [DOI] [PMC free article] [PubMed] [Google Scholar]
- 13.Kobori H, Harrison-Bernard LM, Navar LG. Expression of angiotensinogen mRNA and protein in angiotensin II-dependent hypertension. J Am Soc Nephrol 12: 431–439, 2001 [DOI] [PMC free article] [PubMed] [Google Scholar]
- 14.Kobori H, Ozawa Y, Satou R, Katsurada A, Miyata K, Ohashi N, Hase N, Suzaki Y, Sigmund CD, Navar LG. Kidney-specific enhancement of ANG II stimulates endogenous intrarenal angiotensinogen in gene-targeted mice. Am J Physiol Renal Physiol 293: F938–F945, 2007 [DOI] [PMC free article] [PubMed] [Google Scholar]
- 15.Kobori H, Ozawa Y, Suzaki Y, Nishiyama A. Enhanced intrarenal angiotensinogen contributes to early renal injury in spontaneously hypertensive rats. J Am Soc Nephrol 16: 2073–2080, 2005 [DOI] [PMC free article] [PubMed] [Google Scholar]
- 16.Lang V, Janzen J, Fischer GZ, Soneji Y, Beinke S, Salmeron A, Allen H, Hay RT, Ben-Neriah Y, Ley SC. betaTrCP-mediated proteolysis of NF-kappaB1 p105 requires phosphorylation of p105 serines 927 and 932. Mol Cell Biol 23: 402–413, 2003 [DOI] [PMC free article] [PubMed] [Google Scholar]
- 17.Lee DF, Hung MC. Advances in targeting IKK and IKK-related kinases for cancer therapy. Clin Cancer Res 14: 5656–5662, 2008 [DOI] [PMC free article] [PubMed] [Google Scholar]
- 18.Lee YJ, Suh HN, Han HJ. Effect of BSA-induced ER stress on SGLT protein expression levels and alpha-MG uptake in renal proximal tubule cells. Am J Physiol Renal Physiol 296: F1405–F1416, 2009 [DOI] [PubMed] [Google Scholar]
- 19.MacEwan DJ. TNF receptor subtype signalling: differences and cellular consequences. Cell Signal 14: 477–492, 2002 [DOI] [PubMed] [Google Scholar]
- 20.Marketou ME, Zacharis EA, Koukouraki S, Stathaki MI, Arfanakis DA, Kochiadakis GE, Chlouverakis G, Karkavitsas NS, Vardas PE. Effect of angiotensin-converting enzyme inhibitors on systemic inflammation and myocardial sympathetic innervation in normotensive patients with type 2 diabetes mellitus. J Hum Hypertens 22: 191–196, 2008. [DOI] [PubMed] [Google Scholar]
- 21.Mihailovic-Stanojevic N, Jovovic D, Miloradovic Z, Grujic-Milanovic J, Jerkic M, Markovic-Lipkovski J. Reduced progression of adriamycin nephropathy in spontaneously hypertensive rats treated by losartan. Nephrol Dial Transplant 2008 [DOI] [PubMed] [Google Scholar]
- 22.Morimoto Y, Gai Z, Tanishima H, Kawakatsu M, Itoh S, Hatamura I, Muragaki Y. TNF-alpha deficiency accelerates renal tubular interstitial fibrosis in the late stage of ureteral obstruction. Exp Mol Pathol 85: 207–213, 2008 [DOI] [PubMed] [Google Scholar]
- 23.Natoli G, Chiocca S. Nuclear ubiquitin ligases, NF-kappaB degradation, and the control of inflammation. Sci Signal 1: pe1, 2008 [DOI] [PubMed] [Google Scholar]
- 24.Navar LG, Harrison-Bernard LM, Nishiyama A, Kobori H. Regulation of intrarenal angiotensin II in hypertension. Hypertension 39: 316–322, 2002 [DOI] [PMC free article] [PubMed] [Google Scholar]
- 25.Nyui N, Tamura K, Yamaguchi S, Nakamaru M, Ishigami T, Yabana M, Kihara M, Ochiai H, Miyazaki N, Umemura S, Ishii M. Tissue angiotensinogen gene expression induced by lipopolysaccharide in hypertensive rats. Hypertension 30: 859–867, 1997 [DOI] [PubMed] [Google Scholar]
- 26.Pincheira R, Castro AF, Ozes ON, Idumalla PS, Donner DB. Type 1 TNF receptor forms a complex with and uses JAK2 and c-Src to selectively engage signaling pathways that regulate transcription factor activity. J Immunol 181: 1288–1298, 2008 [DOI] [PubMed] [Google Scholar]
- 27.Rangan G, Wang Y, Harris D. NF-kappaB signalling in chronic kidney disease. Front Biosci 14: 3496–3522, 2009 [DOI] [PubMed] [Google Scholar]
- 28.Recinos A, 3rd, LeJeune WS, Sun H, Lee CY, Tieu BC, Lu M, Hou T, Boldogh I, Tilton RG, Brasier AR. Angiotensin II induces IL-6 expression and the JAK-STAT3 pathway in aortic adventitia of LDL receptor-deficient mice. Atherosclerosis 194: 125–133, 2007 [DOI] [PMC free article] [PubMed] [Google Scholar]
- 29.Ruiz-Ortega M, Ruperez M, Lorenzo O, Esteban V, Blanco J, Mezzano S, Egido J. Angiotensin II regulates the synthesis of proinflammatory cytokines and chemokines in the kidney. Kidney Int Suppl 12–22, 2002 [DOI] [PubMed] [Google Scholar]
- 30.Sakurai H, Chiba H, Miyoshi H, Sugita T, Toriumi W. IkappaB kinases phosphorylate NF-kappaB p65 subunit on serine 536 in the transactivation domain. J Biol Chem 274: 30353–30356, 1999 [DOI] [PubMed] [Google Scholar]
- 31.Satou R, Gonzalez-Villalobos RA, Miyata K, Ohashi N, Katsurada A, Navar LG, Kobori H. Costimulation with angiotensin II and interleukin 6 augments angiotensinogen expression in cultured human renal proximal tubular cells. Am J Physiol Renal Physiol 295: F283–F289, 2008 [DOI] [PMC free article] [PubMed] [Google Scholar]
- 32.Satou R, Gonzalez-Villalobos RA, Miyata K, Ohashi N, Urushihara M, Acres OW, Navar LG, Kobori H. IL-6 augments angiotensinogen in primary cultured renal proximal tubular cells. Mol Cell Endocrinol 311: 24–31, 2009 [DOI] [PMC free article] [PubMed] [Google Scholar]
- 33.Schunkert H, Ingelfinger JR, Jacob H, Jackson B, Bouyounes B, Dzau VJ. Reciprocal feedback regulation of kidney angiotensinogen and renin mRNA expressions by angiotensin II. Am J Physiol Endocrinol Metab 263: E863–E869, 1992 [DOI] [PubMed] [Google Scholar]
- 34.Sebban H, Courtois G. NF-kappaB and inflammation in genetic disease. Biochem Pharmacol 72: 1153–1160, 2006 [DOI] [PubMed] [Google Scholar]
- 35.Shahid M, Francis J, Majid DS. Tumor necrosis factor-alpha induces renal vasoconstriction as well as natriuresis in mice. Am J Physiol Renal Physiol 295: F1836–F1844, 2008 [DOI] [PMC free article] [PubMed] [Google Scholar]
- 36.Terada Y, Tomita K, Nonoguchi H, Marumo F. PCR localization of angiotensin II receptor and angiotensinogen mRNAs in rat kidney. Kidney Int 43: 1251–1259, 1993 [DOI] [PubMed] [Google Scholar]
- 37.Tong X, Yin L, Washington R, Rosenberg DW, Giardina C. The p50-p50 NF-kappaB complex as a stimulus-specific repressor of gene activation. Mol Cell Biochem 265: 171–183, 2004 [DOI] [PubMed] [Google Scholar]
- 38.Wang B, Jenkins JR, Trayhurn P. Expression and secretion of inflammation-related adipokines by human adipocytes differentiated in culture: integrated response to TNF-alpha. Am J Physiol Endocrinol Metab 288: E731–E740, 2005 [DOI] [PubMed] [Google Scholar]
- 39.Wei YH, Jun L, Qiang CJ. Effect of losartan, an angiotensin II antagonist, on hepatic fibrosis induced by CCl4 in rats. Dig Dis Sci 49: 1589–1594, 2004 [DOI] [PubMed] [Google Scholar]


