Summary
Hepatoblastoma is the most common malignant tumor of the liver of children worldwide. Histologically, hepatoblastomas show marked variation in the type and proportion of epithelial (fetal, embryonal, or small cell) and mesenchymal components with differing prognosis and response to therapy. The pure fetal–type hepatoblastoma, presenting as stage 1 and resectable, has the best prognosis, whereas the small cell histology has been associated with unfavorable outcome. Using gene expression profiling, we demonstrate that in addition to Wnt pathway deregulation, cell growth and survival pathways are also globally deregulated in hepatoblastomas. Furthermore, the different histologic subtypes are characterized by specific gene expression and pathway signatures that give insight into the degree of molecular heterogeneity that is present among these tumors. Although Wnt signaling pathway upregulation is common to all histologic types of hepatoblastoma, this pathway is even more significantly deregulated in aggressive hepatoblastomas. In addition, deregulation of MAPK signaling pathway and antiapoptotic signaling is preferentially upregulated in aggressive epithelial hepatoblastomas with a small cell component. The gene expression signatures reported here provide possible prognostic and diagnostic markers as well as therapeutic targets for this disease.
Keywords: Gene expression profiling, Fetal, Small cell and embryonal hepatoblastoma, Liver tumors, Pediatric
1. Introduction
Hepatoblastoma (HB) is the most common malignant tumor of the liver of children worldwide [1] and despite its rarity has been treated with some success by the combined efforts of several national and international consortia [2]. Nevertheless, some children die because of early and widespread dissemination and resistance to usually effective chemotherapy [3]. Histologically, HBs show marked variation in the type and proportion of epithelial (fetal, embryonal, or small cell) and mesenchymal components, with differing prognosis and response to therapy [3]. The stage 1 pure fetal (PF)–type HB can be cured by surgery alone, whereas small cell undifferentiated histology has been associated with unfavorable outcome regardless of resectability [4].
The occurrence of HB in the context of familial syndromes such as Beckwidth-Wiedemann syndrome and familial adenomatous polyposis with APC mutations indicates the multiplicity of specific signaling pathways in the development of HB. Although APC mutations have been infrequent in sporadic HB, recent studies have identified β-catenin mutations and met deregulation in childhood HB, thus implicating the wnt and MAPK signaling pathways in the biology of these tumors [5]. Paradoxically, the elevation of wnt antagonists has also been described in HB [6] which partly represents a negative feedback response resulting from β-catenin mutations and constitutive activation of the canonical Wnt pathway [6].
In a recent report, Luo et al [7] compared HB with hepatocellular carcinomas (HCC) and identified upregulation of expression of MIG6, TGFb1, DLK1, and IGF2 in HB. These genes were differentially expressed between HB and HCC and did not separate HB histologic subtypes. A difference in expression of claudin 1 and claudin 2, which are epithelial tight junction proteins, has been reported between fetal and embryonal HB [8].
Given the widespread deregulation of the Wnt–β-catenin pathway in multiple histologic subtypes, we hypothesized that the prognostic differences associated with histologic subtypes of HB may be explained by perturbation of other pathways and genes. To dissect the full spectrum of genetic changes, we carried out gene expression profiling on a panel of HB using the Affymetrix platform (Affymetrix, Santa Clara, CA). We found that, in addition to Wnt, cell growth and survival pathways are also globally deregulated in HB. Furthermore, the different subtypes were characterized by specific gene expression and pathway signatures that give us insight into the extensive heterogeneity that is characteristic of this tumor. These same genes provide powerful prognostic and diagnostic markers as well as possible therapeutic targets for this disease.
2. Materials and methods
2.1. Hepatoblastoma samples and RNA preparation
After obtaining institutional review board approval, 13 primary HBs were analyzed in the study, including 8 that are exclusively epithelial (2 PF, 3 fetal/embryonal, 3 fetal/embryonal/small cell), and 5 with mixed epithelial (fetal/embryonal) and mesenchymal components. Frozen and paraffin-embedded tumor tissues were obtained from the Cooperative Human Tissue Network (Biopathology Center, Columbus, OH), and tumors were seen in consultation at Texas Children’s Hospital, Department of Pathology. Three separate sets of pooled fetal liver (FL) and normal adult liver (NL) mRNA (BD Clontech, Mountain View, CA) were used as reference controls. For validation studies, 34 cases of HB (including 12 of the 13 primary HBs used for gene profiling) were used for quantitative real-time reverse transcription-polymerase chain reaction (Qrt-RT-PCR) analysis
2.2. RNA Extraction, quantitation, and analysis
Total RNA was isolated from frozen tissue sections and areas of tumor previously confirmed by histologic examination using RNAqueous Micro Kit (Ambion, Austin, TX #1927) followed by Dnase treatment and inactivation. RNA concentration was analyzed using a NanoDrop ND-1000 Spectrophotometer. To evaluate the integrity of RNA in the samples after quantitation of concentration, an appropriate dilution of total RNA was analyzed using the Agilent 2100 Bioanalyzer and the RNA 6000 Nano LabChip kit.
2.3. Quantitative real-time reverse transcription-PCR
This procedure and the sequences of the primers used are detailed in Lopez-Terrada et al [9]. Simply, expression of 17 WNT target genes (DKK, IGF2, AXIN2, SOX9, MMP7, BetaTRCP, bone morphogenetic protein 4, CMYC, Cyclin D1, EGFR, Gpr49, ITF2/TCF4, MET, NKD, NLK, and UPAR) and 2 Notch pathway genes (DLK, Hes1) was analyzed in 32 HB cases by Qrt-RT-PCR using SYBR Green. Results were normalized using normal liver controls.
2.3.1. Gene profiling and quality analysis
Commercially available high-density oligonucleotide microarrays HG_U133A and U133 plus (Affymetrix) were used for this study. Preparation of cRNA, hybridization, scanning, and image analysis of the arrays were done according to the manufacturers’ protocols. Briefly, 5 μg of total RNA was used to generate cRNA probes and combined with a mixture of control cRNAs (made from bacterial genes BioB, BioC, BioDN, and CreX) before hybridization. All GeneChip images were visually inspected for irregularities. The raw median signal for 17 (13 HBs, 3 pooled FL, and 1 pooled NL) of the arrays (75 ± 41) and the median percentage of genes present (55 ± 4.03) indicated the high overall quality of the assays.
2.3.2. Data analysis
Raw images (.dat files) from Affymetrix GeneChip scanner were processed with dChip 2006 software (http://biosun1.harvard.edu/complab/dchip/). The raw signal of individual probes for the 17 arrays was normalized against the chip with median raw signal intensity and is based on a set of probes called an “invariant set” that consists of points from nondifferentially expressed genes. After normalization, the expression values of each gene in all samples were computed using a perfect match–only model followed by outlier detection algorithm. A gene was identified as present (P call) when a P value of less than .05 is obtained for the probe set. The tumor and reference samples analyzed with the 2 chips sets U133A and U133 plus were merged using the U133A gene info list. They were then scaled to have the same median array. Expression values were normalized using the same “invariant set” normalization method [10]. HB3 was excluded from further analysis because the percentage of genes present on the chip analysis was lower than 50%. Unsupervised hierarchical clustering was done with dChip 2006.
2.3.2.1. Identification of differentially expressed genes
With the dChip 2006 software, differentially expressed genes greater than 1.5-fold, with intensity difference greater than 100 units, were obtained by comparing the entire group of HB tumors with the triplicate samples of pooled FL. With the use of the same criteria, subsets of tumors classified as PF, epithelial (fetal/embryonal), mixed epithelial and mesenchymal, and epithelial (fetal/embryonal) with small cell components were independently compared with FL. The list of genes differentially expressed between the FL and all HBs was used for hierarchical clustering analysis using the Euclidean distance approach for distance metric and the centroid method for linkage. Gene ordering was done by cluster tightness. The P value for calling a significant cluster was .001.
2.3.2.2. Analysis of signaling pathway changes and alterations
The pattern of alteration of signaling pathways was determined using the Web-based Intelligent Systems and Bioinformatics software (http://vortex.cs.wayne.edu/) [11–15] and Ingenuity Pathway Analysis software (https://analysis.ingenuity.com/). These software applications allow a determination of the relative functional significance of molecules present on the differentially expressed gene list. Using the list of differentially expressed genes, they construct functional profiles (using gene ontology terms) including biochemical function, biological process, cellular role, cellular component, and molecular function. They also highlight statistically significant cellular functions (at P < .05), which allows a better understanding of the biological phenomenon present in the set of tumors analyzed.
3. Results
The expression profiles of ~22 000 transcripts were analyzed in a panel of HBs using the Affymetrix U133A gene list. Twelve arrays with P call greater than 65% were selected for the analyses. Three pooled FL and one pooled NL were used as controls.
3.1. Fetal liver versus all histologic types of HB
Comparison of FL with all HBs showed a total of 942 differentially expressed genes. This gene list was used for unsupervised hierarchical clustering to see whether HB can be stratified into subgroups based on gene expression signatures. The control FL and NL clustered together in the dendrogram are shown in Fig. 1. Epithelial HB with small cell components and 4 of 5 mixed epithelial and mesenchymal HB clustered together into 2 respective groups. The PF HB and epithelial (fetal + embryonal) HB were randomly clustered between the mixed epithelial and mesenchymal tumors and FL.
Fig. 1.
Unsupervised hierarchical clustering analysis produced separate groupings for normal liver tissues (fetal liver and adult liver), 4 of 5 mixed epithelial and mesenchymal HBs (HB9, 10, 11, and 12) and epithelial HB with small cell component (HB4 and 5). Pure fetal HB (HB13 and 56) and epithelial tumors with only fetal and embryonal components (HB1, 8, and 14) are randomly distributed.
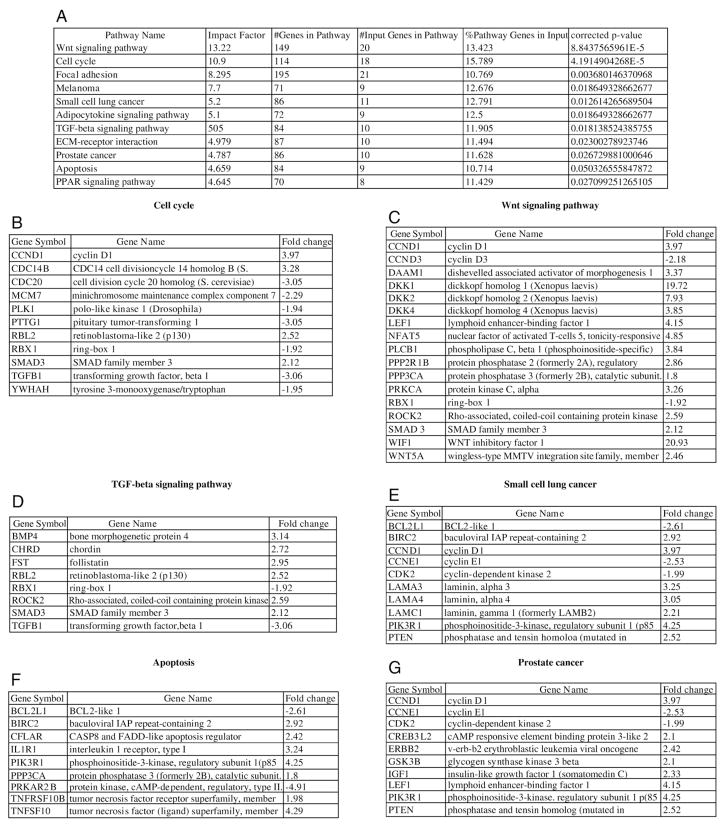
Pathway analysis of the differentially expressed genes between FL and all HB revealed the deregulation of a number of cell signaling pathways. Wnt signaling (Fig. 2C), cell cycle (Fig. 2B), adipocytokine signaling, TGF β (Fig. 2D), PPAR signaling, and extracellular matrix–receptor interaction pathways were significantly upregulated (P <.05) (Fig. 2A). The apoptosis pathway was significantly down-regulated (P = .05) (Fig. 2F). In this comparison, the gene expression profiles of HB overlapped with the gene expression profiles of melanoma, small cell lung cancer, and prostate cancer (Fig. 2E and G).
Fig. 2.
Analysis of genes differentially expressed between fetal liver and all HBs shows significant activation of signaling pathways including (A) wnt signaling, cell cycle, etc. The fold change for genes which are components of the (B) cell cycle, (C) wnt signaling pathway, (D) TGF β signaling pathway, and (F) apoptosis, as well as deregulated genes shared with other specific malignancies such as (E) small cell lung cancer and (G) prostate cancer, is shown.
3.1.1. Wnt signaling pathway genes
The Wnt pathway was the most significantly upregulated pathway in all HB (Table 1). The Wnt ligand Wnt5a and molecules directly involved in the cell cycle including Cyclin D1 (CCND1) involved in cell proliferation were induced, as were some genes in the noncanonical Wnt pathway such as DAAM1 and ROCK2. Wnt antagonists dickkopf homolog 1, 2, and 4 (DKK1, 2, and 4) and WNT inhibitory factor 1, which are also target genes of the Wnt pathway, were also induced (Fig. 2C). As most HBs have a constitutively active β-catenin protein, upstream antagonists are likely to have no influence.
Table 1.
Histologic classification of HB tumors analyzed
| HB no. | Histologic type | Affymetrix microarray chip | Group |
|---|---|---|---|
| HB1 | Epithelial HB, fetal and embryonal | U133 A | 2 |
| HB2 | Mixed epithelial and mesenchymal HB | U133 A | 3 |
| HB3 | Epithelial HB, fetal, embryonal, and small cell | U133 A | 4 |
| HB4 | Epithelial HB, fetal, embryonal, and small cell | U133 A | 4 |
| HB5 | Epithelial HB, fetal, embryonal, and small cell | U133 A | 4 |
| HB8 | Epithelial HB, fetal and embryonal (postchemotherapy) | U133 plus 2 | 2 |
| HB9 | Mixed epithelial (fetal and embryonal) and mesenchymal | U133 plus 2 | 3 |
| HB10 | Mixed epithelial (fetal and embryonal) and mesenchymal | U133 plus 2 | 3 |
| HB11 | Mixed epithelial (fetal and embryonal) and mesenchymal | U133 plus 2 | 3 |
| HB12 | Mixed epithelial (fetal and embryonal) and mesenchymal | U133 plus 2 | 3 |
| HB13 | Epithelial, HB, PF | U133 plus 2 | 1 |
| HB14 | Epithelial, HB, fetal and embryonal | U133 plus 2 | 2 |
| HB56 | Epithelial, HB, PF | U133 plus 2 | 1 |
| 2005 | Fetal liver U133 A | U133 A | Ref control |
| 2006 | Fetal liver U133 plus 2 | U133 plus 2 | Ref control |
| 2007 | Fetal liver U133 plus 2 | U133 plus 2 | Ref control |
3.1.2. Cell cycle genes
Cell cycle genes CCND1, CDC14 cell division cycle 1 homolog B, and RBL2 are upregulated. In contrast, many cell cycle genes were downregulated. These include cell division cycle 20 homolog, mini chromosome maintenance complex component 7, polo-like kinase 1, pituitary tumor–transforming 1, RBL2, ring-box 1, TGF β1, and tyrosine 3-monooxygenase/tryptophan (YWHAH) (Fig. 2B).
3.1.3. TGF signaling pathway genes
Upregulated genes include bone morphogenetic protein 4, chordin, follistatin, retinoblastoma-like 2 (p130), ROCK2, and SMAD3. TGF β1 and ring-box1 were downregulated (Fig. 2D).
3.1.4. Apoptosis
Proapoptotic genes downregulated include BCL2-like 1 (BCL2L1) and protein kinase cAMP-dependent regulatory type II. In contrast, a number of antiapoptotic and prosurvival genes are upregulated. These include BIRC2, CASP8, and FADD-like apoptosis regulator (CFLAR), PIK3R1, PPP3CA, tumor necrosis factor receptor superfamily member (TNFRSF10B), and tumor necrosis factor (ligand) superfamily member (TNFSF10) (Fig. 2F).
3.1.5. Cancer-related gene expression
Some of the differentially regulated genes recapitulate the pattern of gene alterations seen in a number of malignant tumors such as small cell lung cancer, melanoma, and prostate cancer. Notable among these genes is the upregulation of the antiapoptotic gene baculoviral IAP repeat-containing 2 (BIRC2) and prosurvival gene phosphoinositide-3-kinase regulatory subunit 1 (p85). In contrast, proapoptotic gene BCL2L1 is downregulated (Fig. 5). Cell cycle–related genes cyclin-dependent kinase 2 (cdk2) and cyclin E1 are down-regulated. Extracellular matrix proteins laminin α 3 and 4 and laminin gamma 1 are upregulated. In addition, phosphatase and tensin homolog is also upregulated, a feature shared with small cell lung cancer and prostate cancer. Proliferation enhancing genes including cAMP responsive element binding protein 3–like 2, v-erb-b2 erythroblastic leukemia viral oncogene (ERBB2), glycogen synthase kinase 3 β, and insulin-like growth factor 1 are also upregulated (Fig. 2E and G).
Fig. 5.
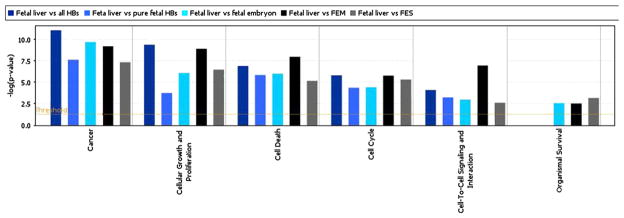
Bar chart illiustrates the differential perturbation of genes involved in specific biofunctions including cancer related genes, cell growth and proliferation, cell death, cell cycle, and organismal survival when each of the histologic subtypes are compared with normal fetal liver. It also shows a significant differential upregulation of organismal survival genes only in the epithelial HBs with embryonal and/or small cell components.
3.2. Fetal liver or PF HB versus histologic subtypes of HB
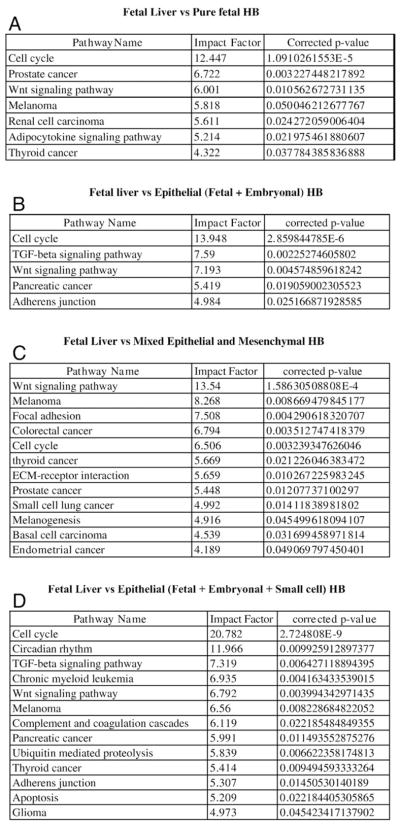
A significant number of genes involving multiple pathways were differentially expressed between fetal liver versus PF HB (1260 genes; Fig. 3A), fetal liver versus epithelial HB (fetal and embryonal) (1135 genes; Fig. 3B), fetal liver versus mixed epithelial (fetal/embryonal) and mesenchymal HB (824 genes; Fig. 3C), and fetal liver versus epithelial HB with fetal, embryonal, and small cell components (622 genes; Fig. 3D).
Fig. 3.
A–D show genes differentially expressed between fetal liver and other histologic subtypes of HB, the association of these genes with the deregulation of specific pathways, and genes shared with other specific malignancies. The P values reflect the degree of “significance” of perturbation of specific pathways such as wnt and cell genes which correlate with aggressiveness of histologic subtypes.
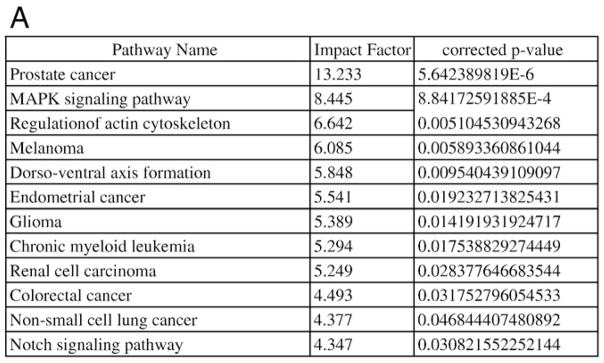
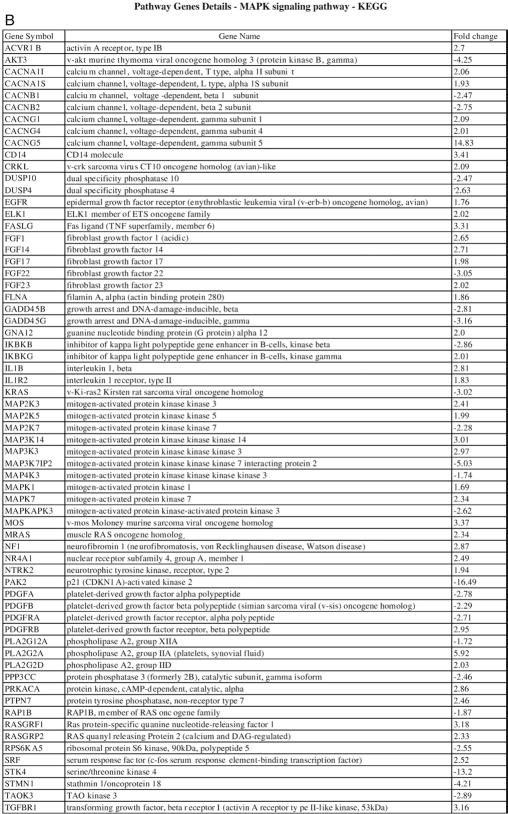
Similarly, a comparison of PF HB with other histologic subtypes showed a number of differentially expressed genes as follows: PF HB versus epithelial HB with fetal and embryonal components—239 genes; PF HB versus mixed epithelial (fetal, embryonal) and mesenchymal HB—439 genes; PF HB versus epithelial HB with fetal, embryonal, and small cell components—3075 genes (Fig. 4A and B). Many of the same pathways including cell cycle, Wnt, TGF β signaling pathway, adherens junction, and antiapoptosis were significantly differentially deregulated between PF liver and the more aggressive subtypes containing a small cell component. Notably, MAPK signaling pathway was found to be differentially upregulated between PF HB and epithelial HB tumors with a small cell component (Table 2).
Fig. 4.
Analysis of genes differentially expressed between PF HB and epithelial HB with small cell component shows (A) significant perturbation of MAPK signaling pathway among others. MAPK signaling pathway genes and their fold change are shown in (B).
Table 2.
A comparison of the P values associated with pathway perturbation for (A) cell cycle, (B) wnt signaling pathway, (C) MAPK signaling pathway, and (D) Notch signaling pathway among compared groups of HB tumors and FL or PF HB
| A. Wnt signaling pathway | |
|---|---|
| Fetal liver vs all HBs | P = 8.8E-5 |
| Fetal liver vs PF HB | P = .01 |
| Fetal liver vs fetal and embryonal HB | P = .005 |
| Fetal liver vs mixed epithelial (fetal, embryonal) and mesenchymal HB | P = 1.5E-4 |
| Fetal liver vs fetal, embryonal, and small cell | P = .004 |
| Pure fetal HB vs fetal and embryonal HB | P > .05 |
| Pure fetal HB vs mixed epithelial (fetal, embryonal) and mesenchymal HB | P > .05 |
| Pure fetal HB vs fetal, embryonal, and small cell HB | P > .05 |
| B. Cell cycle | |
| Fetal liver vs all HBs | P = 4.19E-5 |
| Fetal liver vs PF HB | P = 1.09E-5 |
| Fetal liver vs fetal and embryonal HB | P = 2.86E-6 |
| Fetal liver vs mixed epithelial (fetal, embryonal) and mesenchymal HB | P = 3.0E-3 |
| Fetal liver vs fetal, embryonal, and small cell | P = 2.7E-9 |
| C. MAPK signaling pathway | |
| Fetal liver vs all HBs | P > .05 |
| Fetal liver vs PF HB | P > .05 |
| Fetal liver vs fetal and embryonal HB | P > .05 |
| Fetal liver vs mixed epithelial (fetal, embryonal) and mesenchymal HB | P > .05 |
| Fetal liver vs fetal, embryonal, and small cell | P > .05 |
| Pure fetal HB vs fetal and embryonal HB | P > .05 |
| Pure fetal HB vs mixed epithelial (fetal, embryonal) and mesenchymal HB | P > .05 |
| Pure fetal HB vs fetal, embryonal, and small cell HB | P = 8.8E-4 |
| D. Notch signaling pathway | |
| Fetal liver vs all HBs | P > .05 |
| Fetal liver vs PF HB | P > .05 |
| Fetal liver vs fetal and embryonal HB | P > .05 |
| Fetal liver vs mixed epithelial (fetal, embryonal) and mesenchymal HB | P > .05 |
| Fetal liver vs fetal, embryonal, and small cell | P > .05 |
| Pure fetal HB vs fetal and embryonal HB | P > .05 |
| Pure fetal HB vs mixed epithelial (fetal, embryonal) and mesenchymal HB | P > .05 |
| Pure fetal HB vs fetal, embryonal, and small cell HB | P = 3.0E-2 |
3.3. Comparison of the differentially expressed genes between fetal liver and HB subtypes
The differentially expressed gene lists obtained from a comparison of fetal liver versus all histologic types of HB, versus PF HB or epithelial (fetal/embryonal) HB or mixed epithelial (fetal/embryonal) and mesenchymal HB or epithelial (fetal/embryonal/small cell) HB were subjected to analysis with the ingenuity software (https://analysis.ingenuity.com/) to determine the extent of divergence, if any, in the biofunctional classification of the differentially expressed genes between all HBs as well as subtypes of HB and fetal liver. The analysis shows similar patterns of significant upregulation of cancer-related genes, cell death regulatory genes, and cell cycle control genes in all histologic groups of HB. Although all groups show significant upregulation of cellular growth and proliferation genes, there is a significantly lower level of expression of cellular growth and proliferation genes in PF HB. Cell cycle genes cyclin D3 and cyclin E1 were significantly downregulated relative to fetal liver. In addition, organismal survival genes were significantly upregulated in epithelial HB with fetal/embryonal and/or small cell components in contrast to PF HB in which the expression of those genes did not reach statistical significance (Fig. 5).
3.4. Validation of differential expression of Wnt and Notch pathway genes
The level of expression of Wnt signaling and Notch pathway genes was examined in a larger subset of 34 HBs by quantitative real-time RT-PCR. This validation subset also included the 12 HBs used for the gene expression profiling studies. The result of analysis of these genes is presented in a related manuscript by Lopez-Terrada et al [9].
3.5. Chromosomal localization of upregulated genes in HB
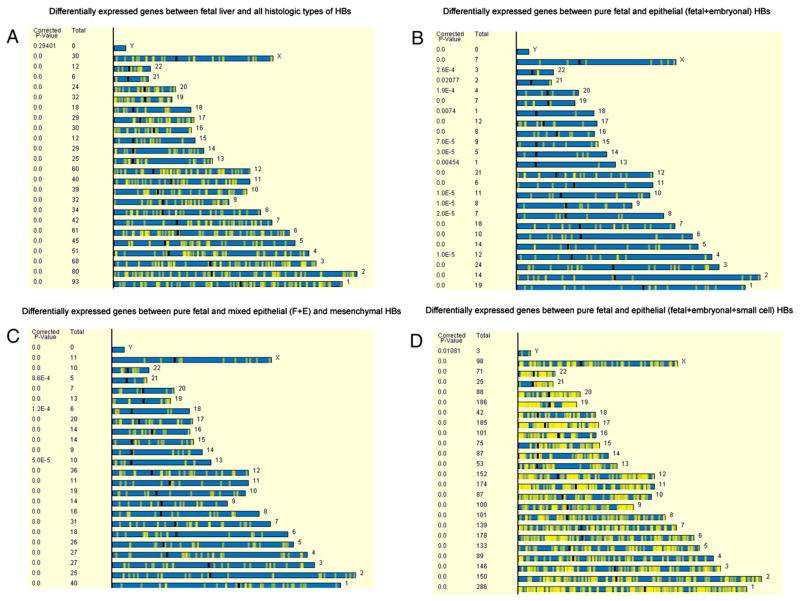
The chromosomal localization of genes that are differentially expressed between fetal liver and all the HB was determined. The analysis shows localization of these genes in all chromosomes with no preferential localization in a specific subset of chromosomes (Fig. 6A). In addition, the chromosomal localization of genes differentially expressed between PF and epithelial tumors with fetal and embryonal components (Fig. 6B), mixed epithelial and mesenchymal components (Fig. 6C), and epithelial tumors with small cell component (Fig. 6D) was also determined, respectively. There were significant differences in the chromosomal distribution of the differentially expressed genes between PF and epithelial HB with fetal and embryonal components. The chromosomes with significant differential concentration of these genes were chromosomes 4, 8, 9, 10, 13, 14, 15, 18, 20, 21, and 22. Similarly, genes differentially expressed between PF HB and mixed epithelial and mesenchymal HBs were significantly more concentrated on chromosomes 13, 18, and 21. Epithelial HB with a small cell component showed a high density of differentially expressed genes when compared with PF HB, but there was no specific predilection for a specific subset of chromosomes.
Fig. 6.
Chromosomal localization of genes differentially expressed between (A) FL versus all HBs, (B) PF HB versus epithelial HBs with embryonal component, (C) PF HB versus mixed epithelial and mesenchymal HB, and (D) PF versus epithelial HB with a small cell component. Note a high density of differentially expressed genes between PF and epithelial HB with a small cell component.
3.6. Conclusion
HBs with well-differentiated PF epithelial morphology comprise about 5% of tumors. When associated with low mitotic activity, they represent the best prognostic histologic subtype of HB and if amenable to surgical resection (stage I) are cured without chemotherapy [4]. This contrasts with all other HB subtypes that require cisplatin/doxorubicin-based chemotherapy as well as surgical resection and in some cases liver transplantation [16].
Gene expression profiling studies in HBs are few, with only a few differentially expressed genes with prognostic significance having been identified, including increased expression of the polo-like kinase 1 gene in association with aggressive phenotype and poor prognosis [7,17]. In a recent study, IGF2, fibronectin, DLK1, TGFb1, MALAT1, and MIG6 were found to be overexpressed in 7 HBs compared with HCC [7].
In this study, we have analyzed the gene expression profile of different histologic HB subtypes associated with prognosis. We note that canonical Wnt signaling is upregulated in all HBs, with the most significant induction in the more aggressive tumors (Table 1). For example, Cyclin D1 (a marker of Wnt activation) is significantly more upregulated than in PF HB with better prognosis. Cyclin D3 and E1 were in fact found to be downregulated in PF HB. As has been previously reported [18], we also observed upregulation of Wnt pathway antagonists such as DKK1 in all HBs. As these antagonists act upstream of CCND1 in the Wnt pathway and their expression is also upregulated by Wnt pathway activation, we suggest therefore that their upregulation may only serve as markers of Wnt pathway activation.
Similarly, although cell cycle genes are significantly upregulated in the combined group of all HBs, the PF subtype showed relatively very low levels of expression of cell cycle genes. These levels were even significantly lower than seen in fetal liver (probably because of the large proportion of proliferating hematopoietic precursors from extramedullary hemopoiesis that is normally present in fetal liver), a finding consistent with the reported low proliferative activity in fetal HB (Table 2).
A comparison of fetal HB with fetal liver showed an upregulation of antiapoptotic pathways including the upregulation of CFLAR and downregulation of proapoptotic genes like BCL2L1. Epithelial tumors containing not only fetal but also embryonal and small cell components do not only show upregulated antiapoptotic genes but they also have a set of organismal prosurvival genes such as the PIK3R1, PPP3CA, tumor necrosis factor receptor superfamily member (TNFRSF10B), and tumor necrosis factor (ligand) superfamily member (TNFSF10) highly upregulated as well and at levels significantly higher than in PF HBs (Fig. 4).
A noteworthy observation in this study is the finding of significant upregulation of MAPK signaling pathway genes in epithelial tumors with small cell component when compared with PF HB. This suggests that the aggressive phenotype seen in these tumors may be partly related to the activation of the MAPK pathway. Notable upregulated components of this pathway include epidermal growth factor receptor (erythroblastic leukemia viral [verb-b] oncogene homolog, avian) (EGFR), fibroblast growth factor 1 (acidic), fibroblast growth factor 14, fibroblast growth factor 23, and transforming growth factor β receptor 1 (TGFB R1). EGFR and TGFB R1 have been reported as upregulated in HB [7,19]. We find a specific relationship between aggressive histology and the upregulation of the expression of these genes. These findings provide insight into the differential role of Wnt signaling, apoptotic/organismal survival, cell cycle genes, and MAPK pathway activation between PF HB and epithelial HB with small cell component. As EGFR is also a target of canonical Wnt pathway activation, its upregulation provides an important link between canonical Wnt activation and upregulation of the MAPK pathway in aggressive HB.
Mixed epithelial and mesenchymal HBs share the expression profiles of epithelial tumors containing fetal and embryonal components only. In addition, they show a significant upregulation of genes in the extracellular matrix–receptor interaction pathway including CD47 molecule, laminin α 4, laminin β 1, secreted phosphoprotein 1 (bone osteopontin; SPP1), and synaptic vesicle glycoprotein 2A (SPR1), which is consistent with the presence of mesenchymal differentiation in these tumors.
A number of chromosomal events including copy gains of portions or entire components of chromosomes 2, 8, 14, 19, 20, and X [2,20–32] have been described by us and others. In addition, recurring aberrations of 1q12-q21 and 2q [22,27–29] have also been reported. A comparison of the differentially expressed genes between fetal liver and all the HBs shows a nonselective distribution of genes in all chromosomes in a proportion consistent with the relative size of each chromosome. The chromosomal distribution of genes that are differentially expressed between PF liver and epithelial HB with fetal and embryonal components showed significant differential concentration on chromosomes 4, 8, 9, 10, 13, 14, 15, 18, 20, 21, and 22. In addition, there are a much larger number of genes that are upregulated in the epithelial tumors containing either the embryonal or small cell components, with the differentially expressed genes from tumors having a small cell component showing the greatest density of genes per chromosome. This observation is intuitive and is consistent with greater perturbation of global gene expression in tumors with a small cell component.
In summary, we demonstrate a progressive perturbation of critical signaling pathways responsible for growth, cell proliferation, and organismal survival in HBs. Although Wnt signaling pathway upregulation is common to all histologic types of HB, this pathway is even more significantly induced in aggressive HBs. In addition, induction of MAPK signaling pathway and antiapoptotic signaling is preferentially seen in aggressive epithelial HBs with a small cell component.
References
- 1.Stiller CA, Pritchard J, Steliarova-Foucher E. Liver cancer in European children: incidence and survival, 1978–1997. Report from the Automated Childhood Cancer Information System project. Eur J Cancer. 2006;42:2115–23. doi: 10.1016/j.ejca.2006.05.011. [DOI] [PubMed] [Google Scholar]
- 2.Mueller BU, Lopez-Terrada D, Finegold MJ. Tumors of the liver. In: Pizzo PA, Poplack DG, editors. Principles and Practice of Pediatric Oncology. 5. Philadelphia: Lippincott Williams and Wilkins; 2006. pp. 887–904. [Google Scholar]
- 3.Zimmermann A. The emerging family of hepatoblastoma tumours: from ontogenesis to oncogenesis. Eur J Cancer. 2005;41:1503–14. doi: 10.1016/j.ejca.2005.02.035. [DOI] [PubMed] [Google Scholar]
- 4.Haas JE, Feusner JH, Finegold MJ. Small cell undifferentiated histology in hepatoblastoma may be unfavorable. Cancer. 2001;92:3130–4. doi: 10.1002/1097-0142(20011215)92:12<3130::aid-cncr10115>3.0.co;2-#. [DOI] [PubMed] [Google Scholar]
- 5.Ranganathan S, Tan X, Monga SP. beta-Catenin and met deregulation in childhood hepatoblastomas. Pediatr Dev Pathol. 2005;8:435–47. doi: 10.1007/s10024-005-0028-5. [DOI] [PubMed] [Google Scholar]
- 6.Koch A, Waha A, Hartmann W, et al. Elevated expression of Wnt antagonists is a common event in hepatoblastomas. Clin Cancer Res. 2005;11:4295–304. doi: 10.1158/1078-0432.CCR-04-1162. [DOI] [PubMed] [Google Scholar]
- 7.Luo JH, Ren B, Keryanov S, et al. Transcriptomic and genomic analysis of human hepatocellular carcinomas and hepatoblastomas. Hepatology. 2006;44:1012–24. doi: 10.1002/hep.21328. [DOI] [PMC free article] [PubMed] [Google Scholar]
- 8.Halasz J, Holczbauer A, Pa’ska C, et al. Claudin-1 and claudin-2 differentiate fetal and embryonal components in human hepatoblastoma. Hum Pathol. 2006;37:555–61. doi: 10.1016/j.humpath.2005.12.015. [DOI] [PubMed] [Google Scholar]
- 9.Lopez-Terrada D, Gunaratne P, Adesina AM, Pulliam J, Hoang DM, Nguyen Y, Mistreta T-A, Margolin J, Finegold MJ. Histologic subtypes of hepatoblastoma are characterized by differential canonical Wnt and Notch pathway activation in arrested DLK+ precursors. Hum Pathol. doi: 10.1016/j.humpath.2008.07.022. [In press] [DOI] [PubMed] [Google Scholar]
- 10.Affymetrix, Inc. “GeneChip” expression analysis technical manual. 2002 August; http://www.affymetrix.com/support/technical/manul/expression_manual.affx.
- 11.Pass HI, Liu Z, Wali A, et al. Gene expression profiles predict survival and progression of pleural mesothelioma. Clin Cancer Res. 2004;10:849–59. doi: 10.1158/1078-0432.ccr-0607-3. [DOI] [PubMed] [Google Scholar]
- 12.Khatri P, Desai V, Tarca AL, et al. New Onto-Tools: Promoter-Express, nsSNPCounter and Onto-Translate. Nucleic Acids Res. 2006;34:W626–31. doi: 10.1093/nar/gkl213. [DOI] [PMC free article] [PubMed] [Google Scholar]
- 13.Khatri P, Bhavsar P, Bawa G, Draghici S. Onto-Tools: an ensemble of web-accessible, ontology-based tools for the functional design and interpretation of high-throughput gene expression experiments. Nucleic Acids Res. 2004;32:W449–56. doi: 10.1093/nar/gkh409. [DOI] [PMC free article] [PubMed] [Google Scholar]
- 14.Draghici S. Microarrays: tools for gene expression analysis. In: Krawetz SA, Womble DD, editors. Introduction to bioinformatics - A theoretical and practical approach. Humana Press; 2003. pp. 665–92. [Google Scholar]
- 15.Tarca AL, Romero R, Draghici S. Analysis of microarray experiments of gene expression profiling. Am J Obstet Gynecol. 2006;195:373–88. doi: 10.1016/j.ajog.2006.07.001. [DOI] [PMC free article] [PubMed] [Google Scholar]
- 16.Katzenstein HM, London WB, Douglass EC, et al. Treatment of unresectable and metastatic hepatoblastoma: a pediatric oncology group phase II study. J Clin Oncol. 2002;20:3438–44. doi: 10.1200/JCO.2002.07.400. [DOI] [PubMed] [Google Scholar]
- 17.Yamada S, Ohira M, Horie H, et al. Expression profiling and differential screening between hepatoblastomas and the corresponding normal livers: identification of high expression of the PLK1 oncogene as a poor-prognostic indicator of hepatoblastomas. Oncogene. 2004;23:5901–11. doi: 10.1038/sj.onc.1207782. [DOI] [PubMed] [Google Scholar]
- 18.Koch A, Waha A, Hartmann WA, et al. Elevated expression of Wnt antagonists is a common event in hepatoblastomas. Clin Cancer Res. 2005:11. doi: 10.1158/1078-0432.CCR-04-1162. [DOI] [PubMed] [Google Scholar]
- 19.Tan X, Apte U, Micsenyi A, et al. Epidermal growth factor receptor: a novel target of the Wnt/b-catenin pathway in liver. Gastroenterology. 2005;129:285–302. doi: 10.1053/j.gastro.2005.04.013. [DOI] [PMC free article] [PubMed] [Google Scholar]
- 20.Terracciano LM, Bernasconi B, Ruck P, et al. Comparative genomic hybridization analysis of hepatoblastoma reveals high frequency of X-chromosome gains and similarities between epithelial and stromal components. Hum Pathol. 2003;34:864–71. doi: 10.1016/s0046-8177(03)00351-4. [DOI] [PubMed] [Google Scholar]
- 21.Tonk VS, Wilson KS, Timmons CF, Schneider NR. Trisomy 2, trisomy 20, and del(17p) as sole chromosomal abnormalities in three cases of hepatoblastoma. Genes Chromosome Cancer. 1994;11:199–202. doi: 10.1002/gcc.2870110309. [DOI] [PubMed] [Google Scholar]
- 22.Yeh YA, Rao PH, Cigna CT, Middlesworth W, Lefkowitch JH, Murty VV. Trisomy 1q, 2, and 20 in a case of hepatoblastoma: possible significance of 2q35-q37 and 1q12-q21 rearrangements. Cancer Genet Cytogenet. 2000;123:140–3. doi: 10.1016/s0165-4608(00)00323-x. [DOI] [PubMed] [Google Scholar]
- 23.Ma SK, Cheung AN, Choy C, et al. Cytogenetic characterization of childhood hepatoblastoma. Cancer Genet Cytogenet. 2000;119:32–6. doi: 10.1016/s0165-4608(99)00203-4. [DOI] [PubMed] [Google Scholar]
- 24.Park JP, Ornvold KT, Brown AM, Mohandas TK. Trisomy 2 and 19, and tetrasomy 1q and 14 in hepatoblastoma. Cancer Genet Cytogenet. 1999;115:86–7. doi: 10.1016/s0165-4608(99)00092-8. [DOI] [PubMed] [Google Scholar]
- 25.Adesina AM, Nguyen Y, Guanaratne P, et al. FoxG1 is overexpressed in hepatoblastoma. Hum Pathol. 2007;38:400–9. doi: 10.1016/j.humpath.2006.09.003. [DOI] [PubMed] [Google Scholar]
- 26.Suzuki M, Kato M, Yuyan C, et al. Whole-genome profiling of chromosomal aberrations in hepatoblastoma using high-density single-nucleotide polymorphism genotyping microarrays. Cancer Sci. 2008;99:564–70. doi: 10.1111/j.1349-7006.2007.00710.x. [DOI] [PMC free article] [PubMed] [Google Scholar]
- 27.Kumon K, Kobayashi H, Namiki T, et al. Frequent increase of DNA copy number in the 2q24 chromosomal region and its association with a poor clinical outcome in hepatoblastoma: cytogenetic and comparative genomic hybridization analysis. Jpn J Cancer Res. 2001;92:854–62. doi: 10.1111/j.1349-7006.2001.tb01172.x. [DOI] [PMC free article] [PubMed] [Google Scholar]
- 28.Schneider NR, Cooley LD, Finegold MJ, Douglas EC, Tomlinson GE. The first recurring chromosome translocation in hepatoblastoma: der (4)t(1;4)(q12;q34) Genes Chromosome Cancer. 1997;19:291–4. doi: 10.1002/(sici)1098-2264(199708)19:4<291::aid-gcc13>3.0.co;2-j. [DOI] [PubMed] [Google Scholar]
- 29.Tomlinson GE, Douglass EC, Pollock BH, Finegold MJ, Schneider NR. Cytogenetic evaluation of a large series of hepatoblastomas: numerical abnormalities with recurring aberrations involving 1q12–q21. Genes Chromosomes Cancer. 2005;44:177–84. doi: 10.1002/gcc.20227. [DOI] [PubMed] [Google Scholar]
- 30.Parada LA, Bardi G, Hallen M, et al. Cytogenetic abnormalities and clonal evolution in an adult hepatoblastoma. Am J Surg Pathol. 1997;21:1381–6. doi: 10.1097/00000478-199711000-00015. [DOI] [PubMed] [Google Scholar]
- 31.Nagata T, Mugishima H, Shichino H, et al. Karyotypic analyses of hepatoblastoma. Report of two cases and review of the literature suggesting chromosomal loci responsible for the pathogenesis of this disease. Cancer Genet Cytogenet. 1999;114:42–50. doi: 10.1016/s0165-4608(99)00033-3. [DOI] [PubMed] [Google Scholar]
- 32.Parada LA, Limon J, Iliszko M, et al. Cytogenetics of hepatoblastoma: further characterization of 1q rearrangements by fluorescence in situ hybridization: an international collaborative study. Med Pediatr Oncol. 2000;34:165–70. doi: 10.1002/(sici)1096-911x(200003)34:3<165::aid-mpo1>3.0.co;2-t. [DOI] [PubMed] [Google Scholar]


