Abstract
We conducted a study to determine the effect of different doses of a lutein supplement on serum lutein concentration and macular pigment optical density (MPOD). Lutein is one of the major components of human macular pigment. Eighty seven subjects received daily doses of 5, 10, or 20 mg of lutein, or a placebo, over a 140 day period. Serum lutein concentration was determined by HPLC, and MPOD by heterochromatic flicker photometry (HFP). Serum lutein responded positively, except in the placebo group, reaching a plateau that, averaged for each dosage group, was linearly dependent on dose. Likewise MPOD, on average, increased at a rate that varied linearly with dose. For subjects deemed more proficient at HFP, approximately 29% of the variability in MPOD response could be attributed to a linear dependence on the fractional change in serum lutein concentration. We did not detect any significant influence of age on serum lutein uptake or MPOD response.
Keywords: lutein, macular pigment, carotenoids, heterochromatic flicker photometry, supplementation, AMD
Introduction
Lutein, commercially obtained from diesters extracted from marigolds (Tagetes erecta), is marketed as a dietary supplement either as a natural mixture of diesters or in a free, unesterified form. Such supplements comprise the bulk of the macular carotenoid supplement market and are advertised to promote healthy eyes. While health claims for lutein have yet to be approved, there is a substantial body of scientific evidence that they are justified, particularly in relation to age-related macular degeneration (AMD)1. Epidemiological studies have been somewhat equivocal with regard to the benefits of a diet rich in the two major macular carotenoids, lutein and zeaxanthin; however, several large studies give credence to the proposal that they are protective against this disease [1-3]. Importantly, a mechanism of the proposed protection is understood from a theoretical standpoint that has been repeatedly validated through experimental investigation. In brief, protection of photoreceptor outer segments and the retinal pigment epithelium may occur via either or both of two functions of the macular pigment: screening these susceptible retinal structures from actinic blue light and quenching reactive oxygen species (ROS) [4]. Such quenching by lutein and zeaxanthin has been shown to be predominantly physical, rather than chemical, with excess energy being dissipated harmlessly as thermal energy [5, 6]. This may be the explanation for why there appears to be a very slow turnover of macular pigment in the retina as indicated by the maintenance of elevated macular pigment levels for long periods following supplementation with either lutein or zeaxanthin [7, 8].
As is commonly the case with unregulated dietary supplements, there is no consensus on what constitutes an appropriate daily dose. Lutein is incorporated into some supplements at the 250 μg level, and in others at 6, 10, 20, or even 100 mg levels (~ 0.004 to 1.5 mg per kg bodyweight). In our experience, a 30 mg dose can produce a small, but noticeable change in skin tone, particularly in the palms, and secretion of lutein with skin oil from the sebaceous glands. On the other hand, toxicology studies have failed to indicate a health risk even when lutein is consumed at the much higher doses (4, 40 and 400 mg/kg bodyweight) [9]. Some guidance on the establishment of an appropriate daily dose can be gleaned from epidemiological studies. The Eye Disease Case-Control Study Group reported a reduction in risk of exudative neovascular AMD by 43% when comparing subjects consuming ~ 6 mg of lutein and zeaxanthin per day with those consuming ~ 0.5 mg per day. The Age-Related Eye Disease Study Group (AREDS) reported similar reductions - 35% for neovascular AMD, 55% for geographic atrophy, and 27% for subjects with large or extensive intermediate drusen – in a comparison of subjects consuming ~ 3.5 mg/day with those consuming ~ 0.7 mg/day of lutein and zeaxanthin. We may speculate on whether risk reduction for AMD would be greater for subjects with higher daily intakes than the 6 and 3.5 mg values (highest quintiles) reported in these two studies. An affirmative would certainly be expected to depend upon whether macular pigment levels are demonstrably different for individuals consuming lutein and zeaxanthin at these doses.
The purpose of the present study, which was double-blind and placebo-controlled, was to examine the influence of different daily doses of lutein on serum lutein concentration and rate of increase in macular pigment optical density (MPOD) over the course of a 6 month supplementation period. MPOD was measured by a self-administered test involving heterochromatic flicker photometry [10]. We have come to recognize that different subjects tend to exhibit different levels of proficiency in performing this test. A reasonable hypothesis is that any correlations involving the results from this test might have a greater statistical significance for those who demonstrate higher proficiency levels in contrast to those with lower proficiency levels. Therefore we have analyzed the influence that subject proficiency had upon the statistical significance of the study outcomes. In a subsidiary study, we examined the influence of age on the MPOD and serum lutein responses for those subjects taking the highest lutein dose (20 mg/day).
Methods
Supplements
Commercial lutein extracted from Tagetes erecta is typically comprised of 95% lutein and 5% zeaxanthin. Supplements used in this study contained lutein diesters from Tagetes erecta encapsulated together with a small amount of vegetable oil in soft-shell gelatin capsules. They were provided, specifically for this project, by Cognis-US Corporation. Each capsule provided the equivalent 5, 10 or 20 mg of free, unesterified lutein. Identical looking capsules containing only vegetable oil were used as a placebo. Subjects were instructed to take one capsule per day with a meal for a period of 140 days but otherwise to follow their normal diet. While their diet was not monitored in this study, it may be noted that there is little, if any, seasonal variation in the availability of lutein- and zeaxanthin-containing fruits and vegetables in south Florida, where the study took place.
Subjects
One hundred subjects, consisting of 52 males and 48 females, were recruited from the students and staff at Florida International University. The study was approved by the University's Institutional Review Board (IRB) and conformed to the tenets of the Declaration of Helsinki. Subjects who were accepted into the study signed an informed consent form approved by the IRB. Inclusion criteria included good health and the ability to perform heterochromatic flicker photometry (for MPOD determination). Exclusion criteria included being a smoker or having been a smoker within the previous 12 months, being pregnant, or taking a supplement containing a significant amount (> 0.25 mg) of lutein or zeaxanthin or a self-reported, abnormal digestive condition, including the consumption of statin prescription drugs.
Serum analysis
Blood samples were obtained from the subjects prior to supplementation and at ~ intervals throughout the supplementation period. Serum concentrations of lutein were obtained by HPLC according to a method described in detail elsewhere [11]. Briefly, monohexyl lutein was added to each serum sample as an internal standard. HPLC was conducted with a 250 × 4.6 mm Ultracarb ODS 3μm reversed-phase column (Phenomenex) and a mobile phase of acetonitrile/methanol (85:15) at 1 mL/min.
MPOD measurements
MPOD was obtained for the left and right eyes of each subject prior to supplementation and once or twice per week, depending on subject availability, throughout the supplementation period. The procedure for measuring MPOD was the well established method of heterochromatic flicker photometry (HFP). In the version of HFP used in this study, the subject viewed a small, circular stimulus (1.5° diameter) that alternated between 460 (blue) and 540 nm (green). The shorter, but not the longer, of these two wavelengths is absorbed by the macular pigment resulting, generally, in a flickering appearance of the stimulus due to mismatched luminances. The subject altered the luminance of the 460 nm (blue) light until, at equiluminance, flicker stopped or was minimized. The subject's setting reflected the amount of attenuation of the blue light, principally by the macular pigment but also, and increasingly with age, by the lens. A second measurement in which the stimulus was imaged parafoveally at 8° eccentricity, thereby avoiding the macular pigment, allowed the lens contribution to be eliminated. MPOD at a wavelength of 460 nm was obtained from these measurements and represented the value at an eccentricity of ~ 50% of the stimulus radius, i.e. at ~ 0.38° from the center of the fovea [12]. Subjects made 5 repeat measurements for each part of the test, and the test was deemed acceptable if the standard error in the mean MPOD was less than 0.020 absorbance units (AU). Importantly, this was a self-administered test involving little intervention by a technician/operator and was therefore dependent for its success on subject proficiency, dedication, and the ability to maintain objectivity in determining the flicker null point.
Statistical analysis
Potential linear correlations were investigated by calculating the Pearson's linear correlation coefficient, R, and testing for significance with a t-test. Correlations with p < 0.05 were considered significant. Differences, for example between serum lutein responses of older and younger subjects, were explored with an independent samples t-test (α = 2) and, again, values of p < 0.05 were considered significant.
Results
The demographics of the subjects in each dose category are shown in Table 1. Of the 100 subjects who were recruited into the study, 87 successfully completed the entire 140 day study. For the main dose-comparison part of the study, subjects were reasonably age-matched (Table 1, first 4 rows) being drawn largely from the student population. Gender makeup was less well balanced. In order to evaluate age effects on serum lutein uptake and MPOD response, additional subjects over the age of 50 years were recruited into a separate 20 mg per day group (Table 1, last row) for comparison with the 20 mg group in the main study. The age range for the younger group was 18 to 30 years while for the older group it was 51 to 64 years.
Table 1.
Subject demographics. The last row in the table, group 5, represents subjects over 50 years of age recruited into the subsidiary study to evaluate age effects on serum lutein and MPOD responses.
| Group | Dose | Number recruited |
Subjects who completed study | ||
|---|---|---|---|---|---|
| Number | Male/female | Age ± SD (yrs) | |||
| 1 | 0 mg (plac) | 10 | 10 | 6/4 | 22.3 ± 3.4 |
| 2 | 5 mg | 25 | 17 | 8/9 | 23.7 ± 5.9 |
| 3 | 10 mg | 25 | 22 | 15/7 | 24.2 ± 7.9 |
| 4 | 20 mg | 25 | 24 | 14/10 | 24.3 ± 3.6 |
| 5 | 20 mg | 15 | 14 | 5/9 | 56.0 ± 4.1 |
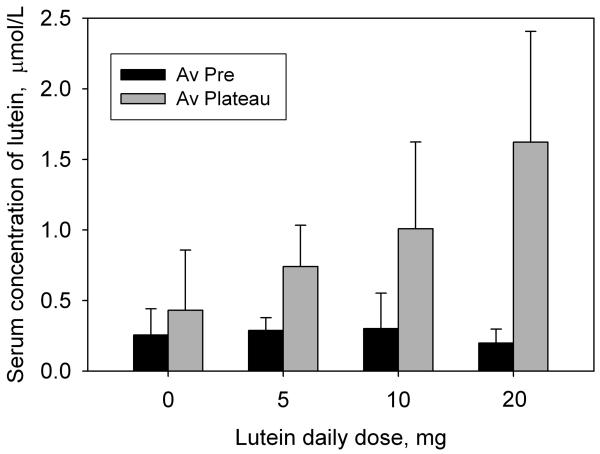
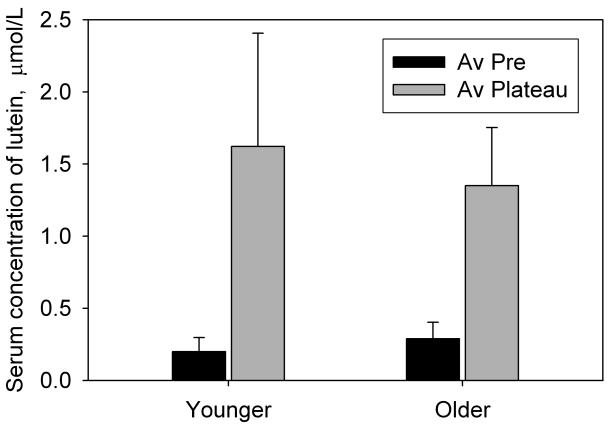
As a result of supplementation, the subjects' serum lutein concentration generally increased during the first 2 to 3 weeks of supplementation to a plateau where it remained, with fluctuations, until the end of the supplementation period. This pattern is typical of lutein or zeaxanthin supplementation studies [7, 8, 13-15]. An average plateau value was obtained from the data for each subject for comparison with the pre-supplementation value. The changes in serum lutein concentration for non-placebo subjects were all positive and ranged from 0.16 to 3.71 μmol/L (fold increases of 1.82× to 30.00×). Thus there were no non-responders. The average results for the age-matched subjects in groups 1 through 4 (Table 1) are presented in Fig. 1 and Table 2. For the placebo group (group 1), the change in serum lutein concentration was insignificant (p = 0.20) whereas for the 5, 10 and 20 mg groups (groups 2, 3 and 4), there was a significant increase (p < 0.0001 for all groups) that was clearly dose-dependent. The increases were 2.57×, 3.35×, and 8.15× for the 5, 10, and 20 mg groups respectively. For the 20 mg dose (groups 4 and 5) we also compared the serum lutein concentrations of the younger and older subjects. As shown in Fig. 2 and Table 2, serum lutein concentration rose from average pre-supplementation values of 0.199 ± 0.099 μmol/L (younger) and 0.289 ± 0.114 μmol/L (older) to average plateau values of 1.621 ± 0.785 μmol/L (younger) and 1.350 ± 0.403 μmol/L (older). This corresponds to fold increases of 4.68× for the older subjects compared with 8.15× for the younger subjects. According to a 2-sided t-test, groups 4 and 5 were significantly different prior to supplementation (p = 0.012) but the difference became insignificant once the serum lutein had reached the plateau (p = 0.23). The differences in the increase in serum lutein (pre to plateau) between the two groups were also insignificant (p = 0.10).
Fig. 1.
The effect of different lutein doses on the concentration of lutein in the serum. The black bars represent the concentrations of serum lutein prior to supplementation, averaged for all subjects. The gray bars represent the average concentrations of serum lutein after these had reached a steady-state plateau, again averaged for all subjects. Standard deviations are represented by the error bars.
Table 2.
Serum lutein concentrations for the different groups (see Table 1) prior to lutein supplementation (column 3) and the average plateau values during supplementation (column 4).
| Group | Dose mg |
Pre-supp av ± SD μmol/L |
Plateau av ± SD μmol/L |
|---|---|---|---|
| 1 | 0 (plac) | 0.255 ± 0.185 | 0.431 ± 0.426 |
| 2 | 5 | 0.289 ±0.092 | 0.741 ± 0.292 |
| 3 | 10 | 0.301 ± 0.252 | 1.009 ± 0.614 |
| 4 | 20 | 0.199 ± 0.099 | 1.621 ± 0.785 |
| 5 | 20 | 0.289 ± 0.114 | 1.350 ± 0.403 |
Fig. 2.
The effect of age on serum lutein concentration. The black bars represent the concentrations of serum lutein prior to supplementation, averaged for 24 younger subjects, ages 18 to 29 years (group 4) and 14 older subjects, ages 51 to 64 (group 5). The gray bars represent the average concentrations of serum lutein after these had reached a steady-state plateau, again averaged for each of the two groups. Standard deviations are represented by the error bars.
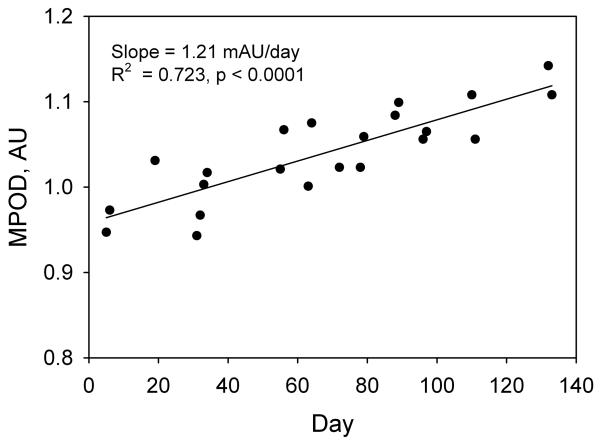
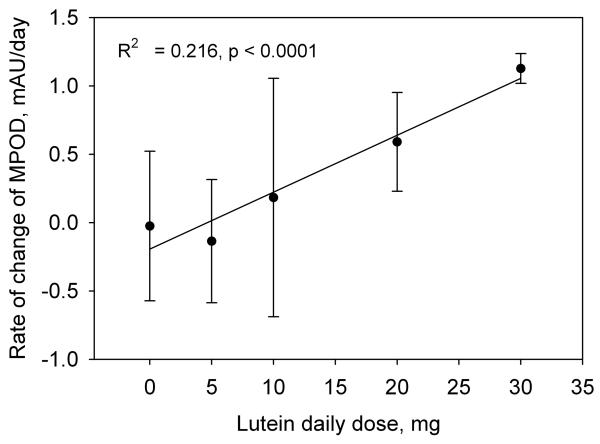
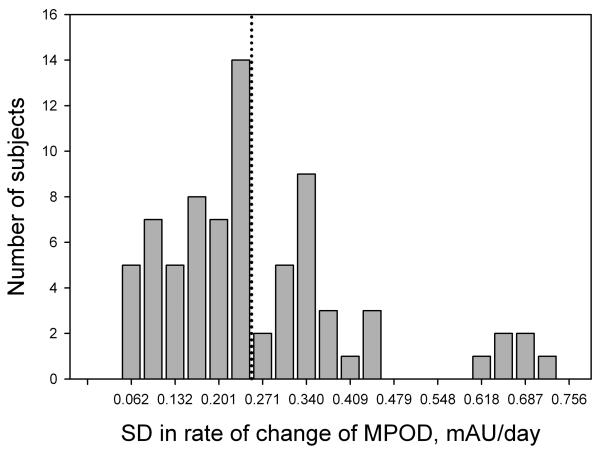
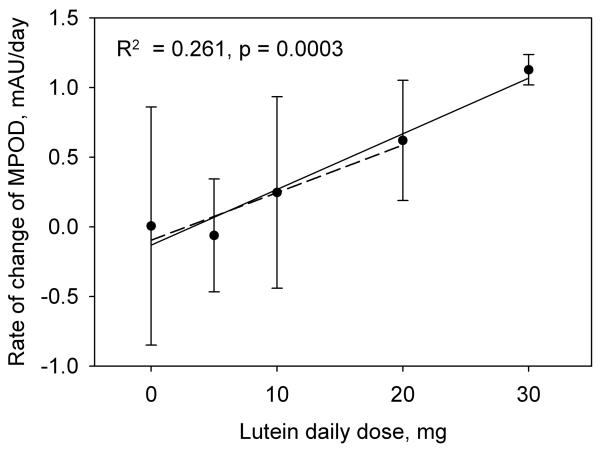
In lutein supplementation studies involving subjects proficient in HFP, MPOD tends to exhibit a markedly linear increase with time [8] This trend is shown in Fig. 3 for a subject in the 10 mg/day group. The rate of increase in MPOD with time during supplementation, i.e. the slope of this graph together with the uncertainty in the slope, was therefore chosen as a meaningful indicator of a subject's response to the lutein supplement. The results for subjects in groups 1 through 4, in which we averaged the data from both eyes, are summarized in Fig. 4 which shows the average rates of increase in MPOD for the 73 subjects in the different dosage groups. For comparison, we have included the average results from a previous study obtained when two of our subjects were supplemented with 30 mg/day of equivalent free lutein as lutein esters in vegetable oil over a similar time period [8]. Regression analysis revealed a linear dependence of the rate of increase in MPOD on lutein dose (R2 = 0.216, p < 0.0001). We considered the possibility that subject proficiency in HFP might have a significant influence on this result. We took as a measure of subject proficiency the standard error in the slope of the subject's graph of MPOD versus time (see Fig. 3). This choice was founded on the observation that, in practice sessions involving repeated tests over a short period of time, proficient subjects were able to obtain sets of MPOD values with very little variation. For example, one highly proficient subject produced consecutive MPOD values (± SEM) over a ~ 15 minute period of 0.849 ± 0.017, 0.829 ± 0.009, 0.842 ± 0.007, 0.829 ± 0.015, and 0.848 ± 0.012. On the other hand, unpracticed subjects generally displayed considerably more variation. The standard errors in the slopes for all subjects in groups 1 through 4 are displayed as a histogram in Fig. 5. We arbitrarily selected the 46 subjects (63% of the total) whose standard errors were less than 0.25 mAU/day (milli-absorbance units per day), approximately one third of the maximum value. The average rates of increase in MPOD for the different dosage groups, based on these 46 subjects, are shown in Fig. 6. Even with the smaller number of subjects, linear correlation was modestly improved (R2 = 0.261, p = 0.0003).
Fig. 3.
MPOD measurements obtained throughout the lutein supplementation period from a single subject in the 10 mg/day group.
Fig. 4.
The rate of change of MPOD, i.e. the slope of graphs such as Fig.3, averaged for the subjects in each of the dosage groups 1 through 4. Also included are data obtained from our earlier study involving a 30 mg/day lutein dose [8]. Standard deviations are represented by the error bars.
Fig. 5.
Histogram of the standard deviations in the rates of change of MPOD for all subjects in dosage groups 1 through 4. Forty six subjects whose standard deviations were less than 0.250 (those in bins to the left of the dotted line) were selected for additional analysis.
Fig. 6.
The rate of change of MPOD averaged for the subjects in each of the dosage groups 1 through 4 whose standard deviations in the rates of change of MPOD were less than 0.250. The error bars represent standard deviations for the different dosage groups. The solid regression line and associated data (R2 = 0.261, p < 0.0003) were obtained after including data from our earlier study involving a 30 mg/day lutein dose [8]. For comparison, the dashed regression line excludes the 30 mg/day data.
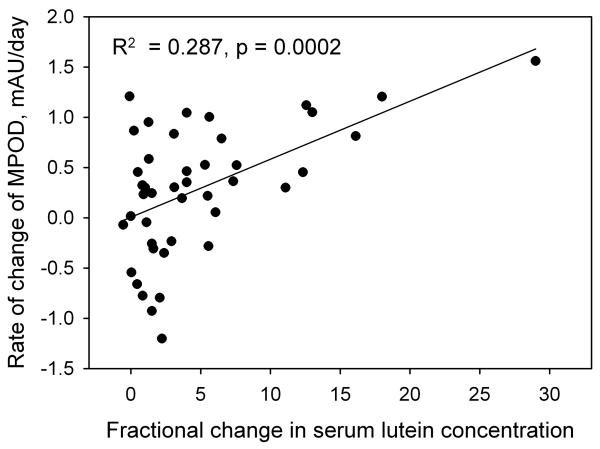
We also examined the influence of blood serum lutein concentration on the rate of increase in MPOD in the younger subjects (groups 1 through 4) without regard to lutein dose. The strongest correlation was again for the 46 most proficient subjects, and was between the rate of increase in MPOD and the fractional change in the concentration of lutein in a subject's serum (R2 = 0.287, p = 0.0002). See Fig. 7. The correlation was considerably weaker when all of the subjects were included in the analysis (R2 = 0.151, p = 0.0009). The correlation was also much weaker when the independent variable was either the absolute change in the serum lutein concentration (R2 = 0.138, p = 0.013, 46 subjects) or the plateau level of serum lutein concentration (R2 = 0.124, p = 0.019, 46 subjects). For the older subjects (group 5), there was no correlation between the rate of increase in MPOD and the percentage change in serum lutein when analyzing all subjects (R2 = 0.0018, p = 0.88). When we applied the same restriction that we had used with the younger subjects (SD < 0.25 mAU/day), the remaining 8 subjects exhibited a positive correlation (R2 = 0.282, p = 0.18) which was nearly identical to that of the younger group but did not reach statistical significance.
Fig. 7.
The rate of change of MPOD as a function of the fractional change in serum lutein concentration (plateau value minus pre-supplementation value, divided by the pre-supplementation value). These data are for the 46 subjects in groups 1 through 4 whose standard deviations in the rates of change of MPOD were less than 0.250.
The potential effects of age on MPOD responses were examined using data obtained from the younger and older subjects taking 20 mg of lutein per day (groups 4 and 5). The average ± SD rate of increase in MPOD for the under 30 year old group (group 4) was 0.591 ± 0.362 mAU/day, and for the over 50 year old group (group 5), it was 0.132 ± 0.532 mAU/day. These results were significantly different (p = 0.0029). Upon selection of the more proficient subjects from groups 4 and 5 (SD < 0.25 mAU/day), the rates of increase in MPOD were 0.621 ± 0.432 mAU/day (group 4) and 0.307 ± 0.186 mAU/day (group 5) but the difference between them did not quite reach statistical significance (p = 0.071).
Discussion
The results of this study show that by means of supplementation of a subject's diet with esterified lutein, serum levels of lutein and MPOD levels generally become elevated in a dose-dependent manner; the larger the daily dose, the greater the elevation. The results also underline the importance of selectivity during recruitment of study participants, with particular emphasis on their potential ability to perform HFP with consistency and reliability throughout the supplementation period. We have found that some general familiarity with scientific instruments appears to be associated with higher proficiency in HFP. Thus we have found it beneficial to recruit subjects from the University community who have been enrolled as students in laboratory courses. However, part of the proficiency problem may be specific to our HFP protocol and not related to subject skill. The instrument employed fixed frequencies of 30 Hz and 20 Hz for the foveal and parafoveal measurements respectively, these having been found to provide reasonably sharply defined null points in the majority of subjects. For some subjects, these frequencies may be too high resulting in a range of blue light intensities over which flicker ceases. For others, the frequencies may be too low making it impossible to completely eliminate flicker. In retrospect, customizing the flicker frequencies on an individual basis, as described elsewhere [16, 17], could alleviate this problem and lead to higher level of proficiency. Notwithstanding, discussion of MPOD results in the present study will be restricted to those obtained from the more proficient subjects as defined above.
Serum analysis
The bar chart in Fig. 1 indicates very clearly that during lutein supplementation the steady-state value of a subject's serum lutein concentration increases with dose, at least for the dose range of 0 to 20 mg per day. The correlation between the steady-state value and dose for the subjects was found to be reasonably linear (R2 = 0.32, p < 0.0001) though less so than was observed in a previous study [7]. The fold increases in serum lutein that we determined in this study mesh well with results from our previous study in which subjects consumed 30 mg of esterified lutein per day [8]. In that study, the average fold increase was 15×, compared with 1.69×, 2.57×, 3.35×, and 8.15× for the 0, 5, 10, and 20 mg groups respectively, in the present study. The correlation between these group-average fold increases and dose was very strong (R2 = 0.94, p < 0.01). These results, and the fact that serum lutein concentration always reached a plateau, are consistent with straightforward kinetics of lutein transport. We may reasonably assume that the rate of uptake of lutein into the serum is proportional to, or at least positively associated with, the concentration of lutein in the micelles within the gut which, in turn, is dependant on the lutein dose. At the same time, lutein is being transferred out of the blood through excretion or through uptake by tissues such as the adipose, liver, brain or eye, at a rate which is positively associated with the serum concentration of lutein. When the serum lutein level reaches a plateau during supplementation, the rates of elimination from the serum and uptake into the serum must be equal. With a larger dose, the rate of transfer into the serum increases and the rate of elimination must also increase to achieve a balance, resulting in a new, higher plateau level.
Given the high correlation between group-average fold increases in serum lutein and dose, we have compared our results with those of similar studies in which serum lutein concentration reached a steady-state plateau, but which were not necessarily of the same overall duration. Thus Thürmann et al. [15] achieved a 3.5× increase with 4.1 mg/day (cf. 2.75× with 5 mg/day in the present study). For 10mg/day, Schalch et al. [13] reported a 6.9× increase and Berendschot et al. [14] reported a 5.0× increase, and for 12 mg/day, Trieschmann et al. [18] reported a 3.75× increase (cf. 3.35× with 10 mg/day in the present study). With 20 mg/day, Duncan et al. [19] reported 2.75× to 3.00× increases, Aleman et al. [20] reported ~ 4× increases, and Thürmann et al. [15] reported ~ 10× increase (cf. 8.15× with 20 mg/day in the present study). Bearing in mind that inter-individual variability in lutein response tends to be quite large, and that these studies often involved small numbers of subjects, our results are consistent with those previously reported.
MPOD analysis
The average rates of increase in MPOD for the different dosage groups (groups 1 through 4, and the 30 mg/day data from the earlier study) follow a clear linear trend (Figs. 4 and 6). The 10 and 20 mg/day results are quite consistent with those of some earlier studies for which we have estimated the average rates of increase in MPOD. These estimates were calculated from published baseline MPODs and percentage changes in MPOD, or baseline and post supplementation MPODs, together with the length of the supplementation period. In all cases, we have made use of MPODs reported at 0.5° eccentricity with a reference location varying by study in the range 5° to 10°. Thus with 10 mg/day, Schalch et al. [13] and Stringham et al. [21], using HFP, obtained rates of increase of 0.350 and 0.877 mAU/day, respectively, compared with our own lower value of 0.247 mAU/day. With a similar dose (12 mg/day), Trieschmann et al. [18] obtained 0.548 mAU/day using 2-wavelength autofluorescence. On the other hand, our 20 mg/day result (0.621 mAU/day) was higher than values derived from the data of Aleman et al. [20] (0.055 to 0.384 mAU/day) and Duncan et al. [19] (0.384 mAU/day), both of whom used HFP. As with serum lutein responses, inter-individual variability in MPOD responses and small sample sizes are the probable causes for the differences seen in these studies. The large error bars in Figs. 4 and 6 are indicative of this variability that was influenced in a significant number of subjects by an apparent decrease rather than an increase in MPOD. For the 46 more proficient subjects, a decrease in MPOD was observed in the 0 mg/day group (2 subjects), the 5 mg/ day group (6 subjects), and the10 mg/day group (5 subjects), but not in the 20 or 30 mg/day groups. Such decreases may either be real, foveal decreases, or they may result from a greater increase of lutein in the parafovea relative to the fovea for the 5 and 10 mg/day groups. (Recall that HFP measures the MPOD in the fovea relative to the MPOD in the parafovea.) Lutein is known to be the more dominant carotenoid at the parafoveal location employed in our HFP test [22]. Schalch et al. [13] found a substantial parafoveal increase in MPOD as a result of supplementation with zeaxanthin, resulting in an apparent increase in foveal MPOD of only 3%. By comparison, lutein, as well as a combination of lutein and zeaxanthin, produced a foveal increase of 15% with no indication of a parafoveal increase. In the present study, it would be inappropriate to draw any conclusions from an examination of the parafoveal data. Lamp replacement was a fairly frequent occurrence – the quartz-halogen lamp that we used had a rated lifetime of only 50 hours – and new and old lamps have slightly different spectral characteristics. Such differences could have affected the foveal and parafoveal settings that a subject made throughout the supplementation period, but not the MPOD derived from those settings.
In this study, ~ 29% of the variability in MPOD response can be attributed to a linear dependence on the fractional change of lutein concentration in the serum, but only ~ 14% could be attributed to the absolute change in serum lutein concentration, and ~ 12% to the plateau concentration of serum lutein. This latter result is in contrast to an earlier study [7] where a figure of 67% was reported, but that study involved a relatively small number of subjects. In retrospect, a correlation between the fractional change in serum lutein concentration (defined as the change, plateau value minus pre-supplementation value, divided by the pre-supplementation value) and the rate of increase in MPOD is more easily rationalized than a correlation involving either the absolute change in serum lutein, or the plateau concentration of lutein. A person may have a high pre-supplementation level of serum lutein that is in equilibrium with the MPOD. A small change in such a person's serum lutein would result in an even higher plateau level, but would not be expected to upset the equilibrium with MPOD to any great extent and therefore would not produce a large change in the MPOD. Likewise an absolute change in serum lutein of some specified amount would be expected to upset the equilibrium with MPOD to a greater extent if that person's pre-supplementation level of serum lutein was low. On the other hand, a large fractional increase in serum lutein might be expected to have a substantial effect on the equilibrium between serum lutein and MPOD resulting in a large increase in MPOD.
The fact that most of the variability in MPOD response cannot be attributed to serum lutein concentration would suggest that incorporation of lutein into the retinal tissue is not driven simply by diffusion. Additionally, the specific selection of lutein and zeaxanthin for incorporation in the retina and other ocular tissues [23], from among ~ 15 carotenoids circulating in the serum, points to the involvement of a highly selective transport protein. Thus we can conjecture that differences in the availability of such a protein would be another factor affecting the uptake of lutein and zeaxanthin into the eye. The recent discovery of a lutein binding protein in the human retina lends credence to this idea [24].
MPOD responses of the younger and older subjects taking the 20 mg/day dose (groups 4 and 5) were not statistically different. However, the lower average response (0.307 ± 0.186 mAU/day) of the younger subjects in comparison with the older subjects (0.621 ± 0.432 mAU/day) would justify further investigation into this difference using larger numbers of subjects.
In conclusion, we have shown that while each subject had a positive serum response to lutein supplementation, this did not always translate into a positive MPOD response. On average, however, serum lutein response and MPOD response were linearly correlated with lutein dose.
Acknowledgements
Support provided by NIH GM08205. The authors thank Cognis-US Corporation, Chicago, IL for the lutein and placebo used in this study.
Footnotes
Publisher's Disclaimer: This is a PDF file of an unedited manuscript that has been accepted for publication. As a service to our customers we are providing this early version of the manuscript. The manuscript will undergo copyediting, typesetting, and review of the resulting proof before it is published in its final citable form. Please note that during the production process errors may be discovered which could affect the content, and all legal disclaimers that apply to the journal pertain.
Abbreviations: MPOD, macular pigment optical density; HFP, heterochromatic flicker photometry; AMD, age-related macular degeneration
References
- 1.Eye Disease Case-Control Study Group Arch. Ophthalmol. 1993;111:104–109. doi: 10.1001/archopht.1993.01090010108035. [DOI] [PubMed] [Google Scholar]
- 2.SanGiovanni J, Chew E, Clemons T, Ferris F, Gensler G, Lindblad A, Milton R, Seddon J, Sperduto R. Arch. Ophthalmol. 2007;125:1225–1232. doi: 10.1001/archopht.125.9.1225. [DOI] [PubMed] [Google Scholar]
- 3.Seddon JM, Ajani UA, Sperduto RD, Hiller R, Blair N, Burton TC, Farber MD, Gragoudas ES, Haller J, Miller DT, Yannuzzi LA, Willett WC. JAMA. 1994;272:1413–1420. [PubMed] [Google Scholar]
- 4.Beatty S, Koh HH, Phil M, Henson DB, Boulton M. Surv. Ophthalmol. 2000;45:115–134. doi: 10.1016/s0039-6257(00)00140-5. [DOI] [PubMed] [Google Scholar]
- 5.Sparrow J, Kim S. In: Carotenoids: physical, chemical, and biological functions and properties. Landrum J, editor. Taylor and Francis Group; Boca Raton: 2010. pp. 355–363. [Google Scholar]
- 6.Stahl W, Sies H. Mol. Aspect Med. 2003;24:345–351. doi: 10.1016/s0098-2997(03)00030-x. [DOI] [PubMed] [Google Scholar]
- 7.Bone RA, Landrum JT, Guerra L, Ruiz CA. J. Nutr. 2003;133:992–998. doi: 10.1093/jn/133.4.992. H. [DOI] [PubMed] [Google Scholar]
- 8.Landrum JT, Bone RA, Joa H, Kilburn MD, Moore LL, Sprague KE. Exp. Eye Res. 1997;65:57–62. doi: 10.1006/exer.1997.0309. [DOI] [PubMed] [Google Scholar]
- 9.Harikumar K, Nimita C, Preethi K, Kuttan R, Shankaranarayana M, Deshpande J. Int. J. Toxicol. 2008;27:1–9. doi: 10.1080/10915810701876265. [DOI] [PubMed] [Google Scholar]
- 10.Bone RA, Landrum JT. Arch. Biochem. Biophys. 2004;430:137–142. doi: 10.1016/j.abb.2004.04.003. [DOI] [PubMed] [Google Scholar]
- 11.Bone RA, Landrum JT, Dixon Z, Chen Y, Llerena CM. Exp. Eye Res. 2000;71:239–245. doi: 10.1006/exer.2000.0870. [DOI] [PubMed] [Google Scholar]
- 12.Bone RA, Landrum JT, Gibert JC. Vis. Res. 2004;44:3045–3051. doi: 10.1016/j.visres.2004.07.008. [DOI] [PubMed] [Google Scholar]
- 13.Schalch W, Cohn W, Barker FM, Köpcke W, Mellerio J, Bird AC, Robson AG, Fitzke FF, Van Kuijk FJGM. Arch. Biochem. Biophys. 2007;458:128–135. doi: 10.1016/j.abb.2006.09.032. [DOI] [PubMed] [Google Scholar]
- 14.Berendschot TTJM, Goldbohm RA, Klöpping WAA, van de Kraats J, van Norel J, van Norren D. Invest. Ophthalmol. Vis. Sci. 2000;41:3322–3326. [PubMed] [Google Scholar]
- 15.Thürmann P, Schalch W, Aebischer J-C, Tenter U, Cohn W. Am. J. Clin Nutr. 2005;82:88–97. doi: 10.1093/ajcn.82.1.88. [DOI] [PubMed] [Google Scholar]
- 16.Bone RA, Sparrock JMB. Vis. Res. 1971;11:1057–1064. doi: 10.1016/0042-6989(71)90112-x. [DOI] [PubMed] [Google Scholar]
- 17.Stringham J, Hammond B, Nolan J, Wooten B, Mammen A, Smollon W, Snodderly D. Exp. Eye Res. 2008;87:445–453. doi: 10.1016/j.exer.2008.08.005. [DOI] [PubMed] [Google Scholar]
- 18.Trieschmann M, Beatty S, Nolan J, Hense H, Heimes B, Austermann U, Fobker M, Pauleikhoff D. Exp. Eye Res. 2007;84:718–728. doi: 10.1016/j.exer.2006.12.010. [DOI] [PubMed] [Google Scholar]
- 19.Duncan JL, Aleman TS, Gardner LM, De Castro E, Marks DA, Emmons JM, Bieber ML, Steinberg JD, Bennett J, Stone EM, Macdonald IM, Cideciyan AV, Maguire MG, Jacobson SG. Exp. Eye Res. 2002;74:371–381. doi: 10.1006/exer.2001.1126. [DOI] [PubMed] [Google Scholar]
- 20.Aleman T, Duncan J, Bieber M, de Castro E, Marks D, Gardner L, Steinberg J, Cideciyan A, Maguire M, Jacobson S. Invest. Ophthalmol. Vis. Sci. 2001;42:1873–1887. [PubMed] [Google Scholar]
- 21.Stringham J, Hammond B. Opt. Vis. Sci. 2008;85:82–88. doi: 10.1097/OPX.0b013e318162266e. [DOI] [PubMed] [Google Scholar]
- 22.Bone RA, Landrum JT, Fernandez L, Tarsis SL. Invest. Ophthalmol. Vis. Sci. 1988;29:843–849. [PubMed] [Google Scholar]
- 23.Bernstein P, Khachik F, Carvalho L, Muir G, Zhao D, Katz N. Exp. Eye Res. 2001;72:215–223. doi: 10.1006/exer.2000.0954. [DOI] [PubMed] [Google Scholar]
- 24.Bhosale P, Li B, Sharifzadeh M, Gellermann W, Frederick J, Tsuchida K, Bernstein P. Biochem. 2009;48:4798–4807. doi: 10.1021/bi9004478. [DOI] [PubMed] [Google Scholar]


