Abstract
Background
New tools are needed to examine physical activity and the contexts in which it occurs. Community parks contribute to physical activity, but measuring activity and associated variables in them is challenging because area contexts change and the numbers and characteristics of users are highly variable.
Methods
We developed SOPARC (System for Observing Play and Recreation in Communities) and tested its use by observing 16,244 individuals in 165 park areas. Reliabilities included 472 simultaneous measures by independent observers.
Results
Correlations between observers on number of area participants was 0.99 for female and male park users. Reliabilities (i.e., percent agreement) for age (89%, females; 85%, males), race/ethnic (80%, females; 82%, males), and activity level (80%, females; 88%, males) groupings met acceptable criteria. Reliabilities for area contexts (i.e., usable, accessible, supervised, organized, equipped) exceeded 94%.
Conclusions
SOPARC is a reliable and feasible instrument for assessing physical activity and associated contextual data in community settings.
Keywords: parks, physical activity, measurement, exercise, leisure, minorities
Regular physical activity is an important part of a healthful lifestyle for people of all ages. Many people, especially adults and minority populations, do not meet guidelines for activity levels that have been established.1–3 Because they reach large segments of society, environmental approaches to increasing physical activity and reducing obesity have recently been emphasized,4, 5 but they have not been thoroughly studied.6 Children and adolescents can accrue a portion of their activity in school physical education, recess, and sports,7 but a similar environment is not available to most adults.
Community parks are available in most cities and are potential settings for promoting the physical activity of persons of all ages.8–11 They are typically open to users throughout the day, are less expensive than private facilities, and most have areas designed to support leisure-time physical activity through both structured and unstructured modes. The physical activity of users and the contexts in which they are active in parks, however, has not been examined in detail.12
There are numerous reasons for interest in studying parks and their users.4, 5, 10, 12 Physical activity preferences differ by age, gender, and cultural background, and the movement skills and abilities of park users differ by age and gender. Accessibility to exercise and physical activity facilities is associated with socio-economic status (SES),10, 11 and families with low incomes need to rely primarily on public spaces for recreation and exercise. Health disparities exist between ethnic groups, and particularly prominent are differences in rates of obesity and Type 2 diabetes.3, 13–15 Whether or how much inactivity contributes to these disparities is unknown, but studying physical activity in different age, gender, and ethnic groups is important for eventually reducing related health disparities and solving other equity concerns.11, 13 Having information on park users and the contexts in which they are physically active is also important for park designers and local program planners.
In order to understand the contexts in which physical activity occurs, there is a need to develop and test additional measurement tools. Numerous objective methods have been designed and validated for measuring the physical activity of individuals, including direct observation, heart rate monitors, accelerometers, and doubly labeled water.17 Attempts to assess the physical activity of park users have relied primarily on self-reports by individuals,11, 12, 16, 18 and no validated instruments to assess group physical activity in parks are currently available. This lack of objective tools has hampered investigations of physical activity in “open” environments, such as park, recreation, and leisure settings. Measuring activity in these settings is complicated because both the number of participants and their activity levels change frequently. Because leisure time activity occurs in diverse locations, it is also desirable to assess relevant contextual aspects of settings that might influence physical activity levels.
The present study had two aims. The primary purpose was to develop and assess an objective, contextually-rich, observation system for investigating physical activity and associated variables in community parks (System for Observing Physical Activity and Recreation in Communities—SOPARC). The secondary purpose was to conduct an exploratory study in multi-ethnic communities in order to assess the reliability and feasibility of using SOPARC to examine park areas and investigate the characteristics of users, including their physical activity levels.
Methods
Observation Instrument
SOPARC was designed to obtain observational data on the number of participants and their physical activity levels during physical activity and leisure opportunities in community environments. It also provides contextual information on the setting in which the physical activity occurs. SOPARC uses the same physical activity codes as SOPLAY (System for Observing Play and Leisure in Youth) that was designed specifically to assess physical activity in middle school settings.19 SOPARC improves upon the earlier school version by adapting the protocol to assess the more diverse and open activity environments that are found in communities, and by being able to code participants into perceived ethnicity/race and age group categories. SOPARC is based on momentary time sampling and uses Placheck recording (i.e., Planned Activity Check) that involves group time sampling techniques.20 Placheck has previously been used to examine children’s aggressive behavior on playgrounds21 and the effects of an environmental intervention on activity levels of adolescents before, during, and after school in 24 middle schools.22
During a scan of a target area (i.e., an observation sweep moving from left to right) the physical activity of each individual is coded as sedentary (i.e., lying down, sitting, or standing), walking, or vigorous. These activity codes have been validated by heart rate monitoring of youths from kindergarten through 12th grade23, 24 and by pedometry in physical education classes,25 thus permitting energy expenditure rates to be estimated in certain populations. Separate scans are made for females and males. Simultaneous entries are made for the time of the observation and for contextual characteristics of the target area such as its accessibility (e.g., not locked), usability, and whether or not supervision, organized activities, and equipment are provided. The predominant and secondary types type of activity (e.g., soccer, football) in each area that females and males are engaging are also recorded, using a list of activities from four different categories (i.e., fitness, sport, game, and sedentary activities). Figure 1 presents an abbreviated scoring form. A description of the SOPARC codes and measurement protocol is available from the lead author.
Figure 1.
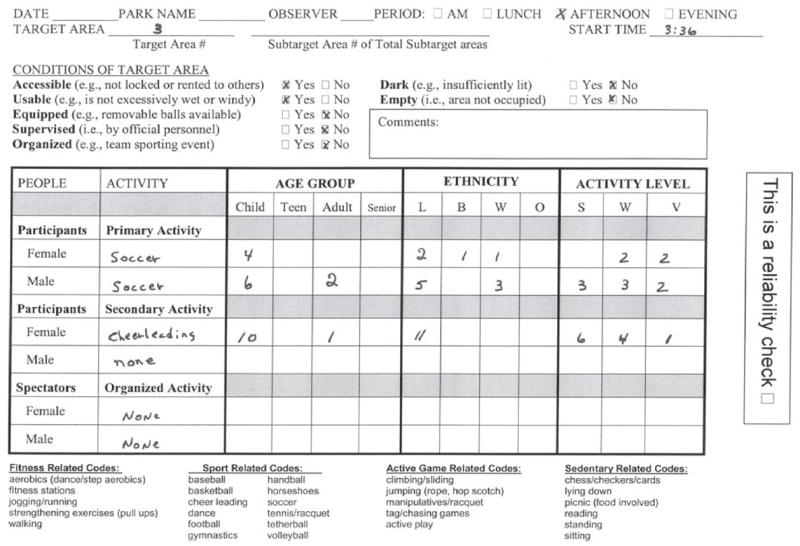
Sample SOPARC coding form
Parks
Data were collected in eight large parks (range = 3.4 to 16.0 acres; mean = 7.8) in Los Angeles, and they were located in urban neighborhoods with high percentage of minorities [Latino (range = 11 to 95%), African American (range = 0 to 88%)] and household poverty (mean = 35%; range = 16 to 55%). From 25,000 to 75,000 people lived within 1 mile of the parks’ street boundaries. Five parks were in predominantly residential neighborhoods, and three were in an area bordered by a commercial boulevard.
Target Areas
All potential areas for leisure time physical activity in each park were visited and measured prior to data collection. The size, location, and boundaries of each space (i.e., target area) were identified, and detailed maps (including where to stand when making an observation) were made. A total of 165 areas were targeted for observation, ranging from 17 to 27 (mean = 20.6) per park. These included grassy play and picnic areas; playgrounds, wading pools, horseshoe pits, and bleachers; baseball/softball diamonds; multi-purpose fields; basketball, handball, tennis, and volleyball courts; indoor gymnasium and multipurpose rooms; gymnastic/fitness areas; and a skate park and a running track. Large areas were subdivided to facilitate recording during observations.
Observation Schedule and Protocol
The RAND human subjects review board approved all data collection procedures. Data were collected in each park during four 1-h observation periods (beginning at 7:30 AM; 12:30 PM, 3:30 PM, and 6:30 PM) during 7 d of clement weather (total = 56 observation days from December until July). Observations were made during each day of the week in each park (i.e., Sunday through Saturday). An observation day missed because of inclement weather or a holiday was rescheduled to take place on the same day during a later week. Target areas in a park were visited in an established order each time period, and each was scheduled for observation a total of 28 times.
During each visit to a target area, one or more observers went to the designated area and completed a coding form (see Figure 1). They first entered the start time for observations in that area and entered codes to describe the current characteristics of that setting, including whether it was accessible, usable, supervised, equipped, and provided an organized activity. Next they completed “SCANS” of the target area that consisted of making independent visual sweeps from left to right while depressing color-coded keys to enter counts into mechanical recorders. Females were observed first (maximum of six scans) and then males (maximum of six scans). Observers entered the primary activity that females were engaged in and then did an observational sweep of the area to simultaneously record each female into a perceived age (child, teen, adult, senior) and ethnic/race (Latino, Black, White, Other) grouping. They transferred these data onto the recording form and then did another observational sweep to record the physical activity level of each female as sedentary, walking, or vigorous. After transferring these Primary Activity data onto the recording form observers completed the sequence for a secondary activity (if any) and for spectators in the area (if any). This procedure (up to a maximum of six sweeps) was then completed for males in that target area. Observers then moved to the next specified spot on the park map to complete observations for the next target area.
Observer Training
Eight certified SOPARC assessors conducted all observations. Their training was initiated during a 1-d workshop led by the primary investigators. It included classroom lectures designed to familiarize trainees with operational definitions, instrument notation, coding conventions, and how to discriminate among the various physical activity, ethnicity/race, and age groupings. Trainees practiced coding and received feedback on their scoring of videotaped samples of physical activity and still photos of individuals of various ethnic/race and age groupings. This was followed by an assessment of trainees using pre-coded behavioral vignettes on videotape. In the afternoon trainees spent 3 h doing field-based observations using the instrument in “real-time.” They coded in diverse settings (e.g., low user density/low activity, high user density/low activity, low user density/high activity, and high user density/high activity), ranging from children’s playgrounds to adult picnic areas and basketball courts. Prior to collecting data for the study, assessors spent two additional days in the field with the measurement coordinator to identify mapped areas and conduct practice observations.
Reliability
Reliability data were collected during 23 observation periods using pairs of assessors who made simultaneous and independent observations. Data from a total of 472 simultaneous measures in 125 different activity areas in six parks were used in the reliability analysis. The reliability analyses were conducted at three different levels by assessing agreements of pairs of assessors on 1) characteristics of target areas (e.g., accessibility, usability); 2) number of females and males in target areas; and 3) the age, race, and physical activity levels of females and males in target areas. Different analytic techniques were used depending on the reliability analysis level.
Agreement on Area Characteristics
Interobserver agreement scores (i.e., overall proportion of agreement) for contextual variables were 98% for area accessibility, 94% for usability, 97% for presence of supervision, 97% for presence of organized activity, and 99% for provision of equipment.
Agreement on the Total Number of Participants in Target Areas
Agreement between two assessors for the total number of individuals observed in the target areas were computed separately for females and males. No females were present in 382 target areas and no males were in 327 areas. We computed reliabilities only for areas in which a female or male was observed by at least one of the two assessors. At least one female was observed by one of the two assessors in 90 of the 472 target areas (19% of observations), and at least one male was observed by one of the assessors in 145 of the target areas (31% of observations). We computed both the simple correlation coefficient and a variant of the overall proportion of agreement. The correlation coefficient for the total number of individual area users was 0.99 for both females and males. We completed an additional analysis using a variant of the overall proportion of agreement. If the number of individuals observed by at least one assessor was 10 or less, the two assessors had to report exactly the same number of people in order to count as having agreed. If both assessors reported a count of 11 or more individuals, an agreement was recorded up to a discrepancy of 10% between the two measurements. The reason for applying this rule is that occasionally some target areas were extremely busy with 30 or more active individuals. This variant of proportion of agreement was 92% for females and 89% for males. Without using this variant, the overall proportion of agreement on the number of participants in a populated area was 84.4% and 85% for females and males, respectively.
Agreement on Age, Race/Ethnicity, and Physical Activity Distributions for Females and Males in Target Areas
Assessors classified each individual by gender into one of four age groups (child, teenager, adult, senior), into one of four race/ethnic groups (Latino, Black, White, Other), and into one of three activity levels (sedentary, walking, vigorous). Because it is not possible for observers to agree exactly on age, race, and activity classifications if they record different counts of individuals in a given area, we calculated the overall proportion of agreement for measurements on which the two assessors agreed exactly on the number of males or females in a target area. This conditional calculation produced high agreement scores (95 to 97% for age; 99 to 100% for ethnicity/race; 88 to 89.5% for activity levels). This calculation tends to be high because agreement on age, ethnicity/race, and physical activity is more likely when there is already agreement on the numbers of people in the area. Therefore, we calculated the marginal proportion of agreement, which in this case coincides with joint proportion of agreement (e.g., joint agreement on the number of individuals observed and the age distribution). Both the conditional proportion of agreement and the joint proportion of agreement, where the joint proportion of agreement is given by the product of the conditional proportion of agreement and the proportion of times in which the two assessors observed exactly the same number of people in a target area, are presented in Table 1. Percent exact agreement refers to the proportion of areas in which park users were present and the two assessors agreed on the exact number.
Table 1.
Proportion of Agreement Between Observer Pairs on Age, Race/Ethnicity, and Activity Level Groupings of Park Users (N = 472 Independent Observations)
| Proportion of overall agreement (O), joint agreement (J), and agreement on exact number in an area (E)
|
||
|---|---|---|
| Category | Females | Males |
| Age | O = 95% | O = 97% |
| J = 80.5% | J = 82.4% | |
| E = 84.4% (76/90) | E = 84.8% (123/145) | |
| Race/ethnicity | O = 100% | O = 99% |
| J = 77% | J = 80.4% | |
| E = 75.6% (68/90) | E = 80.7% (117/145) | |
| Activity level | O = 89.5% | O = 88% |
| J = 71% | J = 74.5% | |
| E = 78.9% (71/90) | E = 84.8% (123/145) | |
Validity
The SOPARC activity codes (i.e., sedentary, walking, vigorous) have been used in previous observation systems: BEACHES (Behaviors of Eating and Activity for Children’s Health: Evaluation System),23 SOFIT (System for Observing Fitness Instruction Time,25, 26 and SOPLAY.19 There is an abundance of evidence demonstrating momentary time sampling techniques yield valid behavioral samples.20 Construct validity of the activity codes has been established through heart rate monitoring with children from ages 4 to 1823, 24 and with accelerometers in schools.25 MET-level estimations associated with both the three observed activity levels (i.e., sedentary, walking, vigorous) and the modes of activity (e.g., soccer, volleyball) are available for both children27 and adults.28
Data Analysis
Activity Variables
For activity measures, counts were tallied for those engaged in sedentary, walking, and vigorous activity in each area to obtain a summary score for females and males. Proportion of individuals in moderate-to-vigorous physical activity (MVPA), a frequently expressed concept,3, 19, 20 was created by summing the walking and vigorous categories.
Units of Analysis
For contextual characteristics of activity areas, the unit of analysis was one scan of one area. For all other variables, the unit of analysis was a gender- and period-specific summary, with the exception of summary park-level variables (e.g., total areas per park), when park was the unit of analysis. To compute gender and period-specific summaries for each park, daily means of counts based on the seven observation days for each target area at each park were computed. Using these scores, totals were computed by aggregating counts across activity areas separately by gender and time period for each park.
Results of Observations
To assess the utility of SOPARC, assessors completed 4511 visits to target areas in the parks and recorded both user and area characteristics each time. Each park was observed on each day of the week, but the 7 d were not consecutive.
Park User Characteristics
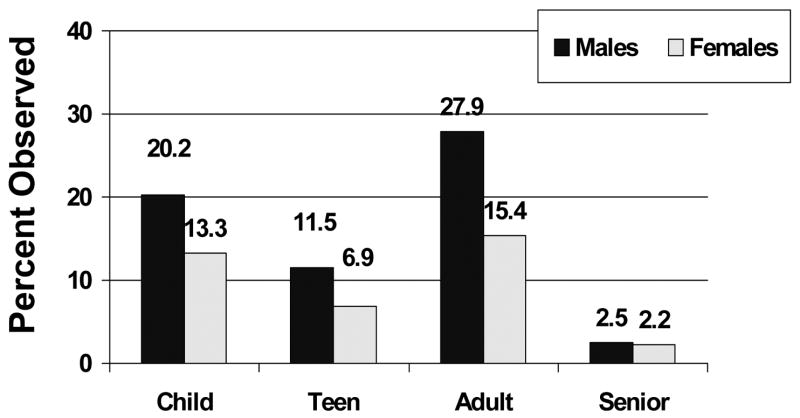
Assessors observed a total of 16,244 individuals, an average of 2031 per park (range = 629 to 4875). More park users were seen in the evening (40.6%), followed by the afternoon (30.0%), noon (23.7%), and morning (5.6%) time periods. The ethnicity/race of park users was coded as Latino (79.5%), Black (19.0%), White (0.6%), and Other (0.9%). These proportions were consistent across gender. Figure 2 shows more adults (43.4%) used the parks than children (33.5%), teens (18.5%), and seniors (4.7%). As expected, most playground users (71.2%) were children. Seniors were a minority in all park settings, including the track (23% of participants), and the picnic (6%) and lawn areas (4%), where they frequented most often. Most park users (72%) engaged in unstructured activities, and the proportions of those participating in structured activities (14.5%) and being spectators (13.5%) were similar.
Figure 2.
Proportion of park users by gender and age groupings. (N = 16,244 people; 165 activity areas; 56 days)
More males than females (62 vs. 38%) used the parks, and this pattern was consistent within the four age groupings (Figure 3) and across all park area types, except the track and picnic areas. Males comprised 63% of those engaged in unstructured activities, 58% of those in structured activities, and 57% of the spectators. A disproportionate number of males occupied sports facilities, including the multipurpose fields (82.4%) and the basketball (75.5%) and volleyball (75.5%) courts.
Figure 3.
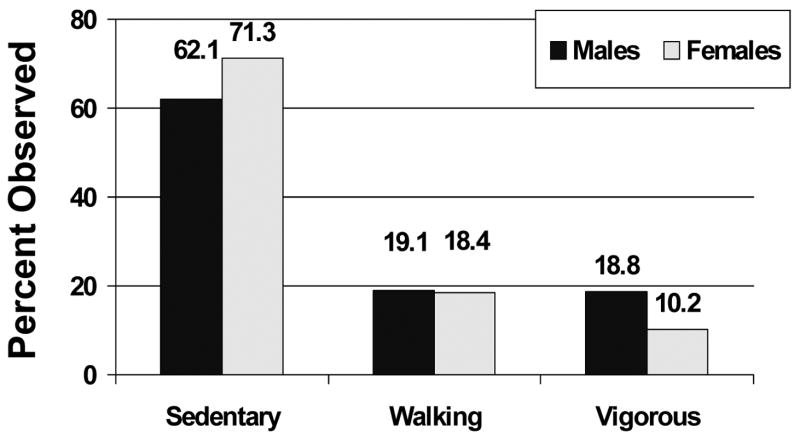
Proportion of males and females in three activity level categories (N = 16,244 people; 165 activity areas; 56 days)
Males were generally more physically active than females. Overall they were observed engaging in vigorous physical activity nearly twice as often as females (19 vs. 10%), as well as during the primary recorded activities (21.4 vs. 12.2%). Females were seen being sedentary (i.e., lying down, sitting, standing) more often (71 vs. 62% of occasions) (see Figure 3). When the walking and vigorous categories were combined, males engaged in MVPA 37.8% of the time, compared to 28.6% for females. Based on observed activities, MET-level estimations were higher for males than females in both structured (5.7 vs. 4.2 METS) and unstructured (4.3 vs. 3.8 METS) activities.
Park Activity Area Characteristics
Activity areas with different configurations and purposes attracted and accommodated different numbers of people. Baseball/softball (20.9% of total visitors), gymnasium (13.4%), lawn (12.8%), playground (9%), and outdoor basketball (8.5%) areas were places most frequently used.
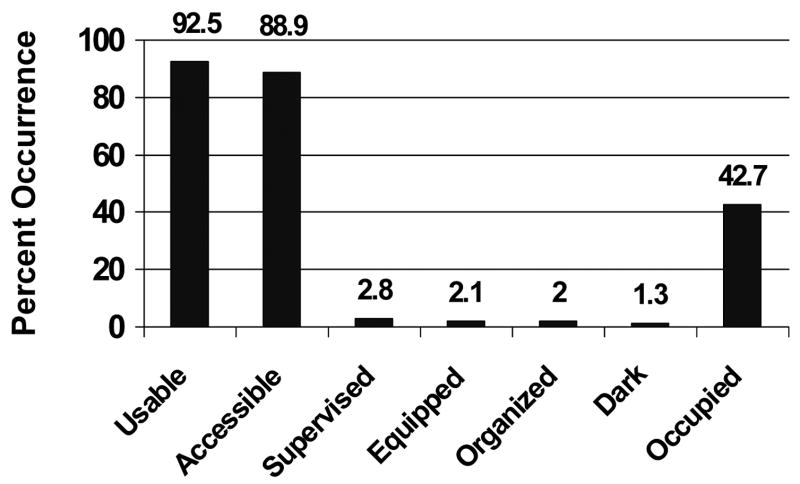
Figure 4 shows that activity areas were typically usable (92.5%) and accessible (88.9%) during assessor visits, but they were occupied less than half the time (42.7%). Rarely did the areas provide immediate supervision (2.8%), sports equipment (2.1%), or organized activities (2%); and rarely were they inaccessible or unusable because of darkness (1.3%).
Figure 4.
Characteristics of physical activity areas (N = 8 parks; 165 activity areas; 4511 area visits)
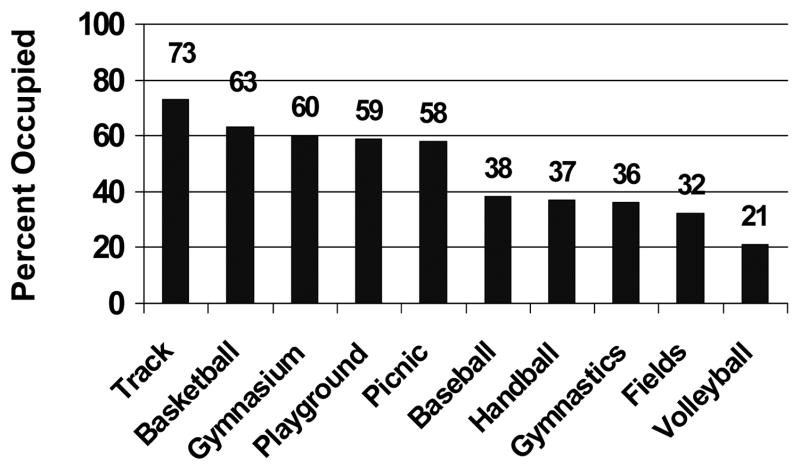
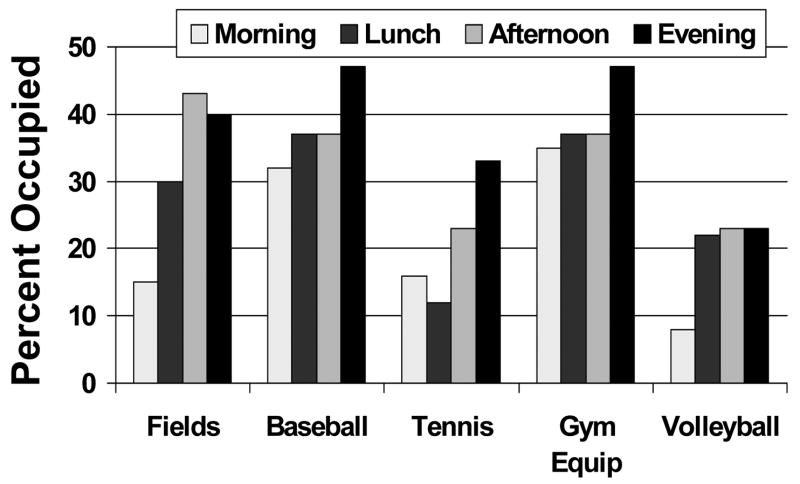
Occupancy of spaces differed by area type and time of day. Figure 5 presents overall occupancy rates for 10 types of activity areas, and shows the track was used during 73% of assessor visits while volleyball courts were occupied only during 21% of assessments. Occupancy of different activity areas varied by time period, with facilities being less used during the morning.
Figure 5.
Proportion of observations during which activity areas were occupied
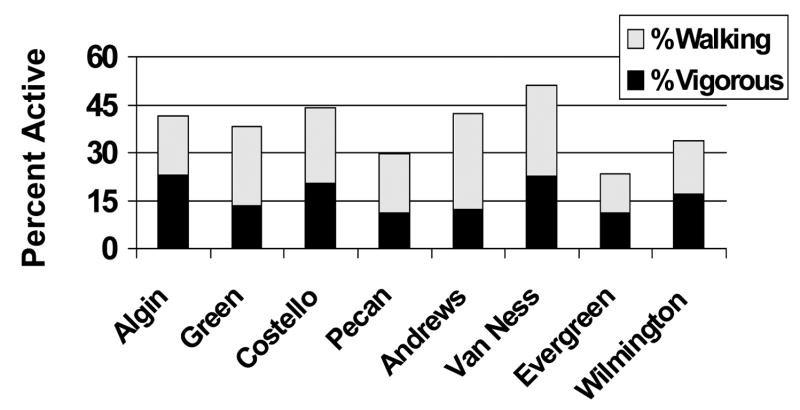
The levels of physical activity of park users varied among parks and within different area types. Figure 7 shows the overall proportion of people observed walking and in vigorous physical activity in the eight parks. Among parks, the vigorous physical activity of users ranged from 11% (Pecan) to 22.9% (Algin) and their MVPA ranged from 23.4% (Evergreen) to 51% (Van Ness).
Figure 7.
Comparison of activity levels of users in eight parks
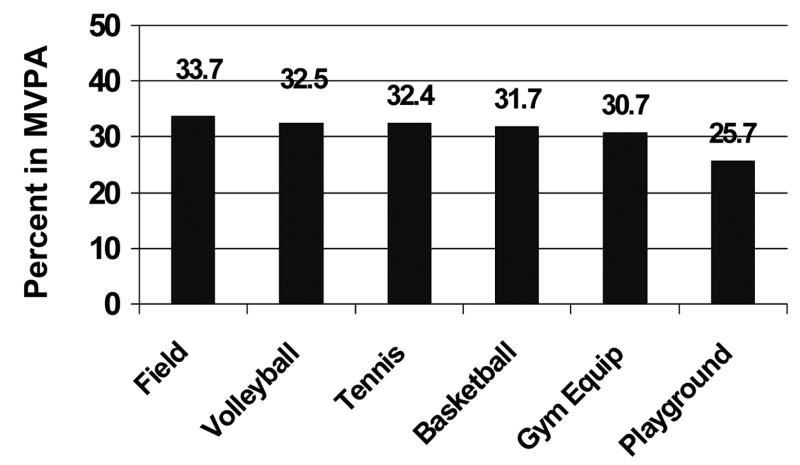
Within major area types, vigorous physical activity (VPA) ranged from 2.5% (picnic areas) to 33.7% (multi-purpose fields). Figure 8 shows the VPA levels of people in the six most active area types. VPA was substantially lower in picnic (12.8%) and lawn (28.5%) areas than in sports facilities, other than baseball/softball fields (22.6%). While baseball/softball and gymnasium areas attracted the most users (20.9% and 13.4% of total, respectively), people in them were frequently sedentary (77.4% and 62.5%, respectively).
Figure 8.
Park areas with highest proportion of users in vigorous physical activity
Discussion
The primary purpose of this study was to develop and assess an objective, contextually- rich, observation system for investigating physical activity and associated variables in community parks. Most instruments used to study physical activity have focused on individual subjects and used self-reported values.11, 12, 17 SOPARC is unlike these measures because it uses direct observation, focuses on group behavior, and its unit of analysis is a target area, not an individual. This feature is important in the study of open environments such as parks and recreation centers where individuals enter and leave areas at different times and from different locations.
We examined the feasibility and utility of SOPARC by using it in an exploratory study to investigate park area contexts and the physical activity levels and associated characteristics of park users in multi-ethnic communities. Minority populations are understudied, and we collected data in large urban community parks in a culturally and geographically diverse metropolitan area over an extended time period (36 wk). Early morning, lunchtime, afternoon, and early evening observation periods were established in advance as the time periods with the most potential for observing diverse people using the parks. We included gender, age, and ethnicity/race groupings in the coding, because these are important factors associated with equity issues and the allocation of public resources.
Overall, the eight parks had numerous physical activity areas (total = 165 areas) which were accessible and usable most of the time (approximately 90%). Nonetheless, these areas were frequently vacant (57% of the time), and when occupied the people in them were most often sedentary (66% of the time) and rarely engaged in vigorous activity (about 16% of the time). More males than females visited the parks, and similar to results of many other studies, were more physically active.
An examination of area contextual characteristics suggests that many opportunities for physical activity in the parks were being wasted. Few organized physical activities were observed, and areas were seldom supervised or had equipment accessible. The provision of more supervision, equipment, and organized activities might lead to more residents being attracted to the parks and being more physically active when there.22 Special efforts might be required to attract population segments that were under represented users of these parks, including females and seniors.11, 16, 22
Several factors need to be considered when attempting to generalize the results from these eight parks. SOPARC is based on momentary time sampling, and is similar to taking periodic snapshots of an environment. More snapshots increase the validity of the measure. In the current study, observations were limited to 7 d per park (56 total days) at four specific time periods per day. Park use and physical activity levels during other time periods might yield different results. As well, there was no way to ensure a single individual was seen only once during the 7 d. We observed community parks in Los Angeles, California during clement weather and there may be unaccounted for environmental, cultural, and political factors that restrict the generalizability of the findings. For example, the temperate climate permits physical activity to occur outdoors year round. Increased seasonal variation in other geographic locations might restrict use of specific outdoor spaces to fewer months of the year and influence park designers to build more indoor facilities and park staff to provide different activity programs.
The reliability of SOPARC was tested by comparing 472 independent observations in 125 different target areas. Interobserver agreement scores for contextual characteristics (i.e., accessibility; usability; and presence of supervision, organized activity, and equipment) of these areas all exceeded 94%. Correlations for the number of users in park areas were also very high (R = 0.99 for both females and males) and stringent methods for assessing reliability (i.e., one that required the matching of exact counts of people) produced scores over 84% for both females and males. Reliabilities for physical activity, age, and race/ethnicity groupings also met acceptable standards. The trained assessors were familiar with the local communities, and this may have aided their categorization of park users by ethnicity/race.
Because SOPARC examines group behavior in target areas, reliability calculations for user-related variables rely upon comparing aggregate scores made by independent observers during a specific time period. Assessors are trained to enter data efficiently while using similar speed to scan areas (approximately one person per second), however, they viewed a target area from a slightly different location/angle. This aspect is most critical in measuring the physical activity in recreation settings because activity levels of individuals change rapidly from moment to moment and is not possible to ensure both assessors observe the same person at exactly the same second.
SOPARC is unable to assess for duration of physical activity, and having only three broad categories for activity levels is a limitation that does not permit a detailed analysis of activity intensities. The activity codes were previously supported by heart rate monitoring in children and adolescents,23, 24 and will permit energy expenditure rates to be estimated for target areas occupied by younger populations. The activity codes have yet to be validated in adult populations. SOPARC, however, codes both the activity levels of individuals (i.e., sedentary, walking, and vigorous) and how many people in each target area are engaged in up to three specific activity modes (e.g., soccer, cheerleading). Thus it is possible to establish estimates of energy expenditure using METS-based scoring from a standard compendium27, 28 in two different ways (i.e., via observed activity levels or observed activity modes). Using observed activity levels (e.g., sedentary, 1.5 METS; walking, 3 METS; vigorous, 6 METS) is the more conservative approach because it accounts for people in an area or sport that may be minimally active (e.g., goal keepers in soccer are frequently sedentary).
Systematic observation is labor-intensive. Assessors need to be trained on all variables, and they need to visit target areas and practice coding in them before data collection begins. Even with extensive training, there is a limit to the amount of data an assessor can record simultaneously. We were interested in numerous variables (e.g., gender, age, and ethnicity/race of park users) in addition to physical activity. In a single visual sweep it was not possible for an assessor to score all the characteristics of interest for each individual occupant of a target area while using a mechanical recorder. We tried many different protocols (including speaking codes into a digital recorder), before settling on making sequential and independent sweeps of each area for females and for males for age/ethnicity and activity level groupings. Subsequently, we were able to tie physical activity data to gender, but not to age and ethnic/race groupings. Because individuals may have entered or left an area between visual sweeps or may have been obscured behind others when it was crowded, data from separate sweeps did not always match precisely. For example, we collected gender, ethnic/race, and age data on 16,244 park users and gender and activity data on 16,048 users and (98.8% congruence, overall). Technological developments in lightweight portable electronic devices may soon solve many of these problems.
The rising prevalence of child and adult obesity14, 15 multiple health problems associated with sedentary living,1, 3 and high proportion of people of all ages not meeting health-related physical activity guidelines1–3 support the need to develop and study interventions to increase leisure-time physical activity in multiple environments. These include park and recreation settings, which are available in most communities and may be the only physical activity environments available to people of all ages and at minimal costs. Systematic observation provides more contextually-rich information about settings in which physical activity occurs than any other measure.20
SOPARC has potential for both practitioners and researchers interested in assessing the numbers and the characteristics of participants who use park and recreation settings. While the present study evaluated urban community parks, the instrument can be used in a wide range of indoor and outdoor settings including school campuses. A strength of SOPARC is that simultaneous evaluations of physical activity and associated social and physical contextual factors allow for examining the influence of setting variables on attendance and physical activity levels. Thus, it has the potential to assess the effects of environmental and policy interventions that are needed to increase the physical activity of specific populations.4
In summary, SOPARC can be used to collect relevant physical activity and contextual data in parks, and trained observers use the system reliably. Its reliability, utility, and generalizability were established through its use in generating data in numerous activity areas in large parks in diverse multi-ethnic communities. The instrument will permit data on contextual characteristics of both park areas and area users to be compared over time or across settings (e.g., for intervention evaluation purposes), and it should be useful to park designers and program planners in making formative, process, and outcome evaluations.
Figure 6.
Use of five area types during four time periods
Acknowledgments
The research was supported by a NIES grant (P50ES012383) to the Center for Population Health and Health Disparities, RAND Corporation. The authors thank MAHEC and the staff and administrators of the eight Los Angeles parks.
References
- 1.Centers for Disease Control and Prevention. Physical activity levels among children aged 9–13 years-United States, 2002. MMWR. 2003;52(33):785–788. [PubMed] [Google Scholar]
- 2.Grunbaum J, Kann L, Kinchen S, Ross J, Hawkins J, Lowry R, Harris W, McManus T, Chryen D, Collins J. Youth risk behavior surveillance-United States, 2003. MMWR. 2004;53(No.RR-18):1–96. [PubMed] [Google Scholar]
- 3.US Dept of Health and Human Services. The Surgeon General’s call to action to prevent and decrease overweight and obesity. Washington: US Govt Printing Office; 2001. [Google Scholar]
- 4.Sallis JF, Bauman A, Pratt M. Environmental and policy interventions to promote physical activity. Am J Prev Med. 1998;15:379–397. doi: 10.1016/s0749-3797(98)00076-2. [DOI] [PubMed] [Google Scholar]
- 5.Owen N, Leslie E, Salmon J, Fotheringham M. Environmental determinants of physical activity and sedentary behavior. Exerc Sport Sci Rev. 2000;28:153–158. [PubMed] [Google Scholar]
- 6.Humpel N, Owen N, Leslie E. Environmental factors associated with adults’ participation in physical activity: a review. Am J Prev Med. 2002;22:188–99. doi: 10.1016/s0749-3797(01)00426-3. [DOI] [PubMed] [Google Scholar]
- 7.Burgeson C, Wechsler H, Brener N, Young J, Spain C. Physical education and activity: results of the School Health Policies and Programs Study 2000. J School Health. 2001;71:279–293. doi: 10.1111/j.1746-1561.2001.tb03505.x. [DOI] [PubMed] [Google Scholar]
- 8.Orsega-Smith E, Payne L, Catzenmeyer C, Godbey G. Community recreation and parks: the benefits of a healthy agenda. Parks Recreation. 2000;35(10):68–74. [Google Scholar]
- 9.Centers for Disease Control and Prevention. Guidelines for school and community programs to promote lifelong physical activity among young people. MMWR. 1997;46(RR-6):1–32. [PubMed] [Google Scholar]
- 10.Bedimo-Rung AL, Mowen A, Cohen DA. The significance of parks to physical activity and public health: a conceptual model. Am J Prev Med. 2005;28(2S2):159–168. doi: 10.1016/j.amepre.2004.10.024. [DOI] [PubMed] [Google Scholar]
- 11.Henderson KA, Ainsworth BE. Researching leisure and physical activity with women of color: issues and emerging questions. Leisure Sci. 2001;23(1):21–34. [Google Scholar]
- 12.Godbey GC, Caldwell LL, Floyd M, Payne LL. Contributions of leisure studies and recreation and park management research to the active living agenda. Am J Prev Med. 2005;28(2S2):150–158. doi: 10.1016/j.amepre.2004.10.027. [DOI] [PubMed] [Google Scholar]
- 13.Wolf A, Gortmaker S, Cheung L, Gray H, Herzog D, Colditz G. Activity, inactivity, and obesity: racial, ethnic, and age differences among school girls. Am J Public Health. 1993;83:1625–1627. doi: 10.2105/ajph.83.11.1625. [DOI] [PMC free article] [PubMed] [Google Scholar]
- 14.Mokdad A, Bowman B, Ford E, Vinicor F, Marks J, Koplan J. The continuing epidemics of obesity and diabetes in the United States. JAMA. 2001;286:1195–1200. doi: 10.1001/jama.286.10.1195. [DOI] [PubMed] [Google Scholar]
- 15.Rocchini AP. Childhood obesity and a diabetes epidemic. New Engl J Med. 2002;346:854–855. doi: 10.1056/NEJM200203143461112. [DOI] [PubMed] [Google Scholar]
- 16.Hoehner CM, Ramirez LK, Elliott MB, Handy SL, Brownson RC. Perceived and objective environmental measures and physical activity among urban adults. Am J Prev Med. 2005;28(2S2):105–116. doi: 10.1016/j.amepre.2004.10.023. [DOI] [PubMed] [Google Scholar]
- 17.Welk G, editor. Physical activity assessments for health-related research. Champaign, IL: Human Kinetics; 2002. [Google Scholar]
- 18.Payne L, Mowen A, Orsega-Smith E. An examination of park preferences and behaviors among urban residents: the role of residential location, race, and age. Leisure Sci. 2002;24(2):181–198. [Google Scholar]
- 19.McKenzie TL, Marshall SJ, Sallis JF, Conway TL. Leisure-time physical activity in school environments: an observational study using SOPLAY. Prev Med. 2000;30:70–77. doi: 10.1006/pmed.1999.0591. [DOI] [PubMed] [Google Scholar]
- 20.McKenzie TL. The use of direct observation to assess physical activity. In: Welk G, editor. Physical activity assessments for health-related research. Champaign, IL: Human Kinetics; 2002. pp. 179–195. [Google Scholar]
- 21.Murphy HA, Hutchison JM, Bailey JS. Behavioral school psychology goes outdoors: the effect of organized games on playground aggression. J Appl Behav Anal. 1983;16:29–35. doi: 10.1901/jaba.1983.16-29. [DOI] [PMC free article] [PubMed] [Google Scholar]
- 22.Sallis JF, McKenzie TL, Conway TL, Elder JP, Prochaska JJ, Brown M, Zive MM, Marshall SJ, Alcaraz JE. Environmental interventions for eating and physical activity: A randomized controlled trial in middle schools. Am J Prev Med. 2003;24:209–217. doi: 10.1016/s0749-3797(02)00646-3. [DOI] [PubMed] [Google Scholar]
- 23.McKenzie TL, Sallis JF, Patterson TL, Elder JP, Berry CC, Rupp JW, et al. BEACHES: An observational system for assessing children’s eating and physical activity behaviors and associated events. J Appl Behav Anal. 1991;24:141–151. doi: 10.1901/jaba.1991.24-141. [DOI] [PMC free article] [PubMed] [Google Scholar]
- 24.Rowe P, van der Mars H, Schuldheisz J, Fox S. Measuring students’ physical activity levels: Validating SOFIT for use with high school students. J Teach Phys Educ. 2004;23:235–251. [Google Scholar]
- 25.Scruggs P, Beveridge S, Eisenman P, Watson D, Schultz B, Ransdell L. Quantifying physical activity via pedometry in elementary physical education. Med Sci Sport Exerc. 2003;35:1065–1071. doi: 10.1249/01.MSS.0000069748.02525.B2. [DOI] [PubMed] [Google Scholar]
- 26.McKenzie TL, Sallis JF, Nader PR. SOFIT: system for observing fitness instruction time. J Teach Phys Educ. 1991;11:195–205. [Google Scholar]
- 27.Harrell JS, McMurray RG, Baggett CD, Pennell ML, Pearce PF, Bangdiwala SI. Energy costs of physical activities in children and adolescents. Med Sci Sports Exerc. 2005;37(2):329–36. doi: 10.1249/01.mss.0000153115.33762.3f. [DOI] [PubMed] [Google Scholar]
- 28.Ainsworth BE, Haskell WL, Whitt MC, Irwin ML, Swartz AM, Strath SJ, O’Brien WL, Bassett DR, Jr, Schmitz KH, Emplaincourt PO, Jacobs DR, Jr, Leon AS. Compendium of physical activities: an update of activity codes and MET intensities. Med Sci Sports Exerc. 2000 Sep;32(9 Suppl):S498–504. doi: 10.1097/00005768-200009001-00009. [DOI] [PubMed] [Google Scholar]


