

Abstract
Background
Environmental exposure to polychlorinated biphenyls (PCBs) and p,p′-dichlorodiphenyldichloroethylene (p,p′-DDE) has been associated with the risk of non-Hodgkin lymphoma.
Methods
We conducted a case-control study nested within the Physicians’ Health Study, a prospective cohort established in 1982. We measured concentrations of PCBs and p,p′-DDE in baseline blood samples from 205 men later diagnosed with non-Hodgkin lymphoma and 409 age- and race-matched controls. Lipid-adjusted organochlorine concentrations were categorized into quintiles based on the distribution among controls. We used conditional logistic regression to estimate the odds ratios (ORs) and 95% confidence intervals (CIs) for each quintile relative to the lowest quintile. We also evaluated these associations for major histologic subtypes of non-Hodgkin lymphoma.
Results
The risk of non-Hodgkin lymphoma was positively associated with the sum of 51 PCB congeners assayed (ΣPCB); the group of immunotoxic congeners; the individual congeners 118, 138, 153, and 180; and the sum of these four congeners. The simple OR for the highest quintile of lipid-adjusted ΣPCB versus the lowest was 1.9 (95% CI = 1.1-3.2; test for trend P = 0.001), with similar trends for individual congeners and groups defined as above. Adjustment for height, body mass index, alcohol intake, smoking, and fish intake did not substantially change the effect estimates. No association was observed for p,p′-DDE. There was no evidence of statistical heterogeneity in effects by histologic subtype of lymphoma; however, this analysis was underpowered.
Conclusions
These results support the hypothesis of a positive association between PCB exposure and development of NHL in men.
Incidence rates for non-Hodgkin lymphoma have nearly doubled since the 1970s, although with no further rise since the mid-1990s.1,2 The increase in non-Hodgkin lymphoma incidence over time cannot be fully explained by improvements in diagnosis, the rise in AIDS-related non-Hodgkin lymphoma diagnoses, or other known risk factors.3,4 Possible reasons may include secular trends in the exposure to environmental factors.
Polychlorinated biphenyls (PCBs) and organochlorine pesticides such as dichlorodiphenyl trichloroethane (DDT) have been the focus of recent studies of non-Hodgkin lymphoma.5-8 PCBs were first produced in the U.S. in 1929 and were used for a variety of industrial purposes in hydraulic fluids, flame retardants, paints, plasticizers, pesticides, and wood preservatives, and as coolants or lubricants in transformers and capacitors. Although manufacturing of PCBs was banned in the U.S. in 1977, these compounds persist in air, water, and soil, and accumulate in fish. Moreover, PCBs are still being introduced into the environment through improperly maintained industrial waste sites and illegal dumping. PCBs are lipid-soluble and are stored in adipose tissue and in the lipid components of blood and breast milk. Because PCBs are not easily metabolized and have long half-lives, the concentrations of PCBs in tissue or breast milk provide reasonable estimates of cumulative exposures over time.9
DDT was manufactured and used as an insecticide in the U.S. from 1945 until it was banned in 1972. Like PCBs, DDT is an environmentally persistent pollutant and accumulates in fish. In addition, some developing countries still use DDT, and foods imported from these countries may be contaminated.10 These compounds are ubiquitous in the environment, and exposure to low levels of DDT, its metabolites, and PCBs among the general U.S. population continues today.9,10
Organochlorines have been classified as probable human carcinogens by the U.S. Environmental Protection Agency (EPA) and the International Agency for Research on Cancer (IARC), based largely on animal evidence.11,12 In addition to their carcinogenic properties, organochlorines also exhibit immunotoxic effects.9,13,14 Recent epidemiologic evidence suggests that exposure to certain PCBs and p,p′-dichlorodiphenyl dichloroethane (p,p′-DDE), the major metabolite of DDT, may increase the risk of non-Hodgkin lymphoma, with relative risks generally ranging from two to four.6,7,15-17 Other case-control studies have reported no association between PCBs and non-Hodgkin lymphoma.5,18 Among the studies with positive findings overall, results for individual PCB congeners have been inconsistent. To date, only three studies have reported associations with organochlorine levels measured in blood collected before diagnosis.7 Only two retrospective case-control studies have had sufficient sample size to examine associations by the major histologic subtypes of non-Hodgkin lymphoma.5,6
To test the hypothesis that higher blood levels of PCBs and p,p′-DDE are associated with a subsequent increased risk of non-Hodgkin lymphoma, we measured concentrations of organochlorines in blood samples collected prospectively in 205 men with non-Hodgkin lymphoma and 409 matched controls in the Physicians’ Health Study. We also evaluated these associations with subtypes of non-Hodgkin lymphoma based on the World Health Organization (WHO) classification of lymphomas.19
Methods
Study population
Non-Hodgkin lymphoma cases were identified from participants in the Physicians’ Health Study, which began in 1982 as a randomized trial of aspirin and β-carotene for the primary prevention of cardiovascular disease and cancer among 22,071 U.S. male physicians ages 40 to 84 years at enrollment. No exclusions were made for HIV infection, autoimmune diseases, or organ transplantation. These endpoints have not been formally assessed in follow-up; however, the prevalence of these conditions is expected to be rare. Baseline information (including age, smoking history, weight, height, race, alcohol intake, and region of residence) was collected by self-administered questionnaire. Fish intake was assessed at the 12-month follow-up with an abbreviated semiquantitative food-frequency questionnaire.20 The questionnaire asked about average fish intake for four types of fish (canned tuna fish, dark meat fish, other fish, and shellfish) and included seven response categories ranging from rarely/never to 2+ servings/day.
Between August 1982 and December 1984 (before randomization), 14,916 men provided a blood sample using blood collection kits sent to the participants. Plasma and whole blood specimens were received in our laboratory on chill packs within 24 hours after being drawn. Upon arrival, the samples were refrigerated and realiquotted into 1.2 mL tubes and frozen at - 82°C.
Non-Hodgkin lymphoma diagnoses, including chronic lymphocytic leukemia/small lymphocytic lymphoma, were identified by annual follow-up questionnaires and were confirmed by review of medical records and pathology reports. Follow-up in the Physicians’ Heath Study is over 97% for non-fatal outcomes and 100% for mortality. We excluded men with a diagnosis of non-Hodgkin lymphoma prior to or within six months of blood collection and those with a prior diagnosis of cancer (other than non-melanoma skin cancer). Histologic subtype was determined according to the WHO classification.19 Specifically, diagnoses were made based on morphology and immunophenotype information available in medical records and pathology reports, and represented the consensus opinion of two hematopathologists. Immunophenotype was not required for diagnoses of chronic lymphocytic leukemia/small lymphocytic lymphoma or follicular lymphoma, which can be reliably diagnosed by morphology alone.19 Forty-two cases of B cell lymphoma belonged to uncommon subtypes (e.g., mantle cell lymphoma) or lacked sufficient information for subtype classification. Only 10 T cell lymphomas were identified. An additional 34 cases were determined to be non-Hodgkin lymphoma based on morphology alone, but lacked adequate phenotyping to assign the tumor to the B or T cell lineage.
After the above exclusions, there were 205 cases diagnosed between December 1982 and October 2003 among men with available blood samples. For each case, two control subjects were randomly selected among participants who were the same race and age at baseline (± 1 year), provided a blood sample at the same time (± 1 month), and were at risk of non-Hodgkin lymphoma when the case occurred. Cases and controls were also matched on fasting status at blood draw. As with cases, we excluded controls with a history of cancer (except non-melanoma skin cancer). There was insufficient blood volume for one selected control subject; therefore, the final study population comprised 205 cases and 409 controls. This study was approved by the Institutional Review Board of Brigham and Women’s Hospital, and all participants provided written informed consent at enrollment.
Laboratory analyses
Analyses were done at the Harvard School of Public Health Organic Chemistry Analytical Laboratory, using methods described in detail elsewhere.21 Laboratory personnel were unaware of case-control status. Prior to extraction, each sample was spiked with two surrogate compounds to monitor the efficiency of the extraction procedure. After liquid-liquid extraction and column chromatography clean-up, the samples were analyzed on a gas chromatograph (Agilent 6890 GC) with a dual Micro-ECD (μECD) and with temperature and pressure programming capabilities and a split/splitless injector. The 0.5 mL plasma samples were analyzed for 51 individual PCB congeners [International Union of Pure and Applied Chemistry (IUPAC) congeners 6, 8, 16, 18, 25, 26, 28, 31, 33, 37, 41, 44, 47, 49, 52, 60, 66, 70, 74, 77, 84, 95, 99, 97, 87, 101, 105, 110, 118, 128, 135, 136, 138, 141, 146, 149, 151, 153, 156, 157, 167, 180, 183, 187, 189, 170, 171, 174, 194, 195, 196, 199, 201/177, 203, 206, and 209] and p,p′-DDE. All samples were analyzed on two capillary columns of different polarity. Where results from both columns were within 20%, the average value was reported; for >20% difference, the lower value was reported.
Quantitation of target analytes was based on the response factors of the individual analyte relative to two internal standards (PCB congeners 46 and 112). PCB concentrations were reported as individual congeners and as the sum of the concentrations of all congeners assayed (ΣPCB). The amount of each analyte in the sample was corrected by the amount in the procedural blank associated with the analytical batch. Results were not adjusted for surrogate recoveries.
We determined method detection limits for plasma samples based on the standard deviation obtained from replicate analysis of eight 0.5 aliquots of bovine serum spiked with target analytes (0.1 nanograms of each analyte), according to a protocol outlined in the Federal Register, 40 CFR Part 136, Appendix A. All samples had p-p′-DDE levels greater than the detection limits; from <1% (congeners 16, 25, 26, 33, and 41) to >99% (congeners 74, 118, 138, 146, 153, 156, 170, 180, 187, 194, 196, 199, 203, 206, and 209) of samples had PCB concentrations above the detection limit. We retained measurable values below the MDL in our dataset to optimize statistical power and avoid biased exposure estimates associated with censoring at the detection limit.22 If no value was reported for a given analyte, we assumed a value of 0.
Plasma sample sets were constructed to contain matched triplets of cases and controls (with the order of samples randomized) and were sent to the laboratory in batches of five triplets. In addition, every batch included a pair of samples from a plasma pool used for quality assessment. For each batch we calculated the coefficient of variation (CV). Based on 42 possible batches, the median intrabatch CV was 3.4% for ΣPCB and 1.7% for p,p′-DDE. The median intrabatch CVs for the four most abundant PCB congeners were 2.5% for congener 118, 2.8% for congener 138, 2.6% for congener 153 and 3.7% for congener 180. The interbatch CVs were 15% for ΣPCB and 20% for p,p′-DDE.
Samples were assayed separately for total cholesterol and triglyceride levels. PCB and p-p′-DDE concentrations were adjusted for total serum lipids calculated using the formula by Phillips et al.23 Concentrations are reported in units of nanograms of organochlorine per gram of lipid (ng/g).
Statistical analyses
Our primary interest was in p-p′-DDE and a priori groupings of PCB congeners based on suspected immunotoxicity (i.e., 66, 74, 105, 118, 156, 167).24 We also evaluated other groupings, including the sum of all 51 congeners assayed (ΣPCB) and the sum of congeners 118, 138, 153, and 180 as well as these individual PCB congeners. These individual congeners were chosen for analysis because they are the most prevalent and can be assayed with relatively low measurement error. Relationships between individual lipid-adjusted PCB congeners, groups defined as above, and p,p′-DDE were assessed by Spearman correlation coefficients.
We examined the distribution of potential risk factors for non-Hodgkin lymphoma within tertiles of levels of organochlorines among the controls. For continuous variables, the medians in the tertiles were compared using the Kruskal-Wallis test. The chi-square test was used to compare categorical variables. Among the controls, we assessed the association of age-adjusted levels of ΣPCB with each category of potential confounder using analysis of variance (ANOVA) and tests for trend.
We categorized organochlorine concentrations into quintiles based on the distribution among controls. In separate models for each organochlorine or group of organochlorines, we used conditional logistic regression (stratifying on the matched case-control triplets) to estimate odds ratios (ORs) and 95% confidence intervals (CIs) for risk of non-Hodgkin lymphoma associated with each quintile of exposure relative to the lowest quintile. Tests for trend were performed using the natural log-transformed lipid-adjusted organochlorine concentrations as continuous variables. We also examined the possibly non-linear relation between ΣPCB and the OR of non-Hodgkin lymphoma with restricted cubic splines.25 Tests for non-linearity used the likelihood ratio test, comparing nested models with only the linear term to the model with the linear and the cubic spline terms.
We used multivariable conditional logistic regression models including height as a continuous variable and indicator variables for region of residence, smoking history, body mass index, and alcohol intake to adjust simultaneously for potential confounding by these factors. Covariates were chosen based on observed relationships with organochlorine concentrations or non-Hodgkin lymphoma, and for consistency with previously published studies. Additional analyses of individual PCB congeners and congener groups were performed including p-p′-DDE in the model. No individuals were missing the primary exposure variables. Since fish consumption is an important source of PCB exposure, potential confounding by fish intake was considered in sub-analyses by including an indicator variable for ≥ 1 serving/week vs. < 1 serving/week for four types of fish (i.e., canned tuna fish, dark meat fish, other fish, and shellfish) in the model. For these analyses, we excluded individuals with missing information on fish intake (n = 20 for tuna; n = 8 for dark fish; n = 24 for other fish; and n = 9 for shellfish) as well as cases who were diagnosed with non-Hodgkin lymphoma before the 12-month follow-up questionnaire (n = 7).
We also examined whether the associations between organochlorines and non-Hodgkin lymphoma were modified by known or suspected risk factors for non-Hodgkin lymphoma as well as region of residence. We conducted unconditional logistic regression analyses of tertiles of each PCB congener (or group of congeners) within strata of geographic region, age at diagnosis, body mass index (BMI; kg/m2), smoking history, and follow-up period controlling for the matching factors (i.e., baseline age, month and year of blood draw, race/ethnicity, and fasting status). We evaluated statistical interaction by the likelihood ratio test comparing a model with interaction terms for cross-classifications of exposure tertiles and levels of the risk factor to a main-effects-only model. However, the power for these analyses was limited.
Finally, we performed separate analyses for the most common non-Hodgkin lymphoma subtypes in the Physicians’ Health Study: diffuse large B-cell lymphoma (n = 35), follicular lymphoma (n = 27), and chronic lymphocytic leukemia/small lymphocytic lymphoma (n = 57). To improve statistical efficiency and utilize all controls, we performed unconditional logistic regression, adjusting for the matching factors. We used polytomous logistic regression to test for heterogeneity in effect estimates by non-Hodgkin lymphoma subtype, considering the natural log-transformed lipid-adjusted organochlorine concentrations as a continuous variable. Histologic subtype was unknown for 34 cases and other subtypes were represented by too few cases for meaningful analyses.
All statistical tests were two-sided and analyses were performed using SAS version 9 for UNIX (SAS Institute Inc., Cary, NC).
Results
Study population characteristics for cases and controls are presented in Table 1. Cases and controls were similar with respect to baseline age (matching factor), height, and history of smoking and alcohol intake at baseline. Cases were more likely to reside in the Northeast and Midwest and less likely to reside in the West compared with controls. In addition, cases were somewhat more likely to be overweight. The median time to diagnosis among cases was 12 years.
Table 1.
Characteristics of non-Hodgkin lymphoma cases and controls.
| Cases (n = 205) | Controls (n = 409) | |
|---|---|---|
| Age at baseline (yrs); mean (SD) | 56.2 (8.7) | 56.0 (8.5) |
| Height (inches); mean (SD) | 70.3 (3.1) | 70.3 (2.7) |
| Region of residencea; no. (%) | ||
| Northeast | 60 (29) | 96 (23) |
| Midwest | 54 (26) | 94 (23) |
| West | 37 (18) | 108 (26) |
| South | 53 (26) | 106 (26) |
| Panama, Puerto Rico | 1 (0.5) | 5 (1.2) |
| BMI (kg/m2) | ||
| <25 | 110 (54) | 253 (62) |
| 25-29.9 | 89 (43) | 137 (33) |
| 30+ | 6 (2.9) | 19 (4.7) |
| Alcohol intakeb | ||
| ≥ 1 time/day | 54 (26) | 89 (22) |
| 1-6 times/week | 101 (50) | 205 (51) |
| 1-3 times/month | 21 (10) | 53 (13) |
| rarely/never | 28 (14) | 58 (14) |
| Smokingb | ||
| never | 101 (49) | 199 (49) |
| past | 82 (40) | 166 (41) |
| current | 22 (11) | 42 (10) |
| NHL subtype | ||
| Diffuse large B-cell lymphoma | 35 (17) | |
| Follicular lymphoma | 27 (13) | |
| Chronic lymphocytic leukemia/small lymphocytic lymphoma | 57 (28) | |
| Other and unclassified B-cell | 42 (20) | |
| T-cell | 10 (5) | |
| Unknown | 34 (17) |
Region: Northeast: CT (n=14), MA (n=22), ME (n=8), NH (n=4), NJ (n=18), NY (n=45), PA (n=39), RI (n=2), VT (n=4); Midwest: IA (n=6), IL (n=25), IN (n=16), KS (n=8), MI (n=25), MN (n=13), MO (n=12), ND (n=1), NE (n=4), OH (n=24), WI (n=14); West: AZ (n=8), CA (n=77), CO (n=12), HI (n=4), ID (n=4), MT (n=4), NM (n=2), NV (n=1), OR (n=8), UT (n=4), WA (n=19), WY (n=2); South: AL (n=6), AR (n=3), DC (n=5), FL (n=17), GA (n=11), KY (n=5), LA (n=4), MD (n=11), MS (n=6), NC (n=15), OK (n=12), SC (n=5), TN (n=13), TX (n=22), VA (n=18), WV (n=6)
Alcohol data missing for 4 controls and 1 case and smoking data missing for 2 controls.
Table 2 shows the distribution of subject characteristics by tertile of ΣPCB concentration among controls. As expected, men in the second and third tertiles of exposure were considerably older than those in the first tertile. There was no apparent association between BMI and tertiles of ΣPCB concentration. There was an association between geographic region and plasma PCB levels; 39% of controls in the highest tertile of PCB exposure resided in the Northeast compared with less than 10% of controls in the lowest tertile. There were no substantial differences in alcohol intake or fish intake by tertiles of PCBs. Compared with those in the lowest tertile, men in the highest tertile of PCB were more likely to be past smokers, but were less likely to be current smokers.
Table 2.
Relation between risk factors and plasma levels of ΣPCB among 409 controls.
| Risk factor | Tertile of exposure | ||
|---|---|---|---|
| 1st (163-697 ng/g) | 2nd (>697-948 ng/g) | 3rd (>948-5322 ng/g) | |
| Age at baseline (years); | |||
| median | 53.6 | 57.4 | 57.6 |
| Height (inches); median | 71 | 71 | 70 |
| BMI (kg/m2); median | 24.3 | 24.4 | 23.9 |
| Region of residence; % | |||
| Northeast | 9 | 23 | 39 |
| Midwest | 22 | 23 | 24 |
| West | 39 | 27 | 13 |
| South | 29 | 25 | 24 |
| Panama, Puerto Rico | 1 | 2 | 0 |
| Alcohol intake; % | |||
| ≥ 1 time/day | 19 | 24 | 23 |
| 1-6 times/week | 55 | 45 | 51 |
| 1-3 times/month | 14 | 13 | 13 |
| rarely/never | 12 | 18 | 13 |
| Smoking history; % | |||
| never | 50 | 51 | 46 |
| past | 35 | 42 | 46 |
| current | 15 | 7 | 8 |
| Fish intake, ≥ 1 serving/week; %b | |||
| canned tuna fish | 23 | 24 | 32 |
| dark fish | 12 | 7 | 17 |
| other fish | 43 | 36 | 49 |
| shellfish | 11 | 10 | 15 |
Kruskall-Wallis test for age, height, & BMI; chi-square test for region, smoking history, alcohol intake, & fish intake.
Alcohol data missing for 4 controls and smoking data missing for 2 controls. No. of controls with missing data on tuna fish, 14; dark fish, 6; other fish, 20; shellfish, 6.
The age-adjusted means of ΣPCB among controls for categories of geographic region, BMI, alcohol intake, smoking history, and fish intake are shown in eTable 1 (http://links.lww.com). PCB concentrations were associated with region of residence, smoking history, and dark fish intake. Current smokers had lower levels of PCBs than past smokers and never smokers. There was no relationship of PCBs with BMI, alcohol intake, or intake of canned tuna fish, other fish, or shellfish.
eTable 1.
Age-adjusted ΣPCB means (in ng/g lipid) by potential predictors among 409 controls.
| Covariate | No. | ΣPCB |
|---|---|---|
| Mean (SE) | ||
| Region of residence | ||
| Northeast | 96 | 1,113 (50) |
| Midwest | 94 | 893 (36) |
| West | 108 | 763 (24) |
| South | 106 | 851 (32) |
| Panama, Puerto Rico | 5 | 650 (81) |
| BMI (tertiles) | ||
| Tertile 1 (18.8-23.3 kg/m2) | 137 | 883 (29) |
| Tertile 2 (23.4-25.1 kg/m2) | 134 | 976 (41) |
| Tertile 3 (25.1-39.1 kg/m2) | 138 | 833 (25) |
| Alcohol intake | ||
| ≥ 1 time/day | 89 | 915 (45) |
| 1-6 times/week | 205 | 905 (26) |
| 1-3 times/month | 53 | 858 (46) |
| rarely/never | 58 | 886 (50) |
| Smoking history | ||
| never | 199 | 891 (26) |
| past | 166 | 933 (31) |
| current | 42 | 758 (50) |
| Fish intake (servings/week) | ||
| Canned tuna fish | ||
| < 1 | 291 | 902 (24) |
| ≥ 1 | 104 | 889 (30) |
| Dark fish | ||
| < 1 | 354 | 879 (19) |
| ≥ 1 | 49 | 1,033 (72) |
| Other fish | ||
| < 1 | 223 | 883 (24) |
| ≥ 1 | 166 | 926 (32) |
| Shellfish | ||
| < 1 | 355 | 897 (20) |
| ≥ 1 | 48 | 905 (54) |
SE, standard error
Individual PCB congeners were strongly correlated with each other and with the specified functional groupings, with most Spearman correlation coefficients ≥ 0.7. Correlations between p,p′-DDE and individual PCB congeners ranged from 0.17 to 0.42.
In the conditional logistic regression analyses that adjusted only for matching factors,, we found an increased risk of non-Hodgkin lymphoma associated with lipid-adjusted ΣPCB. OR for the highest quintile versus the lowest was 1.9 (95% CI = 1.1-3.2; test for trend P = 0.001) (Table 3). There was no evidence of non-linearity when applying restricted cubic splines (P = 0.94) (Figure). Similar trends were observed for the group of immunotoxic congeners, the individual congeners 118, 138, 153 and 180, and the sum of these four congeners. Adjustment for geographic region of residence generally attenuated these effect estimates. Further adjustment for height, BMI, alcohol intake, and smoking history did not substantially change the effect estimates. Similarly, controlling for these factors did not change the effect estimates relative to the simple model that did not include region. In the fully adjusted multivariate models, linear trends were apparent for all PCB metrics. The strongest associations were observed for congeners 153 (multivariable-adjusted OR comparing the fifth quintile to the first = 2.1 [95% CI = 1.1-3.8]; P-trend < 0.01) and 180 (2.4 [1.3-4.5]; P-trend < 0.01). No association was observed for p,p′-DDE. Moreover, p,p′-DDE did not appear to confound the observed PCB-non-Hodgkin lymphoma associations (data not shown). Among the subset of men with prospective data on fish consumption, univariate associations between PCBs and non-Hodgkin lymphoma were similar to those in the full study population. There did not appear to be confounding by fish intake for any type of fish (data not shown).
Table 3.
Association of PCB & p-p′-DDE exposure (quintiles) with non-Hodgkin lymphoma.
| Exposure quintile | Median (ng/g lipid) | Range (ng/g lipid) | Cases No. | Controls No. | Crude OR (95% CI) | Adjusted for region OR (95% CI)a | Multivariate Adjusted OR (95% CI)b | Test for trendc |
|---|---|---|---|---|---|---|---|---|
| ΣPCB | ||||||||
| 1d | 518 | 163-617 | 33 | 81 | 1.0 | 1.0 | 1.0 | P < 0.01 |
| 2 | 678 | >617-742 | 31 | 82 | 0.92 (0.51-1.6) | 0.87 (0.49-1.6) | 0.86 (0.47-1.6) | |
| 3 | 815 | >742-894 | 34 | 82 | 1.0 (0.60-1.8) | 1.0 (0.56-1.8) | 0.99 (0.55-1.8) | |
| 4 | 980 | >894-1121 | 46 | 82 | 1.4 (0.81-2.5) | 1.3 (0.71-2.2) | 1.3 (0.71-2.3) | |
| 5 | 1385 | >1121-5322 | 61 | 82 | 1.9 (1.1-3.2) | 1.6 (0.94-2.9) | 1.6 (0.91-2.9) | |
| Immunotoxic congenerse | ||||||||
| 1d | 94 | 24-113 | 32 | 81 | 1.0 | 1.0 | 1.0 | P = 0.09 |
| 2 | 130 | >113-145 | 35 | 82 | 1.1 (0.60-1.9) | 0.98 (0.55-1.8) | 0.98 (0.54-1.8) | |
| 3 | 167 | >145-189 | 36 | 82 | 1.1 (0.63-1.9) | 1.0 (0.56-1.8) | 0.99 (0.55-1.8) | |
| 4 | 215 | >189-245 | 45 | 82 | 1.4 (0.80-2.4) | 1.2 (0.69-2.2) | 1.2 (0.64-2.1) | |
| 5 | 325 | >245-1813 | 57 | 82 | 1.8 (1.0-3.1) | 1.5 (0.84-2.7) | 1.4 (0.80-2.6) | |
| Σ (118, 138, 153, 180) | ||||||||
| 1d | 232 | 35-275 | 31 | 81 | 1.0 | 1.0 | 1.0 | P < 0.01 |
| 2 | 315 | >275-344 | 32 | 82 | 1.0 (0.56-1.8) | 0.96 (0.53-1.7) | 0.96 (0.53-1.8) | |
| 3 | 380 | >344-423 | 36 | 82 | 1.2 (0.65-2.1) | 1.1 (0.59-1.9) | 1.1 (0.60-2.0) | |
| 4 | 472 | >423-525 | 38 | 82 | 1.2 (0.69-2.2) | 1.1 (0.60-2.0) | 1.1 (0.59-2.1) | |
| 5 | 671 | >525-2440 | 68 | 82 | 2.1 (1.2-3.6) | 1.8 (1.0-3.2) | 1.8 (1.0-3.2) | |
| PCB 118 | ||||||||
| 1d | 33 | 4.0-42 | 33 | 81 | 1.0 | 1.0 | 1.0 | P = 0.15 |
| 2 | 48 | >42-56 | 29 | 82 | 0.86 (0.47-1.6) | 0.84 (0.45-1.6) | 0.80 (0.42-1.5) | |
| 3 | 67 | >56-77 | 40 | 82 | 1.2 (0.67-2.1) | 1.1 (0.61-1.9) | 1.1 (0.59-2.0) | |
| 4 | 90 | >77-105 | 46 | 82 | 1.4 (0.77-2.4) | 1.2 (0.70-2.2) | 1.2 (0.63-2.2) | |
| 5 | 139 | >105-734 | 57 | 82 | 1.7 (1.0-2.9) | 1.5 (0.82-2.6) | 1.4 (0.76-2.5) | |
| PCB 138 | ||||||||
| 1d | 46 | 4.0-59 | 29 | 81 | 1.0 | 1.0 | 1.0 | P = 0.02 |
| 2 | 67 | >59-76 | 38 | 82 | 1.3 (0.74-2.4) | 1.2 (0.69-2.3) | 1.3 (0.68-2.3) | |
| 3 | 87 | >76-97 | 38 | 82 | 1.3 (0.75-2.4) | 1.2 (0.67-2.2) | 1.2 (0.64-2.1) | |
| 4 | 107 | >97-122 | 37 | 82 | 1.3 (0.72-2.3) | 1.2 (0.62-2.1) | 1.2 (0.64-2.2) | |
| 5 | 161 | >122-541 | 63 | 82 | 2.2 (1.3-3.8) | 1.9 (1.0-3.3) | 1.8 (0.98-3.2) | |
| PCB 153 | ||||||||
| 1d | 80 | 6.1-95 | 28 | 81 | 1.0 | 1.0 | 1.0 | P < 0.01 |
| 2 | 108 | >95-122 | 37 | 82 | 1.3 (0.73-2.4) | 1.3 (0.69-2.3) | 1.2 (0.67-2.3) | |
| 3 | 134 | >121-148 | 36 | 82 | 1.4 (0.74-2.5) | 1.3 (0.69-2.3) | 1.3 (0.68-2.4) | |
| 4 | 167 | >148-188 | 37 | 82 | 1.3 (0.73-2.4) | 1.2 (0.63-2.2) | 1.2 (0.62-2.2) | |
| 5 | 242 | >188-761 | 67 | 82 | 2.4 (1.4-4.2) | 2.1 (1.2-3.7) | 2.1 (1.1-3.8) | |
| PCB 180 | ||||||||
| 1d | 57 | 21-68 | 25 | 81 | 1.0 | 1.0 | 1.0 | P < 0.01 |
| 2 | 76 | >68-84 | 40 | 82 | 1.6 (0.88-2.8) | 1.5 (0.84-2.7) | 1.5 (0.82-2.7) | |
| 3 | 92 | >84-102 | 35 | 82 | 1.4 (0.75-2.6) | 1.4 (0.74-2.5) | 1.4 (0.75-2.7) | |
| 4 | 111 | >102-126 | 44 | 82 | 1.7 (0.94-3.1) | 1.6 (0.90-2.9) | 1.8 (0.96-3.3) | |
| 5 | 154 | >126-528 | 61 | 82 | 2.4 (1.4-4.3) | 2.2 (1.22-3.9) | 2.4 (1.3-4.5) | |
| p,p′-DDE | ||||||||
| 1d | 724 | 43-1045 | 37 | 81 | 1.0 | 1.0 | 1.0 | P = 0.70 |
| 2 | 1369 | >1045-1741 | 37 | 82 | 1.0 (0.58-1.7) | 0.97 (0.56-1.7) | 0.97 (0.55-1.7) | |
| 3 | 2181 | >1741-2523 | 52 | 82 | 1.4 (0.83-2.5) | 1.5 (0.83-2.6) | 1.4 (0.78-2.5) | |
| 4 | 2972 | >2523-3595 | 29 | 82 | 0.78 (0.44-1.4) | 0.78 (0.43-1.4) | 0.71 (0.39-1.3) | |
| 5 | 4830 | >3595-18,937 | 50 | 82 | 1.3 (0.79-2.3) | 1.4 (0.80-2.4) | 1.3 (0.74-2.3) |
Adjusted for region (Northeast, Midwest, West, South, Panama/Puerto Rico).
Additionally adjusted for BMI (in tertiles), smoking (never, current, past), alcohol intake (daily, weekly, monthly, rarely/never), height (inches).
Test for trend modeling natural log of lipid-adjusted concentration as a continuous variable for the fully adjusted model.
Reference category.
The immunotoxic congeners include PCBs 66, 74, 105, 118, 156, and 167.
Figure.
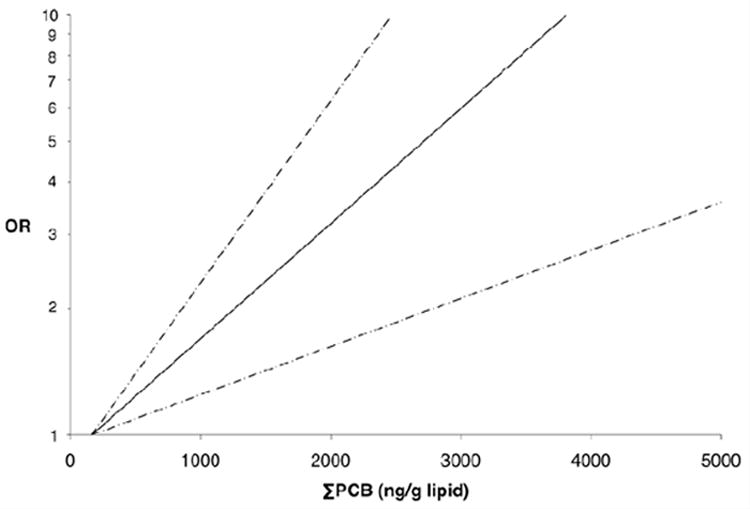
Association between ΣPCB and non-Hodgkin lymphoma; OR (solid line) and 95% CI (dashed line).
When we compared main effect estimates for the major histologic subtypes, associations seemed somewhat stronger for the diffuse large B-cell lymphoma and follicular lymphoma subtypes (Table 4). There was no evidence of statistical heterogeneity in effects, however (for all tests for heterogeneity, P-values > 0.35). Statistical power was limited for subtype analyses.
Table 4.
Association of PCB & p-p′-DDE exposure (tertiles) with non-Hodgkin lymphoma subtypes.
| Exposure tertile | Diffuse large B-cell lymphoma |
Follicular lymphoma |
Chronic lymphocytic leukemia/small lymphocytic lymphoma |
Test for heterogeneityb | ||||
|---|---|---|---|---|---|---|---|---|
| No. controls | No. cases | OR (95% CI)a | No. cases | OR (95% CI)a | No. cases | OR (95% CI)a | ||
| Σ PCB | P = 0.36 | |||||||
| 1c | 136 | 6 | 1.0 | 6 | 1.0 | 15 | 1.0 | |
| 2 | 137 | 12 | 2.1 (0.77-6.0) | 7 | 1.1 (0.37-3.5) | 21 | 1.4 (0.67-2.8) | |
| 3 | 136 | 17 | 3.1 (1.2-8.3) | 14 | 2.3 (0.85-6.3) | 21 | 1.4 (0.69-2.9) | |
| Test for trendd | 0.01 | 0.07 | 0.25 | |||||
| Immunotoxic congenerse | P = 0.46 | |||||||
| 1c | 136 | 9 | 1.0 | 6 | 1.0 | 17 | 1.0 | |
| 2 | 137 | 8 | 0.98 (0.37-2.7) | 9 | 1.6 (0.53-4.5) | 16 | 0.98 (0.47-2.0) | |
| 3 | 136 | 18 | 2.3 (0.99-5.5) | 12 | 2.0 (0.72-5.7) | 24 | 1.5 (0.75-3.0) | |
| Test for trendd | 0.03 | 0.44 | 0.41 | |||||
| Σ (118, 138, 153, 180) | P = 0.44 | |||||||
| 1c | 136 | 6 | 1.0 | 4 | 1.0 | 14 | 1.0 | |
| 2 | 137 | 11 | 1.9 (0.69-5.4) | 8 | 2.0 (0.57-6.7) | 20 | 1.4 (0.68-2.9) | |
| 3 | 136 | 18 | 3.3 (1.3-8.6) | 15 | 3.7 (1.2-11.5) | 23 | 1.7 (0.83-3.5) | |
| Test for trendd | <0.01 | 0.09 | 0.11 | |||||
| PCB 118 | P = 0.43 | |||||||
| 1c | 136 | 9 | 1.0 | 7 | 1.0 | 17 | 1.0 | |
| 2 | 137 | 9 | 1.1 (0.42-2.9) | 9 | 1.2 (0.45-3.5) | 16 | 0.96 (0.46-2.0) | |
| 3 | 136 | 17 | 2.2 (0.91-5.1) | 11 | 1.6 (0.58-4.3) | 24 | 1.5 (0.76-3.0) | |
| Test for trendd | 0.03 | 0.61 | 0.41 | |||||
| PCB 138 | P = 0.48 | |||||||
| 1c | 136 | 7 | 1.0 | 6 | 1.0 | 17 | 1.0 | |
| 2 | 137 | 11 | 1.6 (0.60-4.3) | 6 | 0.99 (0.31-3.2) | 16 | 0.94 (0.45-2.0) | |
| 3 | 136 | 17 | 2.6 (1.0-6.4) | 15 | 2.5 (0.93-6.7) | 24 | 1.4 (0.74-2.8) | |
| Test for trendd | 0.01 | 0.08 | 0.15 | |||||
| PCB 153 | P = 0.40 | |||||||
| 1c | 136 | 6 | 1.0 | 5 | 1.0 | 15 | 1.0 | |
| 2 | 137 | 13 | 2.4 (0.86-6.5) | 7 | 1.3 (0.41-4.3) | 18 | 1.2 (0.56-2.4) | |
| 3 | 136 | 16 | 2.9 (1.1-7.8) | 15 | 2.8 (0.99-8.1) | 24 | 1.6 (0.81-3.3) | |
| Test for trendd | <0.01 | 0.12 | 0.10 | |||||
| PCB 180 | P = 0.84 | |||||||
| 1c | 136 | 5 | 1.0 | 6 | 1.0 | 16 | 1.0 | |
| 2 | 137 | 17 | 3.7 (1.3-10.5) | 6 | 0.87 (0.27-2.8) | 19 | 1.1 (0.56-2.4) | |
| 3 | 136 | 13 | 2.8 (0.96-8.2) | 15 | 2.3 (0.84-6.1) | 22 | 1.4 (0.68-2.8) | |
| Test for trendd | 0.02 | 0.05 | 0.04 | |||||
| p,p′-DDE | P = 0.42 | |||||||
| 1c | 136 | 10 | 1.0 | 8 | 1.0 | 20 | 1.0 | |
| 2 | 137 | 13 | 1.3 (0.55-3.1) | 8 | 1.0 (0.37-2.8) | 25 | 1.2 (0.65-2.3) | |
| 3 | 136 | 12 | 1.2 (0.51-3.0) | 11 | 1.4 (0.56-3.8) | 12 | 0.62 (0.29-1.3) | |
| Test for trendd | 0.33 | 0.71 | 0.48 | |||||
Polytomous logistic regression models controlling for matching factors (race (white/non-white), age at blood draw, year & month of blood draw, fasting status at blood draw).
Test for heterogeneity considering the natural log-transformed lipid-adjusted concentration as a continuous variable.
Reference category.
Test for trend modeling natural log of lipid-adjusted concentration as a continuous variable.
The immunotoxic congeners include PCBs 66, 74, 105, 118, 156, and 167.
Results from analyses stratified on geographic region, BMI, follow-up period, age at diagnosis, and smoking history are presented for ΣPCB categorized in tertiles in eTable 2 (http://links.lww.com). Increased risk of non-Hodgkin lymphoma was associated with increasing levels of PCB exposure in all regions except the Northeast. There was no clear effect of time-to-diagnosis on the PCB-non-Hodgkin lymphoma association. The association between ΣPCB and non-Hodgkin lymphoma appeared to be somewhat stronger in men 66 years of age or younger and among never-smokers. In all models, however, the tests for interaction were modest (all P-values > 0.15).
eTable 2.
Association of PCB exposure (tertiles) with non-Hodgkin lymphoma, stratified on various risk factors.
| Strata | Tertile 1 (162.8-697.42 ng/g) |
Tertile 2 (697.43-947.9 ng/g) |
Tertile 3 (949.5-5321.8 ng/g) |
p for trend1 | p for interaction2 | ||||||
|---|---|---|---|---|---|---|---|---|---|---|---|
| cases | controls | OR (ref) | cases | controls | OR* (95% CI) | cases | controls | OR* (95% CI) | |||
| Region | 0.93 | ||||||||||
| Northeast | 9 | 12 | 1.0 | 15 | 31 | 0.65 (0.22-2.0) | 36 | 53 | 0.99 (0.36-2.7) | 0.16 | |
| Midwest | 16 | 30 | 1.0 | 14 | 32 | 0.87 (0.34-2.3) | 24 | 32 | 1.6 (0.67-3.6) | 0.10 | |
| South | 15 | 39 | 1.0 | 17 | 34 | 1.4 (0.57-3.2) | 21 | 33 | 1.6 (0.72-3.7) | 0.03 | |
| West | 16 | 53 | 1.0 | 12 | 37 | 0.94 (0.38-2.3) | 9 | 18 | 1.5 (0.52-4.1) | 0.84 | |
| BMI (tertiles) | 0.17 | ||||||||||
| Tertile 1 | 13 | 45 | 1.0 | 18 | 44 | 2.0 (0.81-4.7) | 28 | 48 | 2.6 (1.2-5.9) | <0.01 | |
| Tertile 2 | 18 | 45 | 1.0 | 19 | 39 | 1.1 (0.48-2.4) | 21 | 50 | 0.93 (0.43-2.0) | 0.56 | |
| Tertile 3 | 26 | 46 | 1.0 | 21 | 54 | 0.72 (0.35-1.5) | 41 | 38 | 2.1 (1.1-4.2) | <0.01 | |
| Follow-up period | 0.29 | ||||||||||
| ≤ 12 years | 32 | 78 | 1.0 | 30 | 57 | 1.3 (0.69-2.4) | 39 | 67 | 1.4 (0.80-2.6) | 0.02 | |
| > 12 years | 25 | 58 | 1.0 | 28 | 80 | 0.78 (0.41-1.5) | 51 | 69 | 1.7 (0.91-3.0) | 0.03 | |
| 0.77 | |||||||||||
| ≤5 years | 11 | 27 | 1.0 | 10 | 27 | 0.93 (0.32-2.7) | 15 | 18 | 2.1 (0.74-6.0) | 0.02 | |
| > 5 years | 46 | 109 | 1.0 | 48 | 110 | 1.0 (0.62-1.7) | 75 | 118 | 1.5 (0.95-2.3) | 0.01 | |
| Age at diagnosis (or index age) | 0.39 | ||||||||||
| ≤ 66 years | 28 | 78 | 1.0 | 23 | 55 | 1.2 (0.60-2.3) | 46 | 61 | 2.1 (1.2-3.9) | <0.01 | |
| > 66 years | 29 | 58 | 1.0 | 35 | 82 | 0.85 (0.47-1.6) | 44 | 75 | 1.2 (0.65-2.1) | 0.16 | |
| Smoking history | 0.30 | ||||||||||
| Never | 30 | 68 | 1.0 | 24 | 69 | 0.78 (0.41-1.5) | 47 | 62 | 1.8 (0.99-3.2) | <0.01 | |
| Past/current | 27 | 68 | 1.0 | 34 | 67 | 1.2 (0.64-2.2) | 43 | 73 | 1.4 (0.79-2.6) | 0.18 | |
Unconditional logistic regression models controlling for matching factors (race (white/non-white), age at blood draw, month & year of blood draw, fasting status at blood draw).
Test for trend modeled natural log of lipid-adjusted organochlorine as continuous variable.
Likelihood ratio test comparing the main effects model with model including the main effects and terms for each level of the stratification variable cross-classified with tertiles of PCBs.
Discussion
Consistent with previous reports,6,7,15-17 we found evidence of a positive association between plasma concentrations of PCBs and risk of non-Hodgkin lymphoma. We observed dose-response trends in risk for four individual PCB congeners (118, 138, 153, and 180) as well as ΣPCB, the sum of the four most prevalent PCB congeners (118, 138, 153, and 180), and the group of PCBs defined by potential immunotoxicity. In contrast, no association was observed for the pesticide p,p′-DDE.
PCB 180 showed the strongest association with risk of non-Hodgkin lymphoma among the four individual congeners evaluated, which is similar to results from two case-control studies.6,15 In contrast, Engel et al7 reported the strongest associations for PCBs 118, 138, and 153, with weaker effects for PCB 180. We too found increased risks of non-Hodgkin lymphoma associated with PCBs 118, 138, and 153. Strong correlations between measured PCB congeners limited our ability to separate out the effects of individual congeners.
The biologic mechanism of action of PCB carcinogenicity has not been elucidated. It may include induction of gene expression through binding of the aryl hydrocarbon receptor (AhR), indirect stimulation of cell proliferation, or immunosuppression.9,13,14,26 The various PCB congeners may produce health effects by different mechanisms.9,24 Although we found a positive association for ΣPCB and the sum of the four most prevalent congeners, the association with the “immunotoxic” congeners was somewhat weaker. This group of congeners was defined a priori and proposed as a functional group based on chemical structure and suspected immunotoxicity.24 Other PCB congeners, however, have also been demonstrated to have immunotoxic properties, including PCBs 138, 153, and 180.13,14 These congeners are detected at higher levels and therefore may be measured with more precision. Because altered immune function is the most well-established risk factor for non-Hodgkin lymphoma and because PCBs are known to induce immune effects in animals and humans,9,14 immunotoxicity is a biologically plausible etiologic hypothesis. In support of this hypothesis, there have been three reports of a positive interaction between elevated concentrations of PCBs and elevated titers of antibodies against the Epstein-Barr virus associated with risk of non-Hodgkin lymphoma.16,17,27
Adjustment for geographic region generally attenuated effect estimates, although linear trends remained apparent. PCBs were used mainly in the Midwest and Northeastern regions of the U.S.; therefore, including region in the model may represent overadjustment because adjusting for region removes some of the variability in exposure distribution.
Several suspected risk factors for non-Hodgkin lymphoma, including smoking, alcohol intake, BMI, and height, did not confound the association between PCBs and non-Hodgkin lymphoma. We cannot rule out unmeasured confounding by factors such as diet (other than fish consumption), family history of lymphoma, history of metabolic disorders or immune diseases (such as Epstein-Barr virus infection), and other chemical exposures. In the general population, the primary source of PCB exposure is fish consumption. There has been some recent evidence that fish consumption may be slightly protective against non-Hodgkin lymphoma28-30 while other studies have found no association.31,32 Among participants with data on fish intake, we found no evidence of confounding by fish consumption.
There may be residual or unmeasured confounding by other bioaccumulating compounds, such as organochlorine pesticides. The lack of apparent association between p-p′-DDE (the most persistent organochlorine pesticide) and risk of non-Hodgkin lymphoma in this study, however, suggests that the magnitude of potential confounding is likely to be small.
A strength of this study was the prospective measurement of plasma PCB concentrations. Some6,15,16 but not all5,18 retrospective case-control studies (those not nested in cohort studies) based on measurements of PCBs in biologic samples have reported positive associations between PCBs and non-Hodgkin lymphoma. Non-Hodgkin lymphoma (or treatment of the disease) may affect metabolism and blood concentrations of PCBs,33 which could account for the discrepant results in analyses based on biological samples obtained after diagnosis.
Recent evidence has suggested possible etiologic heterogeneity among non-Hodgkin lymphoma subtypes.34 We were able to explore the association between PCBs and non-Hodgkin lymphoma by major histologic subtype. While effect estimates appeared somewhat stronger for the diffuse large B-cell lymphoma and follicular lymphoma subtypes compared with the chronic lymphocytic leukemia/small lymphocytic lymphoma subtype, we found no statistical evidence of heterogeneity. This is consistent with reports from two recent retrospective case-control studies.5,6 With relatively few cases of each major histologic subtype, power to detect associations with specific non-Hodgkin lymphoma subtypes was limited, and we could not evaluate effects for less common subtypes.
Lack of information on the timing of exposure is a potential limitation of this study. Organochlorine concentrations were measured in blood samples collected in the early 1980s; PCBs were banned in the U.S. in 1977. Because they are persistent in the environment and in biologic media and have long half-lives, however, a single measurement likely represents cumulative exposure over time.9 In addition, men enrolled in the Physicians’ Health Study were alive during the period of peak manufacture and use of PCBs.9,35 Previous reports have suggested that risk of non-Hodgkin lymphoma may be highest in the period closest to blood draw.7 We found no clear evidence of effect modification by time to diagnosis in our study.
A growing body of literature supports a positive association between PCBs and risk of non-Hodgkin lymphoma. Future biomarker studies that focus on specific congener effects and histologic subtype may provide additional insight regarding the observed association and whether it is causal. Evaluation of the potential interaction between PCBs and serologic markers of Epstein-Barr virus infection on risk of non-Hodgkin lymphoma will also help elucidate the potential biological mechanism. Polymorphisms in genes related to immune function,2,36 including the AhR gene,37 may also influence the association between PCBs and non-Hodgkin lymphoma.
Acknowledgments
We thank Hans-Olov Adami for his helpful comments on an earlier draft of this manuscript.
Sources of Financial Support: Supported by the Training Program in Environmental Health Sciences [T32 ES007155 to K.A.B.] and by the National Institutes of Health [CA098122, CA34944, CA40360, HL26490, HL34595, and CA097193].
References
- 1.Ries LAG, Melbert D, Krapcho M, et al., editors. SEER Cancer Statistics Review, 1975-2004. Bethesda, MD: National Cancer Institute; 2007. [Google Scholar]
- 2.Grulich AE, Vajdic CM. The epidemiology of non-Hodgkin lymphoma. Pathology. 2005;37:409–419. doi: 10.1080/00313020500370192. [DOI] [PubMed] [Google Scholar]
- 3.Hartge P, Devesa SS. Quantification of the impact of known risk factors on time trends in non-Hodgkin’s lymphoma incidence. Cancer Res. 1992;52:5566s–5569s. [PubMed] [Google Scholar]
- 4.Eltom MA, Jemal A, Mbulaiteye SM, Devesa SS, Biggar RJ. Trends in Kaposi’s sarcoma and non-Hodgkin’s lymphoma incidence in the United States from 1973 through 1998. J Natl Cancer Inst. 2002;94:1204–1210. doi: 10.1093/jnci/94.16.1204. [DOI] [PubMed] [Google Scholar]
- 5.Cocco P, Brennan P, Ibba A, et al. Plasma polychlorobiphenyl and organochlorine pesticide level and risk of major lymphoma subtypes. Occup Environ Med. 2008;65:132–140. doi: 10.1136/oem.2007.033548. [DOI] [PubMed] [Google Scholar]
- 6.Spinelli JJ, Ng CH, Weber JP, et al. Organochlorines and risk of non-Hodgkin lymphoma. Int J Cancer. 2007;121:2767–2775. doi: 10.1002/ijc.23005. [DOI] [PubMed] [Google Scholar]
- 7.Engel LS, Laden F, Andersen A, et al. Polychlorinated biphenyl levels in peripheral blood and non-Hodgkin’s lymphoma: a report from three cohorts. Cancer Res. 2007;67:5545–5552. doi: 10.1158/0008-5472.CAN-06-3906. [DOI] [PubMed] [Google Scholar]
- 8.Engel LS, Lan Q, Rothman N. Polychlorinated biphenyls and non-Hodgkin lymphoma. Cancer Epidemiol Biomarkers Prev. 2007;16:373–376. doi: 10.1158/1055-9965.EPI-07-0055. [DOI] [PubMed] [Google Scholar]
- 9.Agency for Toxic Substances and Disease Registry (ATSDR) Toxicological Profile for Polychlorinated Biphenyls (PCBs) Atlanta, GA: U.S. Department of Health and Human Services, Agency for Toxic Substances and Disease Registry; 2000. [PubMed] [Google Scholar]
- 10.Agency for Toxic Substances and Disease Registry (ATSDR) Toxicological Profile for DDT, DDE, and DDD. Atlanta, GA: U.S. Department of Health and Human Services, Agency for Toxic Substances and Disease Registry; 2002. [Google Scholar]
- 11.U.S. Environmental Protection Agency (EPA) PCBs: Cancer Dose-Response Assessment and Application to Environmental Mixtures. Washington, DC: National Center for Environmental Assessment; Sep, 1996. [Google Scholar]
- 12.International Agency for Research on Cancer (IARC) Polychlorinated biphenyls and polybrominated biphenyls. Lyon, France: IARC; 1978. [Google Scholar]
- 13.Daniel V, Huber W, Bauer K, Suesal C, Conradt C, Opelz G. Associations of blood levels of PCB, HCHS, and HCB with numbers of lymphocyte subpopulations, in vitro lymphocyte response, plasma cytokine levels, and immunoglobulin autoantibodies. Environ Health Perspect. 2001;109:173–178. doi: 10.1289/ehp.01109173. [DOI] [PMC free article] [PubMed] [Google Scholar]
- 14.Van Den Heuvel RL, Koppen G, Staessen JA, et al. Immunologic biomarkers in relation to exposure markers of PCBs and dioxins in Flemish adolescents (Belgium) Environ Health Perspect. 2002;110:595–600. doi: 10.1289/ehp.02110595. [DOI] [PMC free article] [PubMed] [Google Scholar]
- 15.De Roos AJ, Hartge P, Lubin JH, et al. Persistent organochlorine chemicals in plasma and risk of non-Hodgkin’s lymphoma. Cancer Res. 2005;65:11214–11226. doi: 10.1158/0008-5472.CAN-05-1755. [DOI] [PubMed] [Google Scholar]
- 16.Hardell E, Eriksson M, Lindstrom G, et al. Case-control study on concentrations of organohalogen compounds and titers of antibodies to Epstein-Barr virus antigens in the etiology of non-Hodgkin lymphoma. Leuk Lymphoma. 2001;42:619–629. doi: 10.3109/10428190109099322. [DOI] [PubMed] [Google Scholar]
- 17.Rothman N, Cantor KP, Blair A, et al. A nested case-control study of non-Hodgkin lymphoma and serum organochlorine residues. Lancet. 1997;350:240–244. doi: 10.1016/S0140-6736(97)02088-6. [DOI] [PubMed] [Google Scholar]
- 18.Quintana PJ, Delfino RJ, Korrick S, et al. Adipose tissue levels of organochlorine pesticides and polychlorinated biphenyls and risk of non-Hodgkin’s lymphoma. Environ Health Perspect. 2004;112:854–861. doi: 10.1289/ehp.6726. [DOI] [PMC free article] [PubMed] [Google Scholar]
- 19.Swerdlow SH, Campo E, Harris NL, et al., editors. WHO Classification of Tumours of Haematopoietic and Lymphoid Tissues. Lyon, France: International Agency for Research on Cancer (IARC) Press; 2008. [Google Scholar]
- 20.Willett WC, Sampson L, Stampfer MJ, et al. Reproducibility and validity of a semiquantitative food frequency questionnaire. Am J Epidemiol. 1985;122:51–65. doi: 10.1093/oxfordjournals.aje.a114086. [DOI] [PubMed] [Google Scholar]
- 21.Korrick SA, Altshul LM, Tolbert PE, Burse VW, Needham LL, Monson RR. Measurement of PCBs, DDE, and hexachlorobenzene in cord blood from infants born in towns adjacent to a PCB-contaminated waste site. J Expo Anal Environ Epidemiol. 2000;10:743–754. doi: 10.1038/sj.jea.7500120. [DOI] [PubMed] [Google Scholar]
- 22.Kim R, Aro A, Rotnitzky A, Amarasiriwardena C, Hu H. K x-ray fluorescence measurements of bone lead concentration: the analysis of low-level data. Phys Med Biol. 1995;40:1475–1485. doi: 10.1088/0031-9155/40/9/007. [DOI] [PubMed] [Google Scholar]
- 23.Phillips DL, Pirkle JL, Burse VW, Bernert JT, Jr, Henderson LO, Needham LL. Chlorinated hydrocarbon levels in human serum: effects of fasting and feeding. Arch Environ Contam Toxicol. 1989;18:495–500. doi: 10.1007/BF01055015. [DOI] [PubMed] [Google Scholar]
- 24.Wolff MS, Camann D, Gammon M, Stellman SD. Proposed PCB congener groupings for epidemiological studies. Environ Health Perspect. 1997;105:13–14. doi: 10.1289/ehp.9710513. [DOI] [PMC free article] [PubMed] [Google Scholar]
- 25.Durrleman S, Simon R. Flexible regression models with cubic splines. Stat Med. 1989;8:551–561. doi: 10.1002/sim.4780080504. [DOI] [PubMed] [Google Scholar]
- 26.Knerr S, Schrenk D. Carcinogenicity of “non-dioxinlike” polychlorinated biphenyls. Crit Rev Toxicol. 2006;36:663–694. doi: 10.1080/10408440600845304. [DOI] [PubMed] [Google Scholar]
- 27.Nordstrom M, Hardell L, Lindstrom G, Wingfors H, Hardell K, Linde A. Concentrations of organochlorines related to titers to Epstein-Barr virus early antigen IgG as risk factors for hairy cell leukemia. Environ Health Perspect. 2000;108:441–445. doi: 10.1289/ehp.108-1638040. [DOI] [PMC free article] [PubMed] [Google Scholar]
- 28.Chiu BC, Cerhan JR, Folsom AR, et al. Diet and risk of non-Hodgkin lymphoma in older women. JAMA. 1996;275:1315–1321. doi: 10.1001/jama.1996.03530410029029. [DOI] [PubMed] [Google Scholar]
- 29.Fritschi L, Ambrosini GL, Kliewer EV, Johnson KC. Dietary fish intake and risk of leukaemia, multiple myeloma, and non-Hodgkin lymphoma. Cancer Epidemiol Biomarkers Prev. 2004;13:532–537. [PubMed] [Google Scholar]
- 30.Zheng T, Holford TR, Leaderer B, et al. Diet and nutrient intakes and risk of non-Hodgkin’s lymphoma in Connecticut women. Am J Epidemiol. 2004;159:454–466. doi: 10.1093/aje/kwh067. [DOI] [PubMed] [Google Scholar]
- 31.Chang ET, Smedby KE, Zhang SM, et al. Dietary factors and risk of non-hodgkin lymphoma in men and women. Cancer Epidemiol Biomarkers Prev. 2005;14:512–520. doi: 10.1158/1055-9965.EPI-04-0451. [DOI] [PubMed] [Google Scholar]
- 32.Purdue MP, Bassani DG, Klar NS, Sloan M, Kreiger N. Dietary factors and risk of non-Hodgkin lymphoma by histologic subtype: a case-control analysis. Cancer Epidemiol Biomarkers Prev. 2004;13:1665–1676. [PubMed] [Google Scholar]
- 33.Baris D, Kwak LW, Rothman N, et al. Blood levels of organochlorines before and after chemotherapy among non-Hodgkin’s lymphoma patients. Cancer Epidemiol Biomarkers Prev. 2000;9:193–197. [PubMed] [Google Scholar]
- 34.Morton LM, Wang SS, Cozen W, et al. Etiologic heterogeneity among non-Hodgkin lymphoma subtypes. Blood. 2008;112:5150–5160. doi: 10.1182/blood-2008-01-133587. [DOI] [PMC free article] [PubMed] [Google Scholar]
- 35.Breivik K, Sweetman A, Pacyna JM, Jones KC. Towards a global historical emission inventory for selected PCB congeners--a mass balance approach. 1. Global production and consumption. Sci Total Environ. 2002;290:181–198. doi: 10.1016/s0048-9697(01)01075-0. [DOI] [PubMed] [Google Scholar]
- 36.Colt JS, Rothman N, Severson RK, et al. Organochlorine exposure, immune gene variation, and risk of non-Hodgkin lymphoma. Blood. 2009;113:1899–1905. doi: 10.1182/blood-2008-04-153858. [DOI] [PMC free article] [PubMed] [Google Scholar]
- 37.Ng C, Janoo-Gilani R, Brooks-Wilson AR, et al. Interaction between plasma organochlorines and the AHR gene and risk of non-Hodgkin lymphoma [Abstract] American Journal of Epidemiology. 2008;167:S59. [Google Scholar]