

Abstract
Sensory circuits frequently integrate converging inputs while maintaining precise functional relationships between them. For example, in mammals with stereopsis, neurons at the first stages of binocular visual processing show a close alignment of receptive-field properties for each eye. Still, basic questions about the global wiring mechanisms that enable this functional alignment remain unanswered, including whether the addition of a second retinal input to an otherwise monocular neural circuit is sufficient for the emergence of these binocular properties. We addressed this question by inducing a de novo binocular retinal projection to the larval zebrafish optic tectum and examining recipient neuronal populations using in vivo two-photon calcium imaging. Notably, neurons in rewired tecta were predominantly binocular and showed matching direction selectivity for each eye. We found that a model based on local inhibitory circuitry that computes direction selectivity using the topographic structure of both retinal inputs can account for the emergence of this binocular feature.
During sensory processing, information from several distinct sources often converges onto neural circuits that are responsible for the performance of novel computations. This kind of integrative processing can be unimodal, as with binocularity1-5, or multimodal, combining visual, auditory and somatosensory information6-8. Although integrative circuits have been well characterized, the global developmental rules underlying their coherent organization remain unclear.
Binocular neural circuits are particularly well suited for the study of integrative processing because of their accessibility, the independence of each retina and the clearly defined stimulus space. The unique properties of these circuits were first described in a series of pioneering experiments in 1962 (ref. 1). From this and other studies, it is known that neurons in the first stages of binocular processing not only integrate visual information from both eyes, but that a majority of these neurons also show a marked alignment of receptive-field properties for each eye with respect to retinotopic position, direction and orientation selectivity2-5. In the case of directional tuning, this means that binocular neurons that are tuned to a particular direction of visual motion in one eye show selectivity to the same direction of motion in the other eye. A similar functional alignment is observed between visual, auditory and somatosensory inputs in multimodal areas6-8, suggesting that this coherent processing may be the manifestation of a general wiring principle for connecting convergent inputs into integrative neural circuits. Although data from several studies suggest that binocular functional alignment may result from the registered retinotopic projection of information from each eye onto specialized processing modules9,10, this has been very difficult to assess directly.
To elucidate these wiring mechanisms, we took advantage of the pliability and optical accessibility of the larval zebrafish nervous system and examined the functional properties that emerge in response to a de novo introduction of additional visual input to a central brain circuit. Specifically, we artificially induced a second retinal projection to the otherwise monocular larval zebrafish optic tectum and carried out in vivo two-photon calcium imaging of recipient neuronal populations11,12. Although several seminal studies have used similar retinotectal rewiring techniques to provide important anatomical insights into developmental plasticity13-15, we present, to the best of our knowledge, the first functional analysis of these circuits to test the sufficiency of retinotectal rewiring for the emergence of binocular receptive-field properties.
RESULTS
Binocular rewiring of the zebrafish retinotectal circuit
Although each zebrafish tectal lobe only receives monocular input from the contralateral retina (Fig. 1a), we found that an additional ipsilateral retinotectal projection could also be established by the surgical removal of a single tectal lobe. Surgeries performed at 2 d post-fertilization (dpf), before complete retinal innervation, resulted in binocular afferent zones by 8 dpf (Fig. 1b). As has been described previously in other systems, binocular projections were segregated, forming eye-specific subregions13-16 (Fig. 1c). Notably, these subregions segregated along the proximal-distal dendritic axes of tectal neurons, possibly compartmentalizing eye-specific synaptic inputs onto individual tectal neurons.
Figure 1.

Functional analysis of the rewired larval zebrafish retinotectal circuit. (a) Monocular, contralateral retinal arborization fields in the left (DiI, blue) and right (DiD, red) optic tecta of an 8-dpf larval zebrafish. Dashed colored lines represent the crossing of optic nerves through the optic chiasm. Scale bar represents 100 μm. (b) Surgical removal of the left tectal lobe induced rewiring of the right retina (blue) to caudal regions of the remaining ipsilateral tectal lobe. (c) Orthogonal cross-sections through a binocular tectal lobe demonstrating segregation of retinal afferents from each eye. Dashed gray lines in the xy plane demarcate the yz and xz planes chosen for optical sectioning. A schematic tectal neuron (white) illustrates the orientation of imaged neurons with respect to retinal afferents. Scale bar represents 40 μm. (d) Rewired zebrafish were imaged in vivo using a custom-built chamber that enables simultaneous visual stimulation and two-photon microscopy. Small moving spots (red arrow) were projected onto a cylindrical screen using a wide-angle lens. (e) Time-averaged intensity projection of tectal neurons labeled with a fluorescent calcium indicator. Schematic inset shows relationship to c. Scale bar represents 10 μm. (f) Dorsal view illustrating the imaged region of interest (black rectangle) and the color-coded moving stimuli with their corresponding iconic arrowhead representations below.
To examine the response properties of neurons in these dually innervated tecta, we developed a system for the binocular projection of visual stimuli during simultaneous in vivo calcium imaging using two-photon microscopy11,12, a technical requirement for imaging activity deep in intact nervous tissue with invisible excitation wavelengths (Fig. 1d). The tecta of rewired zebrafish were first bolus injected with a membrane-permeable calcium indicator at 7–8 dpf, which labeled hundreds of monopolar periventricular neurons with dendrites extending into the tectal neuropil (Fig. 1e). Using this indicator, fluorescence signals can serve as a proxy for neuronal spiking, a relationship that has previously been characterized12. Awake zebrafish were then immobilized for calcium imaging and presented with small (3°) spots moving along the horizontal axis of each eye from tail-to-head and head-to-tail (Fig. 1f). These stimuli are known to elicit robust neuronal activity with varying degrees of direction selectivity in the optic tectum12 and its mammalian homolog, the superior colliculus3,5.
Functional integration of binocular retinal inputs
We first confirmed that tectal neurons in normal larval zebrafish only responded to contralateral visual stimulation. As larval zebrafish lack both a direct and, unlike the frog17, indirect ipsilateral visual projection, tectal neurons were unresponsive to visual stimuli that were presented to the ipsilateral eye. Responses to simultaneous binocular stimulation were not different from responses to purely contralateral stimulation (data not shown). In contrast, many zebrafish tectal neurons were responsive to moving spots presented to either eye after rewiring (Supplementary Video 1 online), demonstrating that rerouted retinal fibers become functionally integrated into the tectal circuit. To quantify the responses of these neurons to contralateral and ipsilateral retinal stimulation, we calculated an ocular preference index (OPI, see Methods), a normalized ratiometric index analogous to those used to describe binocular visual circuits in mammals1,3,5. Here, purely ipsilaterally responsive neurons have an OPI of −1, neurons with equivalent or binocular responses for each eye have an OPI of 0, and purely contralaterally responsive neurons have an OPI of 1 (Fig. 2a). OPI values were unrelated to absolute fluorescence response magnitudes (Supplementary Fig. 1 online).
Figure 2.

Binocular functional integration in rewired tecta. (a) Representative fluorescence traces from neurons responsive to ipsilateral (top), binocular (middle) and contralateral (bottom) visual stimulation. Mean traces (black) are superimposed over five raw traces (gray). Blue and red arrowheads indicate ipsilateral and contralateral stimulation, respectively. Downward arrowheads represent tail-to-head (caudorostral) and upward arrowheads represent head-to-tail (rostrocaudal) moving visual stimuli. (b) Functional profiles for populations of neurons in six binocular tecta: three light reared (top) and three dark reared (bottom). Neurons are color-coded for responses to ipsilateral and contralateral stimulation. Blue neurons responded only to ipsilateral stimuli, red to only contralateral stimuli and purple to binocular stimuli. Color luminance increases with absolute response magnitude. Scale bar represents 10 μm. (c) Gray level–encoded OPI histograms for individual light- and dark-reared rewired zebrafish. Ipsilaterally responsive neurons have an OPI close to −1, contralaterally responsive neurons have an OPI close to 1 and binocular neurons have an OPI close to 0. (d) A histogram of OPIs for all neurons studied.
In rewired tecta, we found that the distribution of ocular preferences was highly organized. As has previously been described in the binocular visual cortex of mammals18, neuronal responses in rewired tecta varied smoothly between zones that were dominated by contralateral (red) OPIs and those with ipsilateral (blue) OPIs (Fig. 2b). This was true in both light- and dark-reared zebrafish. This challenges the notion that visual experience is required for the establishment of this binocular architecture19,20 but may still rely on spontaneous retinal waves21. Histograms of OPI distributions in individual zebrafish revealed that tectal populations were predominantly binocular (light rear: n = 8 fish, 680 neurons; dark rear: n = 4 fish, 545 neurons; Fig. 2c). The distribution of OPI values for all neurons was unimodal, with a slight contralateral bias (n = 12 fish, 1225 neurons; mean OPI = 0.06 ± 0.01 s.e.m.; Fig. 2d), and is notably similar to those measured in the superior colliculus and visual cortex of binocular mammals1,3,5.
Binocular retinotopy of tectal neuronal populations
Prior work in the adult goldfish following ipsilateral rewiring has reported topographic mapping of both ipsilateral and contralateral retinal inputs in the tectum22. However, it is unknown whether the visual receptive fields of recipient tectal populations are also retinotopically organized for each eye or whether binocular rewiring disrupts the topographic arrangement of spatial receptive fields among neighboring tectal neurons. We examined this functional topography by quantifying tectal activity patterns during the presentation of horizontally moving stimuli to each eye. If tectal neurons were organized with respect to their spatial receptive-field locations, we would expect to find a clear segregation of cell populations that were maximally active at adjacent time points (t1 and t2) during stimulation with moving spots12. In addition, given the known anatomical structure of the retinotectal projection, we expected rostrally located cells to be active before caudal cells during head-to-tail motion and for the reverse to hold true during tail-to-head directed motion.
Consistent with these predictions, we observed directed waves of activity moving across the tectum during stimulation of each eye with moving spots (Supplementary Video 1). This was illustrated by the response patterns of a representative tectal population to each visual stimulus (Fig. 3a). During stimulus presentation, neurons showed maximal fluorescence during one of two imaging time points (t1 or t2). Color-coding neurons by this time point of peak activity revealed a tight clustering and segregation of temporally coactive subpopulations. For individual zebrafish, the dynamic shifting of active tectal cells during visual stimulation was markedly similar for ipsilateral and contralateral stimulation. The position of active populations shifted caudally during head-to-tail stimulation, whereas a rostral shift was apparent during tail-to-head stimulation (n = 701 neurons from four light-reared and four dark-reared fish; Fig. 3b). We found that the change in the rostrocaudal center of mass (COM) of these subpopulations during a given stimulus was not significantly different for ipsilateral and contralateral stimulation (n = 11 fish; tail-to-head stimulus: ipsilateral ΔCOM = −22.59 μm ± 3.28, contralateral ΔCOM = −18.31 μm ± 2.93, P < 0.35; head-to-tail stimulus: ipsilateral ΔCOM = 17.79 μm ± 3.85, contralateral ΔCOM = 22.63 μm ± 3.22, P < 0.34; paired Student’s t test and s.e.m. in all cases; Fig. 3c). By dividing the visual-field angle (45°), crossed by the moving stimulus between these time points, with the distances measured, we derived a magnification factor relating the mapping of visual space onto the tectal surface. Averaged over all rewired zebrafish, magnification factors were similar to the magnification factor value observed in the monocular zebrafish optic tectum12 (tail-to-head stimulus: ipsilateral magnification factor = 1.99 deg μm−1 ± 0.28, contralateral magnification factor = 2.53 deg μm−1 ± 0.55; head-to-tail stimulus: ipsilateral magnification factor = 2.46 deg μm−1 ± 0.39, contralateral magnification factor = 1.99 deg μm−1 ± 0.29). These data demonstrate that ipsilaterally and contralaterally derived tectal circuits in rewired binocular zebrafish show markedly similar functional retinotopy.
Figure 3.
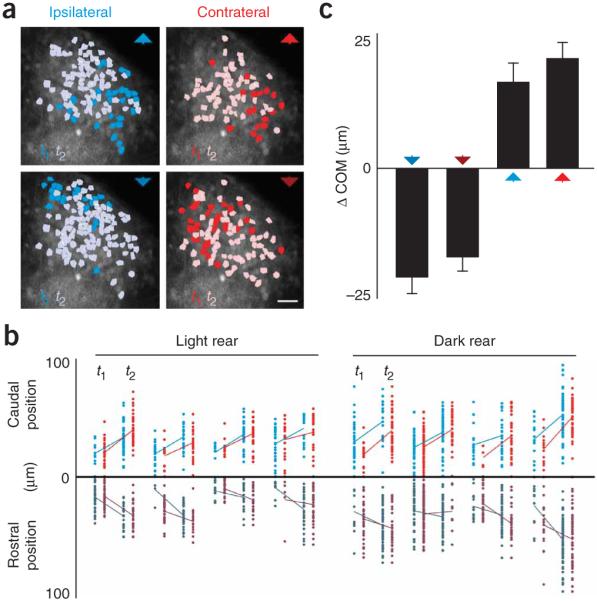
Tectal populations show equivalent functional retinotopy for each eye. (a) Tectal activity patterns during monocular stimulation with all moving stimuli. Cells are color-coded for the time of peak activity during moving spot stimulation (dark and light colors indicate peak activity at time point 1 (t1) and time point 2 (t2), respectively). Stimuli used are represented by colored arrowheads. Scale bar represents 10 μm. (b) Rostrocaudal position of cells with peak activity at t1 or t2 during stimulation with either ipsilateral (blue) or contralateral (red) head-to-tail (light) or tail-to-head (dark) stimuli (n = 701 neurons from four light-reared and four dark-reared fish). For each fish, the mean positions of active cells for each time point are connected by a solid line. Caudal cells responded later (t2) for head-to-tail stimulation, whereas more rostral cells were active later (t2), during tail-to-head stimulation. The positions of active cells during each time point were very similar for ipsilateral and contralateral stimulation. (c) Change in the COM of active tectal populations along the caudorostral tectal axis between t1 and t2. Error bars indicate s.e.m.
Direction-selective matching in binocular tectal neurons
Having established that rewired tecta integrate binocular retinal inputs, we next examined how the complex receptive-field property of direction selectivity is represented in these circuits. Neurons with varying degrees of direction selectivity that have a bias toward horizontal motion are distributed throughout the larval zebrafish optic tectum12. We used a normalized ratiometric direction-selectivity index23 (DSI, see Methods) to calculate the degree to which binocular neurons show a preference for one of two directions of motion presented to each eye.
It has been proposed that structured visual activity may be responsible for the establishment of direction selectivity24,25. As the eyes of the larval zebrafish are laterally positioned with largely non-overlapping visual fields, we expected that mismatched visual activity from each eye might cause the ipsilateral and contralateral direction selectivity of binocular tectal neurons to be uncorrelated or even absent. This was not the case (Fig. 4). We found that tectal neurons could be direction selective for ipsilateral visual stimuli and that the responses of binocular tectal neurons to ipsilateral and contralateral moving stimuli were strongly correlated (Fig. 4d). For example, a vast majority of cells that were selective for stimuli moving rostrocaudally (head-to-tail) in the contralateral visual field were also selective for rostrocaudally moving stimuli in the ipsilateral visual field. This was true for zebrafish that were raised in the presence (Fig. 4a) and those raised in the absence of light (Fig. 4b). Compiled data from all binocular neurons revealed that, although DSI values were unrelated to absolute neuronal response strength (Supplementary Fig. 2 online), a vast majority of neurons had contralateral and ipsilateral DSI values of the same sign and magnitude (n = 438 neurons from 12 fish, Pearson’s correlation coefficient r = 0.75, P < 0.0001; Fig. 4c).
Figure 4.

Binocular neurons show matching direction selectivity for each eye. (a) Scatter plots comparing the contralateral and ipsilateral DSI values (cDSI and iDSI, respectively) for binocular tectal neurons in eight light-reared rewired zebrafish. cDSI and iDSI zero crossings are demarcated by perpendicular gray lines for clarity. Pearson’s correlation coefficient values for each are indicated. (b) Analogous scatter plots for binocular tectal neurons in four dark-reared fish. (c) Composite scatter plot for binocular neurons taken from all rewired zebrafish. Colored lines demarcate the threshold for neurons to be considered direction selective. Neurons are luminance encoded for binocular direction selectivity (black), monocular direction selectivity (dark gray) and no direction selectivity (light gray). In all cases, correlation coefficients were significant at P < 0.0001. (d) Representative fluorescence traces from a neuron with high tail-to-head direction selectivity for both eyes (top), little direction selectivity for either eye (middle) and high head-to-tail direction selectivity for both eyes (bottom). Numbers relate each cell’s selectivity to the approximate positions on the composite scatter plot in c. Colored arrowheads indicate stimulus type. Mean traces (black) are superimposed over five raw traces (gray).
Tectal computation of direction selectivity
The matching direction selectivity of ipsilateral and contralateral retinotectal circuits following binocular rewiring could be explained by several plausible wiring scenarios. The known topography of retinal information provided to the tectum from each eye22 (Fig. 3) might be combined with tectal inhibitory circuitry26,27 for the computation of direction selectivity (Supplementary Fig. 3 online). Alternatively, the presence of direction-selective retinal ganglion cells (DS-RGCs) in vertebrates28-30 raises the possibility that this functional alignment might result from the precise targeting of DS-RGCs to specified tectal neurons or layers (Supplementary Fig. 3). Mechanistically, a model implicating tectal inhibitory circuitry in computing direction selectivity would rely on a temporally asymmetric inhibitory influence on direction-selective tectal neurons; excitation preceded by inhibition would result in reduced firing compared with the reverse sequence28. Because of the topographic organization of the retinotectal projection and the spatial continuity of moving visual stimuli, this model would predict that inhibitory connections to direction-selective neurons might be dominated by interneurons with visual receptive fields that were shifted either rostrally or caudally to their own.
To test the sufficiency of tectal circuitry to process directional visual information in this manner, we designed visual stimuli that could only elicit stimulus selectivity in the absence of retinal computation (Fig. 5). Apparent motion stimuli (adjacent stationary spots flashed in sequence; Fig. 5a) have been shown to elicit direction selectivity in visually responsive neurons28,31,32. The overlapping retinotopy of binocular tecta enabled us to distribute this apparent motion sequence over both eyes (Fig. 5c), providing motion-like information to the tectum without apparent motion to either retina. In rewired zebrafish, we found that this binocular apparent motion stimulus was capable of inducing direction-selective responses (Fig. 5d) to a similar extent as with monocular apparent motion to the contralateral eye alone (18 selective neurons, sampled from 4 fish and 278 neurons; n = 3 sweeps, P < 0.05–0.001, paired Student’s t test and s.e.m. in all cases; Fig. 5b). Because, in this procedure, each eye receives only stationary visual information, directional information cannot originate from the retina, suggesting that direction selectivity can be encoded in the tectum.
Figure 5.

Tectal neurons show sequence selectivity to binocular apparent motion. (a) Schematic of monocular apparent-motion stimulation. Stationary spots were flashed in a caudorostral or rostrocaudal sequence to the contralateral eye in the visual receptive fields of imaged tectal populations. (b) Mean (black) and raw (gray) fluorescence traces from neurons that were selective to caudorostral (left) and rostrocaudal (right) apparent-motion stimuli. Spot sequences are color coded. These traces flank data comparing the normalized response magnitude of nine selective cells to each stimulus sequence. (c) Schematic of the binocular apparent-motion experiment. Here, individual stationary spots were presented to either eye in sequence in the binocular visual receptive fields of imaged tectal populations. (d) Data from neurons that were selective for binocular apparent motion. Differences in mean response to each stimulus were significant (paired Student’s t test, P < 0.05–0.001, mean ± s.e.m.).
In the zebrafish, as in other systems, inhibitory transmission is important for tectal processing26. To test whether tectal direction selectivity requires local inhibitory transmission, we injected the GABAA receptor antagonist, bicuculline (BMI), into the tectum while we observed neuronal population responses to moving stimuli presented in the contralateral visual field (Fig. 6a). Injections of fluorescent dye, comparable in size to BMI, confirmed that diffusion from injection sites was minimal. We found that, in the absence of any visual stimulus, pressure-injection of 1 mM BMI resulted in a transient increase in the fluorescence of direction-selective tectal neurons that was well above responses to visual stimulation alone. This was followed within 1 min by a return to baseline fluorescence values (4 fish, n = 100 neurons out of 370 total classified as direction selective; response to BMI injection versus preferred or null stimulation after BMI injection, P < 0.0001, paired Student’s t test and s.e.m.; Fig. 6b). Visual stimulation over the course of the next few minutes revealed a strong reduction in direction selectivity that was caused by an increase in response to the null direction of motion (difference in mean response to preferred versus null stimuli: before BMI, P < 0.0001; after BMI, P < 0.3685; paired Student’s t test and s.e.m.; Fig. 6c–e) and no changes were observed following vehicle injection (data not shown). These results suggest that direction selectivity in the zebrafish optic tectum requires local inhibitory transmission.
Figure 6.

Tectal direction selectivity requires local inhibition. (a) Schematic of tectal disinhibition experiment. Population responses to contralaterally presented moving spots were measured before and after BMI injection locally into the tectal neuropil. (b) BMI injection without visual stimulation resulted in a large increase in fluorescence that was well above that of responses to visual stimulation after injection (4 fish, n = 100 neurons, paired Student’s t test, **P < 0.0001, mean ± s.e.m.). (c) Average population responses for all direction-selective cells to preferred and null stimuli before and after BMI injection (4 fish, n = 100 neurons, paired Student’s t test; before BMI, **P < 0.0001; after BMI, P < 0.3685, mean ± s.e.m.). (d) Fluorescence responses for direction-selective neurons to preferred (blue) and null (black) stimuli before BMI injection (left). Neurons are sorted in descending order by their response magnitude to preferred stimuli. Corresponding DSI distributions for all tectal neurons are shown on the right. Direction-selective neurons are shown in black. Red traces indicate individual DSI trajectories for all direction-selective neurons. (e) Analogous fluorescence response magnitudes and DSI distributions following BMI injection.
DISCUSSION
Topographic superposition enables binocular coherence
We report that the otherwise monocular zebrafish tectal circuit integrates and topographically incorporates information from two eyes following binocular rewiring. In addition, binocular neurons in these circuits showed matching direction selectivity for each eye. We present a simple model that is supported by our data and that can account for the functional alignment observed in binocular and integrative neural circuits. Central to this model is the molecularly defined topographic projection of RGCs to the optic tectum33,34. As a consequence of this topographic structure, moving visual stimuli activate tectal neurons in a spatially defined sequence. In combination with anisotropic inhibitory connections in the tectum27, an important component in models for direction selectivity in the retina and visual cortex28,35, this retinotopy can result in selectivity to stimuli moving in a particular direction (Supplementary Fig. 3). For example, with a rostrocaudal moving stimulus, tectal neurons are activated in a rostrocaudal sequence. Cells that are strongly innervated by inhibitory neurons with receptive fields caudal to their own will be selective to rostrocaudal stimuli because early inhibition will dampen the effect of later activation during the presentation of caudorostral motion.
A prediction of our model is that tectal neurons located at the caudal border of the tectum should show a bias for caudal-to-rostral motion, as they are more likely to receive inhibitory input from rostrally located interneurons. This was apparent in direction-selective neurons, predominantly imaged in the caudomedial tectum, which showed an overall preference for tail-to-head stimulation (DSI > 0.2; Fig. 4). Another natural consequence of this model is that other convergent inputs, in this case RGCs coming from a second eye, would experience equivalent processing when integrated and mapped topographically in a similar manner (Supplementary Fig. 3). In this scenario, presentation to either eye of stimuli moving in a particular direction along the rostrocaudal axis would activate binocular tectal neurons in a similar sequence, resulting in the alignment of direction selectivity for each eye.
An alternative model for explaining binocular receptive-field matching invokes the targeting of DS-RGCs to specific tectal neurons or lamina (Supplementary Fig. 3). Two of our experiments suggested that DS-RGCs may not contribute substantially to tectal direction selectivity. First, the binocular apparent-motion experiment (Fig. 5) demonstrated that tectal circuitry is sufficient to produce direction-selective responses when only stationary stimuli are presented to each retina. Second, the application of BMI locally in the tectum strongly diminished direction selectivity (Fig. 6). Although there are many caveats associated with in vivo pharmacological manipulation, we controlled for indicator saturation (Fig. 6b) and the diffusion of BMI to the retina. Taken together, these data corroborate a model whereby computations performed by the tectum account for binocular direction-selective matching in the rewired larval zebrafish. These experiments do not imply the absence of DS-RGCs in the larval zebrafish. Although this functional subclass of neurons has not yet been identified in the larval zebrafish, as with virtually all vertebrates30,36, they probably exist. However, as the larval zebrafish retinofugal projection consists of ten separate arborization fields, of which the tectum is but one37, it is possible that DS-RGCs project predominantly to other brain areas that are responsible for reflexive behaviors to whole-field motion (optokinetic and oculomotor responses), computations that do not require the optic tectum38. Undoubtedly, the projection patterns and functional roles of these and other RGC subtypes in the larval zebrafish would be a rich topic for further study.
Implications for binocular circuit evolution
The mechanism that we propose for integrative tectal circuit processing using overlaid topographic inputs may be a conserved framework for the establishment of coherence in binocular systems. In studies examining the binocular alignment of orientation maps in mammalian visual cortex9,10,18, retinotopy has been demonstrated to provide a robust mechanism for visual system development, even in the face of substantial experimental interventions. Following an initial period that employs molecularly defined mechanisms to achieve a substantial degree of functional coherence, visual experience is thought to be critical for refinement and maintenance18-20,39,40.
Notably, there are important distinctions between our induced and other naturally occurring binocular circuits. Although we observed matching direction selectivity in rewired zebrafish with respect to the rostrocaudal axis, this matching occurs with respect to the left-right axis of the visual field in truly stereoscopic animals. In other words, information from each temporal retina is correlated with nasal information from the other retina. However, this inversion can easily be explained by differences between stereoscopic mammals and lower vertebrates in the expression of retinal molecular guidance cues that are responsible for retinotopic mapping. It was first postulated that, in comparison with the nasotemporal molecular gradients found in the retina of lower vertebrates, stereoscopic mammals would instead require radial gradients to accomplish binocular receptive-field matching41, a hypothesis that has recently gained support from data in the human visual system42. This difference highlights an advantage of using topographically organized information in neural computation: marked changes in circuit wiring and function can be accomplished by simple modifications in molecularly defined input mapping. We speculate that other modifications, including the scaling, inversion or shifting of convergent input maps with respect to one another, might enable the performance of novel computations43.
The robustness of monocular neural circuits in integrating and coordinating information from two eyes suggests that, over the course of vertebrate evolution, the expression of signaling molecules responsible for convergent retinofugal wiring44 may have been sufficient to establish a basic binocular neural architecture. This extraordinary developmental plasticity, one that allows for the exploitation of preexisting computational modules in processing new information, is a characteristic of neural circuits that may have been fundamental for the adaptation of organisms to their unique sensory environments.
METHODS
Zebrafish rearing conditions
We used mitfa−/− (nacre) zebrafish45 in this study because of their optical transparency and intact ocular pigmentation. Larval zebrafish were collected and raised at 28 °C on a 14 h on/10 h off light cycle or a 24 h off light cycle for dark rearing. Embryos were kept in E3 solution (5 mM NaCl, 0.17 mM KCl, 0.33 mM CaCl2 and 0.33 mM MgSO4). All experiments were approved by Harvard University’s Standing Committee on the Use of Animals in Research and Training.
Retinal rewiring
At 48 h post fertilization, zebrafish were anaesthetized with 0.02% tricaine (vol/vol) in E3 and then mounted in 2% low melting-temperature agarose (wt/vol, LMA, Invitrogen). Careful removal of the left tectal lobe was then carried out using a sharp glass pipette (tip diameter was approximately 5 μm). Zebrafish were immediately returned to E3 solution for recovery.
Labeling and imaging of retinotectal projections
To identify and characterize ipsilateral rerouting of RGC axons, we stained each retina using lipophilic dye as described previously46. Briefly, at 8 dpf, zebrafish were fixed in 4% paraformaldehyde (vol/vol) at 4 °C overnight. DiI and DiD crystals (Invitrogen) were diluted to 1% in chloroform (wt/vol, Sigma) and pressure injected into the left and right eyes, respectively, of fixed larvae mounted in 2% LMA. Fish were subsequently imaged using a Zeiss LSM Metahead confocal microscope. Volocity software (Improvision) was used for optical sectioning.
In vivo calcium imaging
Calcium imaging experiments were carried out at 7–8 dpf. For injections, zebrafish were anaesthetized using 0.02% tricaine in E3 and mounted in 2% LMA. Using a pulled glass pipette, we injected 1 mM Oregon Green BAPTA-1 AM Ester dissolved in DMSO with 20% pluronic acid (vol/vol) as well as E3 solution containing 100 μM Alexa Fluor 594 (both dyes from Invitrogen, Molecular Probes) into the tectal neuropil of the right tectum with ten 150-ms pulses at 1 psi delivered through a PV820 Pneumatic PicoPump (World Precision Instruments). Fish were removed from agarose and allowed to recover in E3 solution for at least 1 h before imaging. For imaging, zebrafish were mounted in 1.2% LMA on a custom-built chamber consisting of a raised platform with coverslips for each eye, centered in a transparent acrylic glass cylinder. Calcium imaging experiments were carried out using a custom-built two-photon microscope coupled to a Mai Tai (Spectra-Physics) mode-locked Ti:Sapphire laser (950 nm) and a 20× water-immersion objective with a 0.95 numerical aperture (Olympus). Movies were acquired at 1 Hz using custom-written Labview (National Instruments) software.
Visual stimulation
Visual stimuli were projected using a DLP projector (Optoma) through a #29 Wratten filter (Kodak) and a demagnifying lens system. Images were passed through a 0.42× wide-angle lens (Kenko) and bottom projected onto a screen encompassing approximately 270° of visual angle, permitting binocular stimulus presentation. Custom-designed visual stimuli were programmed using Matlab (Mathworks) with the Psychophysics Toolbox extension47,48. For moving stimuli, 5-s periods with no stimulus were interspersed with high-luminance 3° spots moving across the ipsilateral or contralateral visual field in either the tail-to-head or tail-to-head directions of motion at 45 deg s−1 for 3 s. For apparent-motion experiments, ipsilateral and contralateral receptive fields were first determined using flashed stationary spots. In contralateral apparent motion, two 3° stationary spots shifted nasally and temporally from the contralateral receptive field and separated by 5° were presented sequentially with a 100-ms time interval. The reverse sequence was subsequently presented. For binocular apparent motion, the temporal contralateral spot was replaced with an ipsilateral spot that was shifted temporally from the ipsilateral receptive field.
Data analysis
Calcium-imaging movies were analyzed using ImageJ49 and custom-written Matlab software. Movies with stimulus repeats were first averaged and then pixel values were converted into a %ΔF/F representation. Regions of interest were manually chosen to encompass individual cell somata in the cell body–rich periventricular zone of the tectum. Only cells with at least a 15% peak fluorescence response to visual stimulation underwent subsequent analyses. Analysis of binocular neurons was limited to those showing this threshold response to stimulation of each eye. Mean fluorescence responses of each neuron were recorded for each stimulus over a predetermined time period that began at the initiation of stimulus presentation. This time course was 5 s for moving spots, flashed spot responses were averaged over 4 s and BMI injections were analyzed for 15 s. These fluorescence signals were, in some cases, used to quantify functional indices for each neuron. An OPI was used to compare the maximum response of a neuron to stimulation of one eye versus the other. This analysis was performed on rewired zebrafish with some response to ipsilateral stimulation. Purely ipsilaterally responsive neurons have an OPI of −1, binocular neurons with equivalent responses for each eye have an OPI of 0 and purely contralaterally responsive neurons have an OPI of 1.
A DSI was used to compare the responses of a neuron to a visual stimulus moving from tail-to-head (TH) and head-to-tail (HT) for a given eye. Here, neurons that were highly selective for tail-to-head motion had a DSI of 1, whereas those that were only responsive to head-to-tail motion had a DSI of −1. Non–direction-selective neurons had a DSI of 0.
Cells with a 50% larger response in the preferred direction over that in the null direction were considered to be direction selective23. These had DSI values of 0.2 and above for tail-to-head–selective neurons or −0.2 and below for head-to-tail–selective neurons. To analyze the functional retinotopy of tectal populations, calcium-imaging movies were divided into individual frames. For frames in which neurons responded robustly to visual stimuli (at least two frames for each stimulus, denoted t1 and t2), neuronal subpopulations that showed peak fluorescence during these times were identified, color-coded and their positions along the rostrocaudal tectal axis were quantified. A COM was then calculated for each of these subpopulations (t1 and t2). The vector between these two COMs was then projected along the rostrocaudal tectal axis to produce a distance in microns, the ΔCOM for a given stimulus. Magnification factors were determined by dividing the total distance of visual motion, 45°, by the ΔCOM.
Bicuculline injection
BMI (Tocris Biosciences) was diluted to 1 mM in zebrafish external solution (134 mM NaCl, 2.9 mM KCl, 2.1 mM CaCl2, 1.2 mM MgCl2 and 10 mM HEPES glucose, pH 7.8)50. For local application to the tectum, a bolus of either BMI or vehicle (external solution) was pressure injected into the tectal neuropil with one 100-ms pulse at less than 1 psi using a Picospritzer III (Parker Hannafin) while we carried out simultaneous two-photon imaging. In some cases, injection resulted in tectal distortion or displacement. These experiments were not used for subsequent analysis.
Supplementary Material
ACKNOWLEDGMENTS
We extend our gratitude to A. Kampff for help in microscope construction, J. Bollmann for a suggestion on microscope optimization and M. Orger for insightful discussions. The authors thank M. Livingstone, M. Meister, T. Bonhoeffer, J. Lichtman, V. Murthy, A. Schier, B. Olvecsky and members of the Engert laboratory for comments on the manuscript and helpful discussions. This work was supported by a National Science Foundation Predoctoral Fellowship, a National Science and Engineering Graduate Fellowship (P.R.), a US National Institutes of Health grant (R01 EY014429-01A2) and funding from the McKnight and Dana Foundations (F.E.).
Footnotes
Note: Supplementary information is available on the Nature Neuroscience website.
References
- 1.Hubel DH, Wiesel TN. Receptive fields, binocular interaction and functional architecture in the cat’s visual cortex. J. Physiol. (Lond.) 1962;160:106–154. doi: 10.1113/jphysiol.1962.sp006837. [DOI] [PMC free article] [PubMed] [Google Scholar]
- 2.Maske R, Yamane S, Bishop PO. Binocular simple cells for local stereopsis: comparison of receptive field organizations for the two eyes. Vision Res. 1984;24:1921–1929. doi: 10.1016/0042-6989(84)90026-9. [DOI] [PubMed] [Google Scholar]
- 3.Sterling P, Wickelgren BG. Visual receptive fields in the superior colliculus of the cat. J. Neurophysiol. 1969;32:1–15. doi: 10.1152/jn.1969.32.1.1. [DOI] [PubMed] [Google Scholar]
- 4.Ohzawa I, DeAngelis GC, Freeman RD. Encoding of binocular disparity by simple cells in the cat’s visual cortex. J. Neurophysiol. 1996;75:1779–1805. doi: 10.1152/jn.1996.75.5.1779. [DOI] [PubMed] [Google Scholar]
- 5.Cynader M, Berman N. Receptive-field organization of monkey superior colliculus. J. Neurophysiol. 1972;35:187–201. doi: 10.1152/jn.1972.35.2.187. [DOI] [PubMed] [Google Scholar]
- 6.Drager UC, Hubel DH. Physiology of visual cells in mouse superior colliculus and correlation with somatosensory and auditory input. Nature. 1975;253:203–204. doi: 10.1038/253203a0. [DOI] [PubMed] [Google Scholar]
- 7.Stein BE, Magalhaes-Castro B, Kruger L. Relationship between visual and tactile representations in cat superior colliculus. J. Neurophysiol. 1976;39:401–419. doi: 10.1152/jn.1976.39.2.401. [DOI] [PubMed] [Google Scholar]
- 8.Wallace MT, Meredith MA, Stein BE. Integration of multiple sensory modalities in cat cortex. Exp. Brain Res. 1992;91:484–488. doi: 10.1007/BF00227844. [DOI] [PubMed] [Google Scholar]
- 9.Gödecke I, Bonhoeffer T. Development of identical orientation maps for two eyes without common visual experience. Nature. 1996;379:251–254. doi: 10.1038/379251a0. [DOI] [PubMed] [Google Scholar]
- 10.Blakemore C, Van Sluyters RC, Peck CK, Hein A. Development of cat visual cortex following rotation of one eye. Nature. 1975;257:584–586. doi: 10.1038/257584a0. [DOI] [PubMed] [Google Scholar]
- 11.Denk W, Strickler JH, Webb WW. Two-photon laser scanning fluorescence microscopy. Science. 1990;248:73–76. doi: 10.1126/science.2321027. [DOI] [PubMed] [Google Scholar]
- 12.Niell CM, Smith SJ. Functional imaging reveals rapid development of visual response properties in the zebrafish tectum. Neuron. 2005;45:941–951. doi: 10.1016/j.neuron.2005.01.047. [DOI] [PubMed] [Google Scholar]
- 13.Law MI, Constantine-Paton M. Right and left eye bands in frogs with unilateral tectal ablations. Proc. Natl. Acad. Sci. USA. 1980;77:2314–2318. doi: 10.1073/pnas.77.4.2314. [DOI] [PMC free article] [PubMed] [Google Scholar]
- 14.Ruthazer ES, Akerman CJ, Cline HT. Control of axon branch dynamics by correlated activity in vivo. Science. 2003;301:66–70. doi: 10.1126/science.1082545. [DOI] [PubMed] [Google Scholar]
- 15.Constantine-Paton M, Law MI. Eye-specific termination bands in tecta of three-eyed frogs. Science. 1978;202:639–641. doi: 10.1126/science.309179. [DOI] [PubMed] [Google Scholar]
- 16.Levine RL, Jacobson M. Discontinuous mapping of retina onto tectum innervated by both eyes. Brain Res. 1975;98:172–176. doi: 10.1016/0006-8993(75)90517-x. [DOI] [PubMed] [Google Scholar]
- 17.Udin SB, Grant S. Plasticity in the tectum of Xenopus laevis: binocular maps. Prog. Neurobiol. 1999;59:81–106. doi: 10.1016/s0301-0082(98)00096-3. [DOI] [PubMed] [Google Scholar]
- 18.Crair MC, Gillespie DC, Stryker MP. The role of visual experience in the development of columns in cat visual cortex. Science. 1998;279:566–570. doi: 10.1126/science.279.5350.566. [DOI] [PMC free article] [PubMed] [Google Scholar]
- 19.Hubel DH, Wiesel TN. Binocular interaction in striate cortex of kittens reared with artificial squint. J. Neurophysiol. 1965;28:1041–1059. doi: 10.1152/jn.1965.28.6.1041. [DOI] [PubMed] [Google Scholar]
- 20.Katz LC, Crowley JC. Development of cortical circuits: lessons from ocular dominance columns. Nat. Rev. Neurosci. 2002;3:34–42. doi: 10.1038/nrn703. [DOI] [PubMed] [Google Scholar]
- 21.Wong RO, Meister M, Shatz CJ. Transient period of correlated bursting activity during development of the mammalian retina. Neuron. 1993;11:923–938. doi: 10.1016/0896-6273(93)90122-8. [DOI] [PubMed] [Google Scholar]
- 22.Sharma SC. Anomalous retinal projection after removal of contralateral optic tectum in adult goldfish. Exp. Neurol. 1973;41:661–669. doi: 10.1016/0014-4886(73)90058-7. [DOI] [PubMed] [Google Scholar]
- 23.Livingstone MS, Conway BR. Substructure of direction-selective receptive fields in macaque V1. J. Neurophysiol. 2003;89:2743–2759. doi: 10.1152/jn.00822.2002. [DOI] [PMC free article] [PubMed] [Google Scholar]
- 24.Rao RP, Sejnowski TJ. Predictive learning of temporal sequences in recurrent neocortical circuits. Novartis Found. Symp. 2001;239:208–229. doi: 10.1002/0470846674.ch16. [DOI] [PubMed] [Google Scholar]
- 25.Engert F, Tao HW, Zhang LI, Poo MM. Moving visual stimuli rapidly induce direction sensitivity of developing tectal neurons. Nature. 2002;419:470–475. doi: 10.1038/nature00988. [DOI] [PubMed] [Google Scholar]
- 26.Sajovic P, Levinthal C. Inhibitory mechanism in zebrafish optic tectum: visual response properties of tectal cells altered by picrotoxin and bicuculline. Brain Res. 1983;271:227–240. doi: 10.1016/0006-8993(83)90285-8. [DOI] [PubMed] [Google Scholar]
- 27.Higashijima S, Mandel G, Fetcho JR. Distribution of prospective glutamatergic, glycinergic and GABAergic neurons in embryonic and larval zebrafish. J. Comp. Neurol. 2004;480:1–18. doi: 10.1002/cne.20278. [DOI] [PubMed] [Google Scholar]
- 28.Barlow HB, Levick WR. The mechanism of directionally selective units in rabbit’s retina. J. Physiol. (Lond.) 1965;178:477–504. doi: 10.1113/jphysiol.1965.sp007638. [DOI] [PMC free article] [PubMed] [Google Scholar]
- 29.Wartzok D, Marks WB. Directionally selective visual units recorded in optic tectum of the goldfish. J. Neurophysiol. 1973;36:588–604. doi: 10.1152/jn.1973.36.4.588. [DOI] [PubMed] [Google Scholar]
- 30.Kim IJ, Zhang Y, Yamagata M, Meister M, Sanes JR. Molecular identification of a retinal cell type that responds to upward motion. Nature. 2008;452:478–482. doi: 10.1038/nature06739. [DOI] [PubMed] [Google Scholar]
- 31.Newsome WT, Mikami A, Wurtz RH. Motion selectivity in macaque visual cortex. III. Psychophysics and physiology of apparent motion. J. Neurophysiol. 1986;55:1340–1351. doi: 10.1152/jn.1986.55.6.1340. [DOI] [PubMed] [Google Scholar]
- 32.Emerson RC, Gerstein GL. Simple striate neurons in the cat. II. Mechanisms underlying directional asymmetry and directional selectivity. J. Neurophysiol. 1977;40:136–155. doi: 10.1152/jn.1977.40.1.136. [DOI] [PubMed] [Google Scholar]
- 33.Stuermer CA, Rohrer B, Munz H. Development of the retinotectal projection in zebrafish embryos under TTX-induced neural-impulse blockade. J. Neurosci. 1990;10:3615–3626. doi: 10.1523/JNEUROSCI.10-11-03615.1990. [DOI] [PMC free article] [PubMed] [Google Scholar]
- 34.Flanagan JG. Neural map specification by gradients. Curr. Opin. Neurobiol. 2006;16:59–66. doi: 10.1016/j.conb.2006.01.010. [DOI] [PubMed] [Google Scholar]
- 35.Livingstone MS. Mechanisms of direction selectivity in macaque V1. Neuron. 1998;20:509–526. doi: 10.1016/s0896-6273(00)80991-5. [DOI] [PubMed] [Google Scholar]
- 36.Clifford CW, Ibbotson MR. Fundamental mechanisms of visual motion detection: models, cells and functions. Prog. Neurobiol. 2002;68:409–437. doi: 10.1016/s0301-0082(02)00154-5. [DOI] [PubMed] [Google Scholar]
- 37.Burrill JD, Easter SS., Jr. Development of the retinofugal projections in the embryonic and larval zebrafish (Brachydanio rerio) J. Comp. Neurol. 1994;346:583–600. doi: 10.1002/cne.903460410. [DOI] [PubMed] [Google Scholar]
- 38.Roeser T, Baier H. Visuomotor behaviors in larval zebrafish after GFP-guided laser ablation of the optic tectum. J. Neurosci. 2003;23:3726–3734. doi: 10.1523/JNEUROSCI.23-09-03726.2003. [DOI] [PMC free article] [PubMed] [Google Scholar]
- 39.White LE, Coppola DM, Fitzpatrick D. The contribution of sensory experience to the maturation of orientation selectivity in ferret visual cortex. Nature. 2001;411:1049–1052. doi: 10.1038/35082568. [DOI] [PubMed] [Google Scholar]
- 40.Knudsen EI. Dynamic space codes in the superior colliculus. Curr. Opin. Neurobiol. 1991;1:628–632. doi: 10.1016/s0959-4388(05)80040-6. [DOI] [PubMed] [Google Scholar]
- 41.Sperry RW. Chemoaffinity in the orderly growth of nerve fiber patterns and connections. Proc. Natl. Acad. Sci. USA. 1963;50:703–710. doi: 10.1073/pnas.50.4.703. [DOI] [PMC free article] [PubMed] [Google Scholar]
- 42.Lambot MA, Depasse F, Noel JC, Vanderhaeghen P. Mapping labels in the human developing visual system and the evolution of binocular vision. J. Neurosci. 2005;25:7232–7237. doi: 10.1523/JNEUROSCI.0802-05.2005. [DOI] [PMC free article] [PubMed] [Google Scholar]
- 43.Knudsen EI, du Lac S, Esterly SD. Computational maps in the brain. Annu. Rev. Neurosci. 1987;10:41–65. doi: 10.1146/annurev.ne.10.030187.000353. [DOI] [PubMed] [Google Scholar]
- 44.Williams SE, et al. Ephrin-B2 and EphB1 mediate retinal axon divergence at the optic chiasm. Neuron. 2003;39:919–935. doi: 10.1016/j.neuron.2003.08.017. [DOI] [PubMed] [Google Scholar]
- 45.Lister JA, Robertson CP, Lepage T, Johnson SL, Raible DW. nacre encodes a zebrafish microphthalmia-related protein that regulates neural crest–derived pigment cell fate. Development. 1999;126:3757–3767. doi: 10.1242/dev.126.17.3757. [DOI] [PubMed] [Google Scholar]
- 46.Fricke C, Lee JS, Geiger-Rudolph S, Bonhoeffer F, Chien CB. astray, a zebrafish roundabout homolog required for retinal axon guidance. Science. 2001;292:507–510. doi: 10.1126/science.1059496. [DOI] [PubMed] [Google Scholar]
- 47.Brainard DH. The Psychophysics Toolbox. Spat. Vis. 1997;10:433–436. [PubMed] [Google Scholar]
- 48.Pelli DG. The VideoToolbox software for visual psychophysics: transforming numbers into movies. Spat. Vis. 1997;10:437–442. [PubMed] [Google Scholar]
- 49.Abramoff MD, Magelhaes PJ, Ram SJ. Image processing with ImageJ. Biophotonics Int. 2004;11:36–42. [Google Scholar]
- 50.Drapeau P, Ali DW, Buss RR, Saint-Amant L. In vivo recording from identifiable neurons of the locomotor network in the developing zebrafish. J. Neurosci. Methods. 1999;88:1–13. doi: 10.1016/s0165-0270(99)00008-4. [DOI] [PubMed] [Google Scholar]
Associated Data
This section collects any data citations, data availability statements, or supplementary materials included in this article.