

Abstract
A cyclin-dependent kinase inhibitor CDKN2A (p16/Ink4a) is a tumor suppressor and upregulated in cellular senescence. CDKN2A promoter methylation and gene silencing are associated with the CpG island methylator phenotype (CIMP) in colon cancer. However, prognostic significance of CDKN2A methylation or loss of CDKN2A (p16) expression independent of CIMP status remains uncertain. Utilizing a database of 902 colorectal cancers in two independent cohort studies (the Nurses' Health Study and the Health Professionals Follow-up Study), we quantified CDKN2A promoter methylation and detected hypermethylation in 269 tumors (30%). By immunohistochemistry, we detected loss of CDKN2A (p16) expression in 25% (200/804) of tumors. We analyzed for LINE-1 hypomethylation and hypermethylation at 7 CIMP-specific CpG islands (CACNA1G, CRABP1, IGF2, MLH1, NEUROG1, RUNX3 and SOCS1); microsatellite instability (MSI); KRAS, BRAF and PIK3CA mutations; and expression of TP53 (p53), CTNNB1 (β-catenin), CDKN1A (p21), CDKN1B (p27), CCND1 (cyclin D1), FASN (fatty acid synthase), and PTGS2 (cyclooxygenase-2). CDKN2A promoter methylation and loss of CDKN2A (p16) were associated with shorter overall survival in univariate Cox regression analysis [hazard ratio (HR), 1.36; 95% CI, 1.10-1.66; p=0.0036 for CDKN2A methylation; HR, 1.30; 95% CI, 1.03-1.63; p=0.026 for CDKN2A (p16) loss] but not in multivariate analysis that adjusted for clinical and tumor variables including CIMP, MSI, and LINE-1 methylation. Neither CDKN2A promoter methylation nor loss of CDKN2A (p16) was associated with colorectal cancer-specific mortality in univariate or multivariate analysis. Despite its well-established role in carcinogenesis, CDKN2A (p16) promoter methylation or loss of expression in colorectal cancer is not independently associated with patient prognosis.
Keywords: colon cancer, CDKN2A, epigenetics, hypermethylation, prognosis, clinical outcome, survival
Introduction
CDKN2A (the HUGO-approved official gene symbol for p16/ink4a) is an inhibitor of cyclin-dependent kinase 4 (CDK4) and CDK6, and functions as a tumor suppressor.1 CDKN2A (p16) expression is upregulated in cellular senescence, and increases markedly with aging in a wide variety of human tissue.1 CDKN2A is activated to prevent cancer, and can promote aging through induction of cell growth arrest and senescence.2 Loss of function of CDKN2A by a deletion, point mutation and/or promoter methylation may cause uncontrolled cell proliferation leading to neoplastic transformation.
CDKN2A promoter methylation and subsequent gene silencing have been documented in various cancers including colon cancer.3-10 CDKN2A methylation in colorectal cancer has been associated with the CpG island methylator phenotype (CIMP),7-9, 11 which is characterized by widespread promoter CpG island methylation.9, 11-13 A number of studies have examined prognostic significance of CDKN2A promoter methylation or loss of CDKN2A (p16) expression in colorectal cancer (Table 1).14-30 However, to date, no study has examined the prognostic role of CDKN2A methylation or CDKN2A (p16) loss independent of CIMP status. CIMP is a potential confounder in analysis of CDKN2A methylation and prognosis (Figure 1A), because CIMP has been associated with both clinical outcome21, 31-33 and silencing of many tumor suppressors including CDKN2A.7-9 CDKN2A methylation is not synonymous to CIMP, and it is important to examine the prognostic role of CDKN2A independent of CIMP status (i.e., CDKN2A-methylation vs. non-methylation in CIMP-high cancers; CDKN2A-methylation vs. non-methylation in non-CIMP-high cancers). Without analysis of CIMP, three previous studies17, 23, 24 showed an independent association between CDKN2A methylation and worse prognosis, whereas other studies19, 21 did not show its independent prognostic effect. Thus, the prognostic effect of CDKN2A promoter methylation remains uncertain.
Table 1.
Studies on prognostic significance of CDKN2A (p16) promoter methylation or loss of expression in colorectal cancer
| Ref. | Authors (year) | No. of hospitals | Sample size | No. of events | Disease stage | Chemo-therapy | Loss of CDKN2A (p16) (vs. expression) or CDKN2A methylation (vs. no methylation) | |||||||||
|---|---|---|---|---|---|---|---|---|---|---|---|---|---|---|---|---|
| OS | CS | Method | p16 lost (methylated) cases | 5-year OS or CS* | Log-rank p value | OS univariate HR (95% CI) | p value | OS multivariate HR (95% CI) | p value | Covariates examined and other notes | ||||||
| 14 | Liang et al. (1999) | 1 | 84 | - | - | T3 (N0M0) | 5-FU, leucovorin, levamisole | MSP | 29% | 25% (vs. 72%) | 0.0001 | - | - | - | - | age, sex, tumor location, tumor size, differentiation, pathological type, vascular invasion, lymphocytes, CEA, KRAS, TP53, LOH, MSI |
| 15 | Esteller et al. (2001) | 1 | 86 | - | - | Duke's A-C | - | MSP | 35% | 70% (vs. 81%) | NS | - | - | - | - | age, sex, tumor location, KRAS. CDKN2A methylation was associated with worse outcome in KRAS-wild-type cases (HR 3.3; 95% CI, 1.0-10.5). |
| 16 | Norrie et al. (2003) | 1 | 404 | - | - | NA | - | MSP | 25% | - | NS | - | - | - | - | age, sex, tumor location, tumor grade, histopathological type, lymphatic reaction, MSI |
| 17 | Maeda et al. (2003) | 1 | 90 | - | - | Duke's B-C | - | q-MSP | 13% | - | 0.022 | - | - | 1.013 (1.003-1.023) | 0.014 | age, sex, tumor location, tumor differentiation. HR for a unit increase of PMR |
| 18 | Kohonen-Corish et al. (2005) | 1 | 149 | - | - | Duke's C | adjuvant therapy | MSP | 35% | - | 0.966 | - | - | - | - | Age, sex, tumor size, tumor grade, venous invasion, MSI, MGMT methylation |
| 19 | Sanz-Casla et al. (2005) | 1 | 104 | 54 | 46 | Duke's A-D | adjuvant therapy | MSP | 18% | 75% (vs. 61%) | 0.09 | - | - | - | NS | age, sex, tumor location, tumor grade, histopathological type |
| 20 | Ishiguro et al. (2006) | 1 | 88 | - | - | I-IV | - | MSP | 23% | 35% (vs. 29%) | 0.57 | - | - | - | - | age, sex, tumor location, tumor differentiation, CEA, CDKN2B (p15) methylation |
| 21 | Shen et al. (2007) | many | 182 | 153 | - | IV | Five-arm trial | COBRA | 17% | 90% (vs. 83%) | NS | 1.51 | 0.05 | 1.42 | 0.13 | age, sex, tumor location, performance status, treatment arm, methylation (MINT-1, MINT-31, MLH1, p14) |
| 22 | Krtolica et al. (2007) | 1 | 47 | - | - | Duke's A-D | - | MSP | 51% | - | NS | - | NS | - | NS | sex, tumor differentiation, histopathological type, tumor location, MGMT methylation, KRAS, CD44, PCNA, Laminin, CDH1. |
| 23 | Mitomi et al. (2009) | 1 | 151 | 64 | - | II-IV | 5-FU, mitomycin, leucovorin | q-MSP | 30% | *43% (vs. 76%) | - | *2.95 (1.49-5.86) | 0.002 | *3.38 (1.67-6.84) | <0.001 | age, sex, tumor location, tumor differentiation, tumor size, CDKN2A (p16) expression |
| 24 | Kim et al. (2010) | 1 | †131 | - | - | I-IV | adjuvant therapy | Pyrosequencing | 12% | - | <0.0001 | - | - | 0.31 (0.11-0.88) | 0.028 | Rectal cancer only. Age, stage, preoperative serum CEA, lymphovascular invasion |
| Current study | many | 902 | 409 | 235 | I-IV | - | q-MSP | 30% | 46% (vs. 55%) | 0.0035 | 1.36 (1.10-1.66) | 0.0035 | 1.03 (0.82-1.31) | 0.78 | age, sex, tumor location, grade, year of diagnosis, BMI, family history, CIMP, MSI, KRAS, BRAF, LINE-1, TP53, CDKN1A, CDKN1B, CCND1, CTNNB1, FASN. | |
| 25 | Zhao et al. (2003) | 2 | 32 | 12 | - | Duke's A-C | - | IHC | 41% | 62% (vs. 79%) | <0.001 | - | - | - | - | tumor grade, CDK4 expression, CDKN2A methylation |
| 16 | Norrie et al. (2003) | 1 | 161 | - | - | NA | - | IHC | 8.1% | - | NS | - | - | - | - | age, sex, tumor location, tumor grade, histopathological type, lymphatic reaction, MSI |
| 26 | Cui et al. (2004) | 1 | 117 | - | - | I-IV | - | IHC | 62% | 65% (vs.84%) | 0.025 | - | - | *5.99 (2.97-12.1) | <0.0001 | age, sex, tumor location, tumor grade, tumor size, RB |
| 27 | González-Quevedo et al. (2004) | NA | 79 | - | - | NA | - | Western blot | 33% | - | NS | - | - | - | - | CDKN2A methylation |
| 28 | Lyall et al. (2006) | 1 | 90 | 55 | - | III | - | IHC | 91% | MS 48 months (vs. 10 months) | 0.001 | - | - | - | - | age, sex, tumor location, tumor differentiation, expression of 22 other markers |
| 29 | Lam et al. (2008) | 1 | 194 | 57 | - | I-IV | - | IHC | 20% | - | NS | - | - | - | NS | age, sex, tumor location, tumor grade, histopathological type, tumor size |
| 30 | Wassermann et al. (2009) | NA | 82 | - | - | II-III | adjuvant therapy | IHC | - | - | - | - | - | - | - | In colorectal cancers that displayed budding at infiltrative front with CTNNB1 nuclear expression, CDKN2A (p16) expression was associated with high mortality (p<0.001). |
| Current study | many | 804 | 367 | 223 | I-IV | - | IHC | 25% | 46% (vs. 54%) | 0.026 | 1.30 (1.03-1.63) | 0.026 | 1.08 (0.83-1.42) | 0.55 | age, sex, tumor location, grade, year of diagnosis, BMI, family history, CIMP, MSI, KRAS, BRAF, LINE-1, TP53, CDKN1A, CDKN1B, CCND1, CTNNB1, FASN. | |
Colorectal cancer-specific survival.
Rectal cancer cases only. The HUGO Gene Nomenclature Committee (HGNC)-approved official gene/protein symbols are used (www.genenames.org).
BMI, body mass index; COBRA, combined bisulfite and restriction analysis; CEA, carcinoembryonic antigen; CI, confidence interval; CIMP, CpG island methylator phenotype; CS, colorectal cancer-specific survival; 5-FU, 5-fluorouracil; IHC, immunohistochemistry; KM, Kaplan-Meier; MS, median survival; MSI, microsatellite instability; MSP, methylation-specific PCR; NA, not available; NS, not significant; OS, overall survival; PMR, percentage of methylated reference; q-MSP, quantitative MSP.
Figure 1.
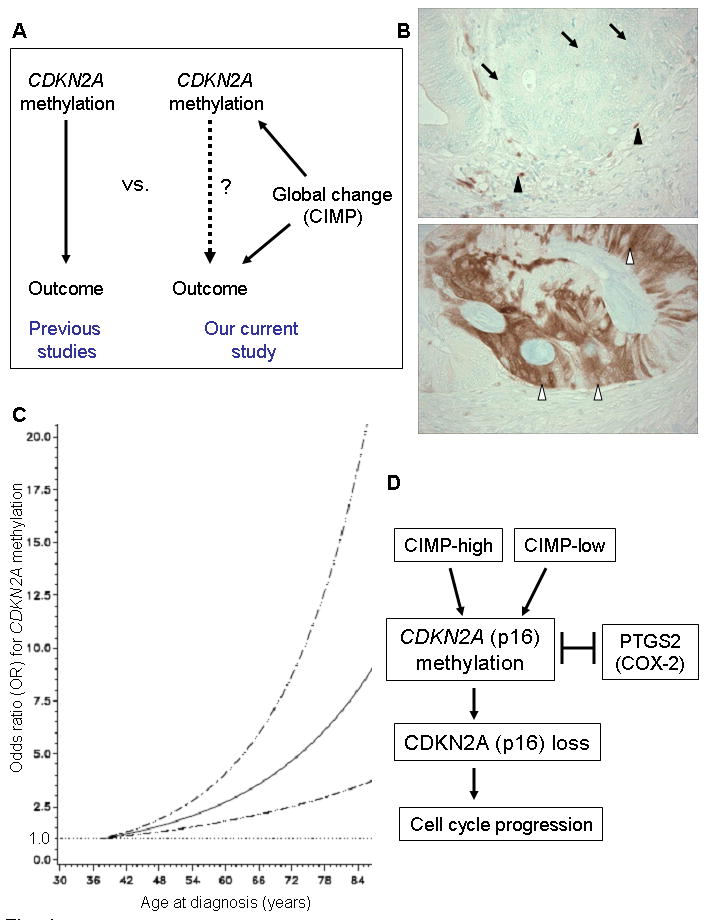
CDKN2A promoter methylation and CDKN2A (p16) loss in colorectal cancer
A. None of the previous studies14-30 on prognostic significance of CDKN2A has examined confounding effect of CIMP (CpG island methylator phenotype) status (left panel). Our current study (right panel) examined CDKN2A methylation as well as CIMP status and can assess prognostic effect of CDKN2A methylation independent of CIMP status.
B. CDKN2A (p16) expression in colorectal cancer. Colon cancer cells show loss of CDKN2A (p16) expression (top panel, arrows). Expression in mesenchymal and inflammatory cells (black arrowheads) serves as internal positive controls. Colon cancer cells show CDKN2A (p16) expression in nuclei and cytoplasm (bottom panel, white arrowheads).
C. Smoothing spline plot of unadjusted odds ratio (OR) for CDKN2A methylation according to age at diagnosis (compared to young age as a referent). Hatched lines indicate 95% confidence interval (CI).
D. Schematic representation of the potential relationship between CDKN2A promoter methylation, CDKN2A (p16) loss and other characteristics.
We therefore evaluated the prognostic role of CDKN2A promoter methylation and loss of CDKN2A (p16) independent of CIMP status, utilizing the database of a large number (N=902) of clinically and molecularly-annotated colorectal cancers. Since we concurrently assessed other important molecular features of colorectal cancer, we could adequately adjust for important confounders including CIMP status.
Materials and Methods
Study population
We utilized the database of two prospective cohort studies, the Nurses' Health Study (N=121,701 women followed since 1976)34 and the Health Professionals Follow-up Study (N=51,529 men followed since 1986).34 Every 2 years, cohort participants have been sent follow-up questionnaires to update information on potential risk factors and to identify newly diagnosed cancers in themselves and their first degree relatives. We collected paraffin-embedded tissue blocks from hospitals where patients underwent colorectal cancer resections.34 Hematoxylin and eosin (H&E) stained tissue sections from all colorectal cancer cases were confirmed by a pathologist (S.O.) unaware of other data. The tumor grade was categorized as low vs. high (≥50% vs. <50% gland formation). Positive family history of colorectal cancer was defined as the presence of colorectal cancer in any first-degree relative. We excluded cases which were preoperatively treated. Based on the availability of tumor tissue and data, 902 stage I-IV colorectal cancer cases diagnosed up to 2002 were included in this study (Table 2). Patients were observed until death or June 2008, whichever came first. The tumor tissue database utilized in this study included data of the 902 cases on statuses of MSI, CIMP, KRAS, BRAF, PIK3CA, LINE-1 methylation, TP53 (p53), CDKN1A (p21), CDKN1B (p27), CCND1 (cyclinD1), CTNNB1 (β-catenin), PTGS2 (COX-2) and FASN,9, 35-43 but not for CDKN2A (p16) expression. Our previous studies on the tumor markers used in our current study include: the relations between CDKN2A methylation, CIMP, KRAS mutation, and BRAF mutation (N=920);35 PIK3CA mutations (N=590);36 LINE-1 methylation (N=869);37 TP53 expression (N=892);9 CDKN1A (p21) expression (N=737);38 CDKN1B (p27) expression (N=853);39 CCND1 (cyclin D1) expression (N=865);40 CTNNB1 (β-catenin) expression (N=832);41 PTGS2 (COX-2)(N=751);42 and FASN expression (N=976).43 We have not examined CDKN2A (p16) loss in this cohort of 902 colorectal cancers. We have not examined prognostic effect of CDKN2A methylation or loss of expression in any of our previous studies. Furthermore, we have not examined the relationship of CDKN2A methylation or loss with any of the variables in Table 2, with the exception of the relations between CDKN2A methylation, CIMP, KRAS and BRAF.35 Informed consent was obtained from all study subjects. This study was approved by the Human Subjects Committees at Harvard School of Public Health and Brigham and Women's Hospital.
Table 2.
Clinical and molecular characteristics according to CDKN2A (p16) promoter methylation or loss of CDKN2A (p16) in colorectal cancer
| Clinical or molecular feature | CDKN2A (p16) promoter methylation | CDKN2A (p16) expression status | |||||
|---|---|---|---|---|---|---|---|
| All cases | (-) | (+) | P value | Expressed | Lost | P value | |
| Total N | 902 | 633 | 269 | 604 | 200 | ||
| Sex | 0.08 | 0.020 | |||||
| Male (HPFS) | 405 (45%) | 296 (47%) | 109 (41%) | 265 (44%) | 69 (35%) | ||
| Female (NHS) | 497 (55%) | 337 (53%) | 160 (59%) | 339 (56%) | 131 (65%) | ||
| Mean age ± SD | 66.4 ± 8.4 | 65.5 ± 8.6 | 68.5 ± 7.5 | <0.0001 | 66.0 ± 8.3 | 66.9 ± 8.2 | 0.17 |
| Body mass index | 0.48 | 0.36 | |||||
| <30 kg/m2 | 753 (83%) | 532 (84%) | 221 (82%) | 506 (84%) | 162 (81%) | ||
| ≥30 kg/m2 | 149 (17%) | 101 (16%) | 48 (18%) | 98 (16%) | 38 (19%) | ||
| Family history of colorectal cancer in any 1st degree relative | 0.87 | 0.67 | |||||
| Absent | 684 (76%) | 481 (76%) | 203 (75%) | 453 (75%) | 147 (74%) | ||
| Present | 218 (24%) | 152 (24%) | 66 (25%) | 151 (25%) | 53 (26%) | ||
| Year of diagnosis | 0.0063 | 0.37 | |||||
| Prior to 1995 | 424 (47%) | 316 (50%) | 108 (40%) | 297 (49%) | 91 (46%) | ||
| 1995 to 2004 | 476 (53%) | 315 (50%) | 161 (60%) | 307 (51%) | 109 (54%) | ||
| Tumor location | <0.0001 | <0.0001 | |||||
| Proximal colon | 385 (44%) | 217 (36%) | 168 (64%) | 228 (39%) | 122 (63%) | ||
| Distal colon | 282 (33%) | 225 (37%) | 57 (22%) | 213 (37%) | 42 (22%) | ||
| Rectum | 199 (23%) | 161 (27%) | 38 (14%) | 141 (24%) | 29 (15%) | ||
| Disease stage | 0.0009 | 0.045 | |||||
| I | 203 (23%) | 155 (24%) | 48 (18%) | 145 (24%) | 31 (16%) | ||
| II | 261 (29%) | 168 (27%) | 93 (35%) | 174 (29%) | 62 (31%) | ||
| III | 229 (25%) | 168 (27%) | 61 (23%) | 146 (24%) | 58 (29%) | ||
| IV | 106 (12%) | 62 (9.8%) | 44 (16%) | 77 (13%) | 34 (17%) | ||
| Unknown | 103 (11%) | 80 (13%) | 23 (8.6%) | 62 (10%) | 15 (7.5%) | ||
| Tumor grade | <0.0001 | <0.0001 | |||||
| Low | 802 (91%) | 591 (95%) | 211 (80%) | 550 (93%) | 157 (82%) | ||
| High | 83 (9.4%) | 29 (4.7%) | 54 (20%) | 41 (6.9%) | 34 (18%) | ||
| MSI | <0.0001 | <0.0001 | |||||
| MSS/MSI-low | 746 (85%) | 568 (93%) | 178 (68%) | 528 (90%) | 138 (72%) | ||
| MSI-high | 127 (15%) | 43 (7.0%) | 84 (32%) | 61 (10%) | 54 (28%) | ||
| CIMP | <0.0001 | <0.0001 | |||||
| CIMP-0 | 469 (52%) | 425 (67%) | 44 (16%) | 349 (60%) | 46 (25%) | ||
| CIMP-low | 292 (32%) | 188 (30%) | 104 (39%) | 180 (31%) | 64 (34%) | ||
| CIMP-high | 141 (16%) | 20 (3.2%) | 121 (45%) | 50 (8.6%) | 77 (41%) | ||
| KRAS mutation | 0.025 | 0.0025 | |||||
| (-) | 555 (63%) | 374 (61%) | 181 (69%) | 362 (61%) | 140 (73%) | ||
| (+) | 326 (37%) | 243 (39%) | 83 (31%) | 233 (39%) | 52 (27%) | ||
| BRAF mutation | <0.0001 | <0.0001 | |||||
| (-) | 746 (87%) | 574 (96%) | 172 (66%) | 537 (93%) | 128 (67%) | ||
| (+) | 113 (13%) | 25 (4.2%) | 88 (34%) | 41 (7.1%) | 62 (33%) | ||
| PIK3CA mutation | 0.17 | 0.52 | |||||
| (-) | 666 (85%) | 474 (86%) | 192 (82%) | 448 (84%) | 146 (86%) | ||
| (+) | 120 (15%) | 78 (14%) | 42 (18%) | 83 (16%) | 23 (14%) | ||
| Mean LINE-1 methylation (%) ± SD | 61.4 ± 9.6 | 60.8 ± 9.6 | 62.7 ± 9.4 | 0.0060 | 60.9 ± 9.5 | 61.4 ± 9.4 | 0.50 |
| TP53 (p53) expression | 0.14 | 0.22 | |||||
| (-) | 506 (57%) | 345 (55%) | 161 (61%) | 336 (56%) | 122 (61%) | ||
| (+) | 385 (43%) | 280 (45%) | 105 (39%) | 264 (44%) | 78 (39%) | ||
| CDKN1A (p21) | <0.0001 | 0.0014 | |||||
| expressed | 161 (19%) | 83 (14%) | 78 (30%) | 103 (17%) | 54 (28%) | ||
| lost | 702 (81%) | 523 (86%) | 179 (70%) | 492 (83%) | 140 (72%) | ||
| CDKN1B (p27) | <0.0001 | <0.0001 | |||||
| Loss of expression | 213 (25%) | 124 (21%) | 89 (36%) | 124 (22%) | 73 (39%) | ||
| Nuclear expression | 162 (19%) | 109 (18%) | 53 (21%) | 107 (19%) | 39 (21%) | ||
| Cytoplasmic expression | 464 (55%) | 358 (61%) | 106 (43%) | 343 (60%) | 76 (40%) | ||
| CCND1 (cyclin D1) expression | 0.17 | 0.80 | |||||
| (-) | 192 (24%) | 143 (25%) | 49 (21%) | 131 (24%) | 40 (23%) | ||
| (+) | 610 (76%) | 423 (75%) | 187 (79%) | 410 (76%) | 132 (77%) | ||
| CTNNB1 (β-catenin) activation score | <0.0001 | <0.0001 | |||||
| Low (0-2) | 498 (64%) | 330 (59%) | 168 (77%) | 311 (59%) | 135 (78%) | ||
| High (3-5) | 278 (36%) | 227 (41%) | 51 (23%) | 215 (41%) | 39 (22%) | ||
| PTGS2 (COX-2) expression | 0.0002 | 0.025 | |||||
| (-) | 148 (17%) | 85 (14%) | 63 (24%) | 86 (14%) | 42 (21%) | ||
| (+) | 744 (83%) | 541 (86%) | 203 (76%) | 516 (86%) | 158 (79%) | ||
| FASN expression | 0.27 | 0.61 | |||||
| (-) | 770 (88%) | 547 (89%) | 223 (86%) | 520 (89%) | 171 (87%) | ||
| (+) | 102 (12%) | 67 (11%) | 35 (14%) | 67 (11%) | 25 (13%) | ||
(%) indicates the proportion of tumors with a specific clinical or molecular feature in CDKN2A promoter methylated (or unmethylated) or CDKN2A (p16)-lost (or CDKN2A-expressing) tumors. The HUGO Gene Nomenclature Committee (HGNC)-approved official gene/protein symbols are used (www.genenames.org).
CIMP, CpG island methylator phenotype; HPFS, Health Professionals Follow-up Study; MSI, microsatellite instability; MSS, microsatellite stable; NHS, Nurses' Health Study; SD, standard deviation.
Pyrosequencing of KRAS, BRAF and PIK3CA, and microsatellite instability (MSI) analysis
Genomic DNA was extracted from paraffin embedded tissue. PCR and pyrosequencing targeted for KRAS (codons 12 and 13)44, BRAF (codon 600)45 and PIK3CA (exons 9 and 20) were performed.36 Microsatellite instability (MSI) analysis was performed using 10 microsatellite markers (D2S123, D5S346, D17S250, BAT25, BAT26, BAT40, D18S55, D18S56, D18S67 and D18S487).46 MSI-high was defined as instability in ≥30% of the markers, and MSI-low/microsatellite stable (MSS) as instability in 0-29% of markers.
Measurement of DNA methylation in CDKN2A, other CpG islands and LINE-1
Sodium bisulfite treatment on genomic DNA and subsequent real-time PCR (MethyLight) were validated and performed as previously described.47 PCR condition for CDKN2A and other CpG islands was; denaturation at 95°C for 10 min, followed by 45 cycles at 95°C for 15 seconds and 60°C for 1 min. We defined and validated the cut point for CDKN2A promoter methylation positivity (>4 percentage of methylated reference, or PMR) as previously described.47 In addition to CDKN2A, we quantified promoter methylation in 7 other CpG islands (CACNA1G, CRABP1, IGF2, MLH1, NEUROG1, RUNX3 and SOCS1) all of which have been shown to be specific for the CpG island methylator phenotype (CIMP).9, 35 CIMP-high was defined as the presence of ≥5/7 methylated markers, CIMP-low as the presence of 1/7 to 4/7 methylated markers, and CIMP-0 as the absence (0/7) of methylated markers. We did not include CDKN2A in the CIMP marker panel, because we needed to assess the effect of CDKN2A methylation independent of CIMP. If the CIMP panel included CDKN2A, the CIMP status and CDKN2A methylation would have been collinear. Our seven-marker panel included a five-marker CIMP panel (CACNA1G, IGF2, NEUROG1, RUNX3 and SOCS1) selected by Weisenberger et al.48 and these two panels worked in almost the same way; there was a very high concordance (99%, κ=0.96, p<0.0001) between CIMP-high defined by our seven marker panel and the Weisenberger panel.48 In order to accurately quantify relatively high LINE-1 methylation levels, we used PCR-Pyrosequencing as previously described and validated.37, 49
Immunohistochemical analyses
Methods of immunohistochemical procedures and interpretation were previously described as follows: TP53, PTGS2 (COX-2), and FASN,46 CTNNB1 (β-catenin),41 CDKN1A (p21),38 CDKN1B (p27),39 CCND1 (cyclin D1).40 For CDKN2A (p16) immunohistochemistry, antigen retrieval was performed by incubating deparaffinized tissue sections in 10 mM citrate buffer (BioGenex) by a microwave for 30 min. Tissue sections were incubated with 3% H2O2 (20 min) to block endogenous peroxidase for 20 min, and then incubated with 10% horse serum (Vector Laboratories) in phosphated buffered saline (20 min). Primary antibody Ab-7 clone against CDKN2A (LabVision, Fremont, CA) (dilution 1:200) was applied for overnight at 4 °C. Secondary antibody (Vector Laboratories) (30 min), and then avidin biotin complex conjugate (Vector Laboratories) were applied (30 min). Sections were visualized by diaminobenzidine (DAB) (5 min) and methyl-green counterstain. Stromal and inflammatory cells served as internal positive controls for CDKN2A (p16) immunohistochemistry (Figure 1). Appropriate positive and negative controls were included in each run of immunohistochemistry. Expression of CDKN2A (p16) was observed as the presence of moderate or strong nuclear and cytoplasmic staining. Loss of CDKN2A (p16) was defined as the absence of staining or only weak nuclear and/or cytoplasmic staining of tumor cells. The concordance between loss of CDKN2A (p16) and CDKN2A promoter methylation was 82.4% (κ=0.56).
Each immunohistochemical marker was interpreted by one of the investigators [CDKN2A (p16), CDKN1A, CDKN1B, TP53, FASN and PTGS2 by S.O.; CTNNB1 and CCND1 by K.N.] unaware of other data. For agreement studies, a random selection of more than 100 cases was examined for each marker by a second pathologist (K.S., K.N., Y.B., or S.O.) unaware of other data. Since our current study utilized a large sample size, an agreement study on a fraction of cases was a reasonable method to assess the interobserver reproducibility of scoring for each immunohistochemical marker. The concordance between the two observers (all p<0.0001) was 0.90 for CDKN2A (p16; κ= 0.70), 0.87 for TP53 (κ=0.75), 0.83 for CDKN1A (κ=0.62), 0.94 for CDKN1B (κ=0.60), 0.83 for CCND1 (κ=0.64), 0.83 for CTNNB1 (κ=0.65), 0.92 for PTGS2 (κ=0.62) and 0.93 for FASN (κ=0.57), indicating to good to substantial agreement.
Statistical analysis
All statistical analysis was performed by SAS program (Version 9.1, SAS Institute, Cary, NC). All p values were two-sided. Except for survival analysis on the main exposure variables (CDKN2A methylation and loss), a p value for statistical significance was adjusted for multiple hypothesis testing by Bonferroni correction, requiring the statistical significance at p=0.0021 (=0.05/24). The chi-square test (or Fisher's exact test if any of expected cell count <5) was performed for categorical variables. We computed odds ratio (OR) of CDKN2A promoter methylation according to age as a continuous variable non-parametrically with restricted cubic splines. A multivariate logistic regression analysis was performed to examine an independent relation between CDKN2A promoter methylation [or CDKN2A (p16)] loss and each of the clinical, pathological and other molecular variables. The model initially included age at diagnosis (continuous), sex, tumor location (proximal colon vs. distal colon vs. rectum), body mass index (BMI) (<30 vs. ≥30 kg/m2), disease stage (I-II vs. III-IV), tumor grade (low vs. high), family history (present vs. absent), CIMP status (high vs. low vs. CIMP-0), MSI status (high vs. low/MSS), LINE-1 methylation (continuous), KRAS, BRAF, TP53, CDKN1A, CDKN1B, CCND1, CTNNB1, PTGS2 and FASN. A stepwise backward elimination with p=0.20 as a threshold to limit the number of variables in the final model. For cases with missing information in any of the categorical variables [tumor location (4.0%), tumor grade (1.9%), MSI (3.2%), KRAS (2.3%), BRAF (4.8%), TP53 (1.2%), CDKN1A (4.3%), CDKN1B (7.0%), CCND1 (11%), CTNNB1 (14%), PTGS2 (1.1%) and FASN (3.3%)], we included those cases in a majority category in the initial model. In the final model, we used a “missing” indicator variable as a separate category in each covariate. We confirmed that excluding cases with missing information in any of the covariates did not substantially alter results (data not shown).
For survival analysis, the Kaplan-Meier method and log-rank test were used. For analyses of colorectal cancer-specific mortality, deaths as a result of causes other than colorectal cancer were censored. The model initially included age at diagnosis, sex, year of diagnosis, BMI, family history of colorectal cancer, tumor location, grade, MSI, CIMP, LINE-1 methylation, KRAS, BRAF, TP53, CDKN1A, CDKN1B, CCND1, CTNNB1 and FASN. A backward stepwise elimination was performed with p=0.20 as a threshold to limit the number of variables in the final model. Multivariate stage-stratified Cox regression analysis took advantage of the “strata” option in the SAS “proc phreg” command, and could adjust for disease stage and other variables at the same time. Stage-stratified analysis model could adjust for stage while it did not use any degree of freedom for stage adjustment, and thus could be used to avoid both overfitting and residual confounding by stage. An interaction was assessed by including the cross product of the CDKN2A methylation [or loss of CDKN2A (p16)] variable and another variable of interest (without data-missing cases) in a multivariate model, and the Wald test was performed. A p value for statistical significance was adjusted for multiple hypothesis testing by Bonferroni correction, requiring the statistical significance at p=0.0021 (=0.05/24).
Results
CDKN2A methylation and loss of CDKN2A (p16) in colorectal cancer
Utilizing the database of 902 colorectal cancers in the two prospective cohort studies, CDKN2A promoter methylation was detected in 269 tumors (30%) by real-time PCR. Loss of CDKN2A (p16) expression was detected in 200 (25%) of 804 tumors with available immunohistochemical data. With our large sample size, an agreement study on a proportion of cases was a reasonable method to assess the interobserver reproducibility for scoring of CDKN2A (p16) or any of the other immunohistochemical markers.
CDKN2A (p16) loss was significantly more common in CDKN2A-methylated tumors [61%=140/228; odds ratio (OR), 16.6; 95% confidence interval (CI), 11.1-24.8; p<0.0001] than in CDKN2A-unmethylated tumors (8.7%=47/538). CDKN2A methylation was significantly associated with old age (p<0.0001), proximal tumor location (p<0.0001), disease stage (p=0.0009), microsatellite instability (MSI) (p<0.0001), and the CpG island methylator phenotype (CIMP) (p<0.0001) (Table 2). Thus, CIMP could be a substantial confounder for analysis of CDKN2A methylation and prognosis (Figure 1A). With our large dataset, we could examine the prognostic effect of CDKN2A methylation independent of CIMP status [i.e., multivariate analysis summarizing CDKN2A-methylated (N=121) vs. unmethylated (N=20) in CIMP-high tumors and CDKN2A-methylated (N=148) vs. unmethylated (N=613) in non-CIMP-high tumors, adjusted for other variables].
We examined the relation between age at diagnosis and CDKN2A promoter methylation, using restricted cubic splines (Figure 1C). As patient age increased, the odds for CDKN2A promoter methylation increased.
Multivariate analysis to assess relations with CDKN2A methylation or loss of CDKN2A (p16)
Since there were many interrelated variables associated with CDKN2A methylation, we performed multivariate logistic regression analysis to assess independent relations of those variables with CDKN2A methylation [or loss of CDKN2A (p16)] (Table 3). CDKN2A methylation was independently associated with CIMP-high (p<0.0001) and CIMP-low (p<0.0001), inversely with PTGS2 (COX-2, p=0.0008). Because of multiple hypothesis testing, a p value for significance was adjusted to p=0.0021 (=0.05/24) by Bonferroni correction. Thus, any of the relations of CDKN2A methylation with BRAF mutation, high tumor grade, old age and TP53 expression (p value between 0.0024 and 0.0077) could be a chance association given multiple hypothesis testing. Figure 1D summarizes the potential relations between CDKN2A methylation and other molecular alterations.
Table 3.
Multivariate logistic regression analysis for CDKN2A methylation or CDKN2A (p16) loss (as an outcome variable) in colorectal cancer
| Variables in the final model for CDKN2A methylation (as an outcome variable) | Multivariate OR (95% CI) | P value |
|---|---|---|
| CIMP-high (vs. CIMP-0) | 39.6 (20.6-76.1) | <0.0001 |
| CIMP-low (vs. CIMP-0) | 5.30 (3.52-8.00) | <0.0001 |
| PTGS2 (COX-2) expression | 0.45 (0.28-0.72) | 0.0008 |
| BRAF mutation | 2.62 (1.41-4.90) | 0.0024 |
| High tumor grade (vs. low tumor grade) | 2.50 (1.33-4.70) | 0.0045 |
| Age (10-year increment as a unit) | 1.38 (1.09-1.74) | 0.0067 |
| TP53 expression | 1.70 (1.15-2.52) | 0.0077 |
| Body mass index ≥30 kg/m2 (vs. <30 kg/m2) | 1.41 (0.87-2.27) | 0.17 |
| Variables in the final model for CDKN2A (p16) loss (as an outcome variable) | Multivariate OR (95% CI) | P value |
| CDKN2A methylation | 12.7 (7.84-20.7) | <0.0001 |
| CIMP-high (vs. CIMP-0) | 2.23 (1.20-4.18) | 0.012 |
| Disease stage III-IV (vs. stage I-II) | 1.52 (0.98-2.36) | 0.061 |
| KRAS mutation | 0.67 (0.43-1.05) | 0.082 |
| LINE-1 methylation | 1.76 (0.90-3.46) | 0.099 |
The multivariate logistic regression model for CDKN2A methylation initially included sex, age at diagnosis, tumor location, body mass index, family history of colorectal cancer, disease stage, tumor grade, CIMP, MSI, KRAS, BRAF, LINE-1 methylation, TP53, CDKN1A, CDKN1B, CCND1, CTNNB1, PTGS2 and FASN. A backward stepwise elimination with a threshold of p=0.20 was used to select variables in the final models. The multivariate model for CDKN2A (p16) loss initially included CDKN2A methylation in addition to the above variables, and a backward stepwise elimination was performed.
CI, confidence interval; CIMP, CpG island methylator phenotype; MSI, microsatellite instability; OR, odds ratio.
CDKN2A methylation, loss of CDKN2A (p16) and survival of colorectal cancer patients
Among 902 eligible patients with adequate follow-up (146 months of median overall survival in all censored cases), there were 409 deaths including 235 colorectal cancer-specific deaths. In Kaplan-Meier analysis, 5-year overall survival was significantly lower in CDKN2A-methylated cases than CDKN2A-unmethylated cases (46% vs. 55%; log-rank p=0.0035) (Figure 2).
Figure 2.
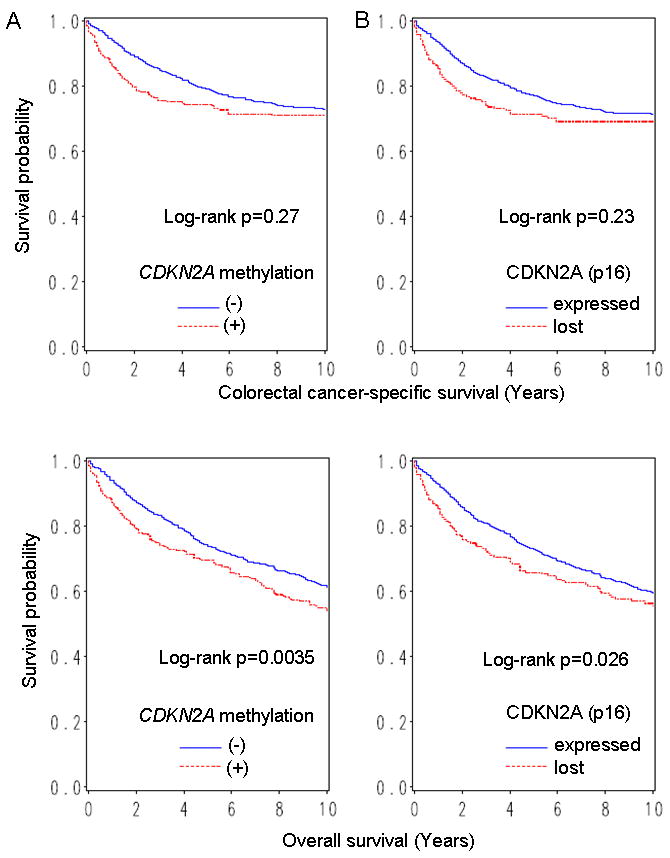
Kaplan-Meier curves for colorectal cancer-specific survival (upper panel) and overall survival (lower panel), according to CDKN2A promoter methylation (A) or loss of CDKN2A (p16) (B) in colorectal cancer.
In univariate Cox regression analysis, CDKN2A methylation was associated with a significant increase in overall mortality [hazard ratio (HR) 1.36; 95% CI, 1.10-1.66; p=0.0036] (Table 4). However, in multivariate analysis, CDKN2A methylation was not significantly associated with overall survival (multivariate HR 1.03; 95% CI, 0.82-1.31). The apparent adverse effect of CDKN2A methylation in the univariate model was principally the result of confounding by age and tumor grade; when we simply adjusted for these confounders, the adjusted HR for overall mortality was 1.10 (95% CI, 0.89-1.37; CDKN2A-methylated vs. unmethylated). No other major confounder was observed.
Table 4.
CDKN2A (p16) promoter methylation and CDKN2A (p16) loss in colorectal cancer and patient mortality
| Total N | Colorectal cancer-specific mortality | Overall mortality | |||||
|---|---|---|---|---|---|---|---|
| Deaths / person-years | Univariate HR (95% CI) | Multivariate stage-matched HR (95% CI) | Deaths / person-years | Univariate HR (95% CI) | Multivariate stage-matched HR (95% CI) | ||
| CDKN2A | |||||||
| Unmethylated | 633 | 159/5724 | 1 (referent) | 1 (referent) | 267/5724 | 1 (referent) | 1 (referent) |
| Methylated | 269 | 76/2189 | 1.17 (0.89-1.54) | 0.85 (0.61-1.18) | 142/2189 | 1.36 (1.10-1.66) | 1.03 (0.82-1.31) |
| P value | 0.27 | 0.33 | 0.0036 | 0.78 | |||
| CDKN2A (p16) | |||||||
| Expressed | 604 | 163/5381 | 1 (referent) | 1 (referent) | 264/5381 | 1 (referent) | 1 (referent) |
| Lost | 200 | 60/1597 | 1.20 (0.89-1.61) | 1.03 (0.72-1.47) | 103/1597 | 1.30 (1.03-1.63) | 1.08 (0.83-1.42) |
| P value | 0.23 | 0.88 | 0.026 | 0.55 | |||
The multivariate, stage-matched (stratified) Cox regression model initially included the CDKN2A (p16) promoter methylation or CDKN2A (p16) variable, sex, age at diagnosis, year of diagnosis, tumor location, body mass index, family history of colorectal cancer, tumor grade, CIMP, MSI, KRAS, BRAF, LINE-1 methylation, TP53, CDKN1A, CDKN1B, CCND1, CTNNB1 and FASN. A backward stepwise elimination with a threshold of p=0.20 was used to select variables in the final models. Stage adjustment (I, IIA, IIB, IIIA, IIIB, IIIC, IV, unknown) was done using the “strata” option in the SAS “proc phreg” command.
CI, confidence interval; HR, hazard ratio.
Influence of CDKN2A (p16) loss on patient survival was examined in 804 colorectal cancer patients with CDKN2A (p16) expression data. In Kaplan-Meier analysis, 5-year overall survival was significantly lower in CDKN2A (p16)-lost cases than CDKN2A (p16)-expressing cases (46% vs. 54%; log rank p=0.026) (Figure 2). In univariate Cox regression analysis, loss of CDKN2A (p16) was associated with a significant increase in overall mortality (HR 1.30; 95% CI, 1.03-1.63; p=0.026) (Table 4). However, in multivariate analysis, loss of CDKN2A (p16) was not significantly associated with overall survival (HR 1.08; 95% CI, 0.83-1.42).
In addition to multivariate stage-stratified Cox model, we constructed multivariate Cox model including disease stage as indicator variables, and obtained very similar results (data not shown).
Modifying effect of other variables on the relation between CDKN2A (p16) and mortality
A previous study (total N=90) showed that CDKN2A methylation was associated with poor prognosis among KRAS-wild-type cases (N=55) (HR 3.3; 95% CI, 1.0-10.5),15 and another study showed that, among colorectal cancers that displayed budding at infiltrative front with CTNNB1 nuclear expression (N=82), CDKN2A (p16) expression was associated with high mortality (p<0.001).30 In light of these findings, we examined whether the prognostic influence of CDKN2A methylation [or CDKN2A (p16) loss] was modified by KRAS, CTNNB1 or any of the other variables we examined. As results, we found no significant modifying effect by any of the variables (p>0.03; given multiple hypothesis testing, a statistical significance level was adjusted to p=0.0021 by Bonferroni correction). Notably, there was no significant modifying effect by KRAS (p>0.4), CTNNB1 (p>0.5) or tumor location (colon vs. rectum) (p>0.1).
Discussion
We conducted this study to examine prognostic effect of CDKN2A (p16) promoter methylation and loss of CDKN2A (p16) independent of the CpG island methylator phenotype (CIMP), utilizing 902 clinically and molecularly-annotated colorectal cancers. CDKN2A methylation has been associated with CIMP, which has been associated with patient prognosis.21, 31, 32 However, none of the previous studies14-30 has examined prognostic effect of CDKN2A methylation or loss of CDKN2A (p16) in colorectal cancer independent of CIMP status. Furthermore, sample sizes were relatively small (N<200) in all but one study (N=404).16 Our resource of the 902 colorectal cancers identified in the two prospective cohort studies has enabled us to precisely estimate the frequency of colorectal cancers with a specific molecular feature (CDKN2A methylation, CIMP-high, etc.). The large number of cases has also provided a sufficient power in our multivariate logistic regression analysis and survival analysis. In our current study, we have found that CDKN2A methylation or loss of CDKN2A (p16) is not independently associated with prognosis of colorectal cancer patients. On the other hand, CDKN2A methylation is independently associated with CIMP, inactive PTGS2 (COX-2) and BRAF mutation. This study provides robust and useful data on CDKN2A promoter methylation and loss of expression in colorectal cancer.
Prognostic significance of CDKN2A promoter methylation or loss of CDKN2A (p16) in colorectal cancer14-30 or normal-appearing mucosa adjacent to colorectal cancer50 has been studied (Table 1). Without analysis of CIMP that is a potential confounder, some studies reported that CDKN2A methylation was significantly associated with worse prognosis in multivariate analysis;17, 23 however, those studies were limited by small sample sizes (N=90 and N=151, respectively). In contrast, a study on 182 stage IV cases in a five-arm trial21 or another study (N=104)19 did not show an independent prognostic effect of CDKN2A methylation, which is in agreement with our current data.
With regard to loss of CDKN2A (p16) expression, one study (N=117) reported an association between CDKN2A (p16) loss and high mortality,26 whereas two larger studies by Lam et al.29 (N=194) and by Norrie et al.16 (total N=404; N=161 for immunohistochemistry) found no prognostic role of p16 loss, in agreement with our current data. Essentially, there has been no definitive evidence to support an independent prognostic role of CDKN2A methylation or loss of expression in colorectal cancer.
It should be noted that small studies are more prone to “publication bias” than large studies. This phenomenon of publication bias happens because studies with null findings have a higher likelihood of being unwritten and unpublished compared to those with significant results. Large studies with adequate statistical power are less prone to publication bias even with null data. Therefore, we should weigh more on large-scale studies when we evaluate the published literature on prognostic significance of any biomarker.
Examining molecular changes or prognostic factors is important in cancer research.51-57 A molecular classification based on MSI and CIMP status is increasingly important, because MSI and CIMP reflect global genomic and epigenomic aberrations in tumor cells.58 LINE-1 methylation also reflects global DNA methylation level. MSI, CIMP, LINE-1 methylation, and related molecular events such as BRAF mutation, are important potential confounders, because these molecular features have been associated with prognosis in large-scale studies.21, 31, 32, 59 Our current study is the only one study that assessed the prognostic significance of CDKN2A methylation and loss of CDKN2A (p16) independent of these potential confounders.
As expected from the likely causal link, CIMP-high is associated with CDKN2A promoter methylation. According to our previous study,32 CIMP-high appears to be an independent predictor of low colon cancer-specific mortality. It has been well known that two features which are associated with each other do not always demonstrate similar independent prognostic effects. This is well exemplified by BRAF mutation and MSI in colon cancer. Studies have shown that BRAF mutation is associated with MSI-high.9, 52, 58 BRAF mutation in colon cancer has been associated with poor prognosis,32, 52, 60 whereas MSI-high has been associated with good prognosis.61 Therefore, it is not surprising to find the significant prognostic role of CIMP-high and no independent prognostic role of CDKN2A methylation.
There are limitations in this study. For example, data on cancer treatment were limited. Nonetheless, it is unlikely that chemotherapy use substantially differed according to CDKN2A methylation or loss of CDKN2A (p16) in tumor, since such data were not available for treatment decision making. In addition, beyond cause of mortality, data on cancer recurrences were not available in these cohorts. Nonetheless, given the median survival for metastatic colon cancer was approximately 10-12 months during much of the time period of this study, colorectal cancer-specific survival may be a reasonable surrogate of colorectal cancer-specific outcome.
There are advantages in utilizing the database of the two prospective cohort studies, the Nurses' Health Study and the Health Professionals Follow-up Study to examine prognostic significance of CDKN2A methylation or loss of CDKN2A (p16). Anthropometric measurements, family history, other clinical information, pathologic and tumor staging data, and tumoral molecular features were prospectively collected, blinded to patient outcome. For each immunohistochemical marker, an agreement study on a proportion of cases from a large number of cases was used to assess the interobserver reproducibility of scoring. Cohort participants who developed cancer were treated at hospitals throughout the U.S., and thus more representative colorectal cancers in the general U.S. population than patients in one to several academic hospitals. There were no demographic difference between cases with tumor tissue analyzed and those without tumor tissue analyzed.34 Finally, our rich tumor database enabled us to simultaneously assess pathologic and tumoral molecular features and control for confounding by a number of tumoral molecular alterations.
In conclusion, in our large database of colorectal cancers, CDKN2A methylation or loss of CDKN2A (p16) is not independently associated with prognosis. On the other hand, CDKN2A methylation is independently associated with CIMP status, low PTGS2 expression. Further studies are needed to elucidate the exact mechanisms by which CDKN2A methylation or loss of CDKN2A (p16) leads to colorectal cancer development.
Acknowledgments
We deeply thank the Nurses' Health Study and Health Professionals Follow-up Study cohort participants who have generously agreed to provide us with biological specimens and information through responses to questionnaires; and hospitals and pathology departments throughout the US for providing us with medical records and tumor tissue specimens.
This work was supported by U.S. National Institute of Health (NIH) grants P01 CA87969 (S. Hankinson), P01 CA55075 (W. Willett), P50 CA127003 (to CSF) and K07 CA122826 (to SO), and in part by grants from the Bennett Family Fund and from the Entertainment Industry Foundation through National Colorectal Cancer Research Alliance. K.N. was supported by a fellowship grant from the Japan Society for Promotion of Science. The content is solely the responsibility of the authors and does not necessarily represent the official views of NCI or NIH. The funders had no role in study design, data collection and analysis, decision to publish, or preparation of the manuscript.
Abbreviations and the HUGO Gene Nomenclature Committee-approved official gene symbol
- BMI
body mass index
- CDKN2A
cyclin-dependent kinase inhibitor 2A (p16)
- CI
confidence interval
- CIMP
CpG island methylator phenotype
- HR
hazard ratio
- MSI
microsatellite instability
- MSS
microsatellite stable
- OR
odds ratio
Footnotes
No conflicts of interest exist.
The novelty and impact of this paper:
- 1. In this by-far-the-largest study on the prognostic role of CDKN2A in colorectal cancer, utilizing the database of 902 tumors, we evaluated the prognostic roles of CDKN2A methylation and loss of CDKN2A (p16), independent of the CpG island methylator phenotype (CIMP) status.
- 2. Because of a well-known phenomenon of “publication bias”, one should weigh more on a large-scale study (such as our current study), when evaluating the published literature on a prognostic biomarker (such as CDKN2A) in colorectal cancer.
References
- 1.Collado M, Blasco MA, Serrano M. Cellular senescence in cancer and aging. Cell. 2007;130:223–33. doi: 10.1016/j.cell.2007.07.003. [DOI] [PubMed] [Google Scholar]
- 2.Liu Y, Sharpless NE. Tumor suppressor mechanisms in immune aging. Curr Opin Immunol. 2009;21:431–9. doi: 10.1016/j.coi.2009.05.011. [DOI] [PMC free article] [PubMed] [Google Scholar]
- 3.Esteller M, Corn PG, Baylin SB, Herman JG. A gene hypermethylation profile of human cancer. Cancer Res. 2001;61:3225–9. [PubMed] [Google Scholar]
- 4.Paya A, Alenda C, Perez-Carbonell L, Rojas E, Soto JL, Guillen C, Castillejo A, Barbera VM, Carrato A, Castells A, Llor X, Andreu M, et al. Utility of p16 immunohistochemistry for the identification of Lynch syndrome. Clin Cancer Res. 2009;15:3156–62. doi: 10.1158/1078-0432.CCR-08-3116. [DOI] [PMC free article] [PubMed] [Google Scholar]
- 5.Gibson SL, Boquoi A, Chen T, Sharpless NE, Brensinger C, Enders GH. p16(Ink4a) inhibits histologic progression and angiogenic signaling in min colon tumors. Cancer Biol Ther. 2005;4:1389–94. doi: 10.4161/cbt.4.12.2303. [DOI] [PMC free article] [PubMed] [Google Scholar]
- 6.Furth EE, Gustafson KS, Dai CY, Gibson SL, Menard-Katcher P, Chen T, Koh J, Enders GH. Induction of the tumor-suppressor p16(INK4a) within regenerative epithelial crypts in ulcerative colitis. Neoplasia. 2006;8:429–36. doi: 10.1593/neo.06169. [DOI] [PMC free article] [PubMed] [Google Scholar]
- 7.Samowitz WS, Albertsen H, Herrick J, Levin TR, Sweeney C, Murtaugh MA, Wolff RK, Slattery ML. Evaluation of a large, population-based sample supports a CpG island methylator phenotype in colon cancer. Gastroenterology. 2005;129:837–45. doi: 10.1053/j.gastro.2005.06.020. [DOI] [PubMed] [Google Scholar]
- 8.Barault L, Charon-Barra C, Jooste V, de la Vega MF, Martin L, Roignot P, Rat P, Bouvier AM, Laurent-Puig P, Faivre J, Chapusot C, Piard F. Hypermethylator phenotype in sporadic colon cancer: study on a population-based series of 582 cases. Cancer Res. 2008;68:8541–6. doi: 10.1158/0008-5472.CAN-08-1171. [DOI] [PubMed] [Google Scholar]
- 9.Nosho K, Irahara N, Shima K, Kure S, Kirkner GJ, Schernhammer ES, Hazra A, Hunter DJ, Quackenbush J, Spiegelman D, Giovannucci EL, Fuchs CS, et al. Comprehensive biostatistical analysis of CpG island methylator phenotype in colorectal cancer using a large population-based sample. PLoS ONE. 2008;3:e3698. doi: 10.1371/journal.pone.0003698. [DOI] [PMC free article] [PubMed] [Google Scholar]
- 10.Suehiro Y, Wong CW, Chirieac LR, Kondo Y, Shen L, Webb CR, Chan YW, Chan AS, Chan TL, Wu TT, Rashid A, Hamanaka Y, et al. Epigenetic-genetic interactions in the APC/WNT, RAS/RAF, and P53 pathways in colorectal carcinoma. Clin Cancer Res. 2008;14:2560–9. doi: 10.1158/1078-0432.CCR-07-1802. [DOI] [PMC free article] [PubMed] [Google Scholar]
- 11.Toyota M, Ahuja N, Ohe-Toyota M, Herman JG, Baylin SB, Issa JP. CpG island methylator phenotype in colorectal cancer. Proc Natl Acad Sci U S A. 1999;96:8681–6. doi: 10.1073/pnas.96.15.8681. [DOI] [PMC free article] [PubMed] [Google Scholar]
- 12.Teodoridis JM, Hardie C, Brown R. CpG island methylator phenotype (CIMP) in cancer: causes and implications. Cancer Lett. 2008;268:177–86. doi: 10.1016/j.canlet.2008.03.022. [DOI] [PubMed] [Google Scholar]
- 13.Kim J, Shin S, Kwon H, Cho N, Kang GH. Prognostic implications of CpG island hypermethylator phenotype in colorectal cancers. Virchow Arch. 2009;455:485–94. doi: 10.1007/s00428-009-0857-0. [DOI] [PubMed] [Google Scholar]
- 14.Liang JT, Chang KJ, Chen JC, Lee CC, Cheng YM, Hsu HC, Wu MS, Wang SM, Lin JT, Cheng AL. Hypermethylation of the p16 gene in sporadic T3N0M0 stage colorectal cancers: association with DNA replication error and shorter survival. Oncology. 1999;57:149–56. doi: 10.1159/000012023. [DOI] [PubMed] [Google Scholar]
- 15.Esteller M, Gonzalez S, Risques RA, Marcuello E, Mangues R, Germa JR, Herman JG, Capella G, Peinado MA. K-ras and p16 aberrations confer poor prognosis in human colorectal cancer. J Clin Oncol. 2001;19:299–304. doi: 10.1200/JCO.2001.19.2.299. [DOI] [PubMed] [Google Scholar]
- 16.Norrie MW, Hawkins NJ, Todd AV, Meagher AP, O'Connor TW, Ward RL. Inactivation of p16INK4a by CpG hypermethylation is not a frequent event in colorectal cancer. J Surg Oncol. 2003;84:143–50. doi: 10.1002/jso.10310. [DOI] [PubMed] [Google Scholar]
- 17.Maeda K, Kawakami K, Ishida Y, Ishiguro K, Omura K, Watanabe G. Hypermethylation of the CDKN2A gene in colorectal cancer is associated with shorter survival. Oncol Rep. 2003;10:935–8. [PubMed] [Google Scholar]
- 18.Kohonen-Corish MR, Daniel JJ, Chan C, Lin BP, Kwun SY, Dent OF, Dhillon VS, Trent RJ, Chapuis PH, Bokey EL. Low microsatellite instability is associated with poor prognosis in stage C colon cancer. J Clin Oncol. 2005;23:2318–24. doi: 10.1200/JCO.2005.00.109. [DOI] [PubMed] [Google Scholar]
- 19.Sanz-Casla MT, Maestro ML, Vidaurreta M, Maestro C, Arroyo M, Cerdan J. p16 Gene methylation in colorectal tumors: correlation with clinicopathological features and prognostic value. Dig Dis. 2005;23:151–5. doi: 10.1159/000088597. [DOI] [PubMed] [Google Scholar]
- 20.Ishiguro A, Takahata T, Saito M, Yoshiya G, Tamura Y, Sasaki M, Munakata A. Influence of methylated p15 and p16 genes on clinicopathological features in colorectal cancer. J Gastroenterol Hepatol. 2006;21:1334–9. doi: 10.1111/j.1440-1746.2006.04137.x. [DOI] [PubMed] [Google Scholar]
- 21.Shen L, Catalano PJ, Benson AB, 3rd, O'Dwyer P, Hamilton SR, Issa JP. Association between DNA methylation and shortened survival in patients with advanced colorectal cancer treated with 5-fluorouracil based chemotherapy. Clin Cancer Res. 2007;13:6093–8. doi: 10.1158/1078-0432.CCR-07-1011. [DOI] [PMC free article] [PubMed] [Google Scholar]
- 22.Krtolica K, Krajnovic M, Usaj-Knezevic S, Babic D, Jovanovic D, Dimitrijevic B. Comethylation of p16 and MGMT genes in colorectal carcinoma: correlation with clinicopathological features and prognostic value. World J Gastroenterol. 2007;13:1187–94. doi: 10.3748/wjg.v13.i8.1187. [DOI] [PMC free article] [PubMed] [Google Scholar]
- 23.Mitomi H, Fukui N, Tanaka N, Kanazawa H, Saito T, Matsuoka T, Yao T. Aberrant p16(INK4a) methylation is a frequent event in colorectal cancers: prognostic value and relation to mRNA expression and immunoreactivity. J Cancer Res Clin Oncol. 2009 doi: 10.1007/s00432-009-0688-z. [DOI] [PMC free article] [PubMed] [Google Scholar]
- 24.Kim JC, Choi JS, Roh SA, Cho DH, Kim TW, Kim YS. Promoter Methylation of Specific Genes is Associated with the Phenotype and Progression of Colorectal Adenocarcinomas. Ann Surg Oncol. 2010 doi: 10.1245/s10434-009-0901-y. in press (published online. [DOI] [PubMed] [Google Scholar]
- 25.Zhao P, Hu YC, Talbot IC. Expressing patterns of p16 and CDK4 correlated to prognosis in colorectal carcinoma. World J Gastroenterol. 2003;9:2202–6. doi: 10.3748/wjg.v9.i10.2202. [DOI] [PMC free article] [PubMed] [Google Scholar]
- 26.Cui X, Shirai Y, Wakai T, Yokoyama N, Hirano S, Hatakeyama K. Aberrant expression of pRb and p16(INK4), alone or in combination, indicates poor outcome after resection in patients with colorectal carcinoma. Hum Pathol. 2004;35:1189–95. doi: 10.1016/j.humpath.2004.06.010. [DOI] [PubMed] [Google Scholar]
- 27.Gonzalez-Quevedo R, Garcia-Aranda C, Moran A, De Juan C, Sanchez-Pernaute A, Torres A, Diaz-Rubio E, Balibrea JL, Benito M, Iniesta P. Differential impact of p16 inactivation by promoter methylation in non-small cell lung and colorectal cancer: clinical implications. Int J Oncol. 2004;24:349–55. [PubMed] [Google Scholar]
- 28.Lyall MS, Dundas SR, Curran S, Murray GI. Profiling markers of prognosis in colorectal cancer. Clin Cancer Res. 2006;12:1184–91. doi: 10.1158/1078-0432.CCR-05-1864. [DOI] [PubMed] [Google Scholar]
- 29.Lam AK, Ong K, Giv MJ, Ho YH. p16 expression in colorectal adenocarcinoma: marker of aggressiveness and morphological types. Pathology. 2008;40:580–5. doi: 10.1080/00313020802320713. [DOI] [PubMed] [Google Scholar]
- 30.Wassermann S, Scheel SK, Hiendlmeyer E, Palmqvist R, Horst D, Hlubek F, Haynl A, Kriegl L, Reu S, Merkel S, Brabletz T, Kirchner T, et al. p16INK4a is a beta-catenin target gene and indicates low survival in human colorectal tumors. Gastroenterology. 2009;136:196–205 e2. doi: 10.1053/j.gastro.2008.09.019. [DOI] [PubMed] [Google Scholar]
- 31.Ward RL, Cheong K, Ku SL, Meagher A, O'Connor T, Hawkins NJ. Adverse prognostic effect of methylation in colorectal cancer is reversed by microsatellite instability. J Clin Oncol. 2003;21:3729–36. doi: 10.1200/JCO.2003.03.123. [DOI] [PubMed] [Google Scholar]
- 32.Ogino S, Nosho K, Kirkner GJ, Kawasaki T, Meyerhardt JA, Loda M, Giovannucci EL, Fuchs CS. CpG island methylator phenotype, microsatellite instability, BRAF mutation and clinical outcome in colon cancer. Gut. 2009;58:90–6. doi: 10.1136/gut.2008.155473. [DOI] [PMC free article] [PubMed] [Google Scholar]
- 33.Van Rijnsoever M, Elsaleh H, Joseph D, McCaul K, Iacopetta B. CpG island methylator phenotype is an independent predictor of survival benefit from 5-fluorouracil in stage III colorectal cancer. Clin Cancer Res. 2003;9:2898–903. [PubMed] [Google Scholar]
- 34.Chan AT, Ogino S, Fuchs CS. Aspirin and the risk of colorectal cancer in relation to the expression of COX-2. N Engl J Med. 2007;356:2131–42. doi: 10.1056/NEJMoa067208. [DOI] [PubMed] [Google Scholar]
- 35.Ogino S, Kawasaki T, Kirkner GJ, Kraft P, Loda M, Fuchs CS. Evaluation of markers for CpG island methylator phenotype (CIMP) in colorectal cancer by a large population-based sample. J Mol Diagn. 2007;9:305–14. doi: 10.2353/jmoldx.2007.060170. [DOI] [PMC free article] [PubMed] [Google Scholar]
- 36.Nosho K, Kawasaki T, Ohnishi M, Suemoto Y, Kirkner GJ, Zepf D, Yan L, Longtine JA, Fuchs CS, Ogino S. PIK3CA mutation in colorectal cancer: relationship with genetic and epigenetic alterations. Neoplasia. 2008;10:534–41. doi: 10.1593/neo.08336. [DOI] [PMC free article] [PubMed] [Google Scholar]
- 37.Ogino S, Kawasaki T, Nosho K, Ohnishi M, Suemoto Y, Kirkner GJ, Fuchs CS. LINE-1 hypomethylation is inversely associated with microsatellite instability and CpG island methylator phenotype in colorectal cancer. Int J Cancer. 2008;122:2767–73. doi: 10.1002/ijc.23470. [DOI] [PMC free article] [PubMed] [Google Scholar]
- 38.Ogino S, Kawasaki T, Kirkner GJ, Ogawa A, Dorfman I, Loda M, Fuchs CS. Down-regulation of p21 (CDKN1A/CIP1) is inversely associated with microsatellite instability and CpG island methylator phenotype (CIMP) in colorectal cancer. J Pathol. 2006;210:147–54. doi: 10.1002/path.2030. [DOI] [PubMed] [Google Scholar]
- 39.Ogino S, Kawasaki T, Ogawa A, Kirkner GJ, Loda M, Fuchs CS. Cytoplasmic localization of p27 (cyclin-dependent kinase inhibitor 1B/KIP1) in colorectal cancer: inverse correlations with nuclear p27 loss, microsatellite instability, and CpG island methylator phenotype. Hum Pathol. 2007;38:585–92. doi: 10.1016/j.humpath.2006.09.014. [DOI] [PMC free article] [PubMed] [Google Scholar]
- 40.Nosho K, Kawasaki T, Chan AT, Ohnishi M, Suemoto Y, Kirkner GJ, Fuchs CS, Ogino S. Cyclin D1 is frequently overexpressed in microsatellite unstable colorectal cancer, independent of CpG island methylator phenotype. Histopathology. 2008;53:588–98. doi: 10.1111/j.1365-2559.2008.03161.x. [DOI] [PMC free article] [PubMed] [Google Scholar]
- 41.Kawasaki T, Nosho K, Ohnishi M, Suemoto Y, Kirkner GJ, Dehari R, Meyerhardt JA, Fuchs CS, Ogino S. Correlation of beta-catenin localization with cyclooxygenase-2 expression and CpG island methylator phenotype (CIMP) in colorectal cancer. Neoplasia. 2007;9:569–77. doi: 10.1593/neo.07334. [DOI] [PMC free article] [PubMed] [Google Scholar]
- 42.Ogino S, Brahmandam M, Kawasaki T, Kirkner GJ, Loda M, Fuchs CS. Combined analysis of COX-2 and p53 expressions reveals synergistic inverse correlations with microsatellite instability and CpG island methylator phenotype in colorectal cancer. Neoplasia. 2006;8:458–64. doi: 10.1593/neo.06247. [DOI] [PMC free article] [PubMed] [Google Scholar]
- 43.Ogino S, Kawasaki T, Ogawa A, Kirkner GJ, Loda M, Fuchs CS. Fatty acid synthase overexpression in colorectal cancer is associated with microsatellite instability, independent of CpG island methylator phenotype. Hum Pathol. 2007;38:842–9. doi: 10.1016/j.humpath.2006.11.018. [DOI] [PubMed] [Google Scholar]
- 44.Ogino S, Kawasaki T, Brahmandam M, Yan L, Cantor M, Namgyal C, Mino-Kenudson M, Lauwers GY, Loda M, Fuchs CS. Sensitive sequencing method for KRAS mutation detection by Pyrosequencing. J Mol Diagn. 2005;7:413–21. doi: 10.1016/S1525-1578(10)60571-5. [DOI] [PMC free article] [PubMed] [Google Scholar]
- 45.Ogino S, Kawasaki T, Kirkner GJ, Loda M, Fuchs CS. CpG island methylator phenotype-low (CIMP-low) in colorectal cancer: possible associations with male sex and KRAS mutations. J Mol Diagn. 2006;8:582–8. doi: 10.2353/jmoldx.2006.060082. [DOI] [PMC free article] [PubMed] [Google Scholar]
- 46.Ogino S, Brahmandam M, Cantor M, Namgyal C, Kawasaki T, Kirkner G, Meyerhardt JA, Loda M, Fuchs CS. Distinct molecular features of colorectal carcinoma with signet ring cell component and colorectal carcinoma with mucinous component. Mod Pathol. 2006;19:59–68. doi: 10.1038/modpathol.3800482. [DOI] [PubMed] [Google Scholar]
- 47.Ogino S, Kawasaki T, Brahmandam M, Cantor M, Kirkner GJ, Spiegelman D, Makrigiorgos GM, Weisenberger DJ, Laird PW, Loda M, Fuchs CS. Precision and performance characteristics of bisulfite conversion and real-time PCR (MethyLight) for quantitative DNA methylation analysis. J Mol Diagn. 2006;8:209–17. doi: 10.2353/jmoldx.2006.050135. [DOI] [PMC free article] [PubMed] [Google Scholar]
- 48.Weisenberger DJ, Siegmund KD, Campan M, Young J, Long TI, Faasse MA, Kang GH, Widschwendter M, Weener D, Buchanan D, Koh H, Simms L, et al. CpG island methylator phenotype underlies sporadic microsatellite instability and is tightly associated with BRAF mutation in colorectal cancer. Nat Genet. 2006;38:787–93. doi: 10.1038/ng1834. [DOI] [PubMed] [Google Scholar]
- 49.Irahara N, Nosho K, Baba Y, Shima K, Lindeman NI, Hazra A, Schernhammer ES, Hunter DJ, Fuchs CS, Ogino S. Precision of Pyrosequencing Assay to Measure LINE-1 Methylation in Colon Cancer, Normal Colonic Mucosa, and Peripheral Blood Cells. J Mol Diagn. 2010;12:177–83. doi: 10.2353/jmoldx.2010.090106. [DOI] [PMC free article] [PubMed] [Google Scholar]
- 50.Wettergren Y, Odin E, Nilsson S, Carlsson G, Gustavsson B. p16INK4a gene promoter hypermethylation in mucosa as a prognostic factor for patients with colorectal cancer. Mol Med. 2008;14:412–21. doi: 10.2119/2007-00096.Wettergren. [DOI] [PMC free article] [PubMed] [Google Scholar]
- 51.Spain SL, Cazier JB, Houlston R, Carvajal-Carmona L, Tomlinson I. Colorectal cancer risk is not associated with increased levels of homozygosity in a population from the United Kingdom. Cancer Res. 2009;69:7422–9. doi: 10.1158/0008-5472.CAN-09-0659. [DOI] [PubMed] [Google Scholar]
- 52.Zlobec I, Bihl MP, Schwarb H, Terracciano L, Lugli A. Clinico-pathological and protein characterization of BRAF and K-RAS mutated colorectal cancer and implications for prognosis. Int J Cancer. 2009 doi: 10.1002/ijc.25042. in press (published online. [DOI] [PubMed] [Google Scholar]
- 53.Iacopetta B, Heyworth J, Girschik J, Grieu F, Clayforth C, Fritschi L. The MTHFR C677T and DeltaDNMT3B C-149T polymorphisms confer different risks for right- and left-sided colorectal cancer. Int J Cancer. 2009;125:84–90. doi: 10.1002/ijc.24324. [DOI] [PubMed] [Google Scholar]
- 54.Strater J, Herter I, Merkel G, Hinz U, Weitz J, Moller P. Expression and prognostic significance of APAF-1, caspase-8 and caspase-9 in stage II/III colon carcinoma: Caspase-8 and caspase-9 is associated with poor prognosis. Int J Cancer. 2009 doi: 10.1002/ijc.25111. in press (published online. [DOI] [PubMed] [Google Scholar]
- 55.Rojas A, Meherem S, Kim YH, Washington MK, Willis JE, Markowitz SD, Grady WM. The aberrant methylation of TSP1 suppresses TGF-beta1 activation in colorectal cancer. Int J Cancer. 2008;123:14–21. doi: 10.1002/ijc.23608. [DOI] [PMC free article] [PubMed] [Google Scholar]
- 56.Barault L, Veyrie N, Jooste V, Lecorre D, Chapusot C, Ferraz JM, Lievre A, Cortet M, Bouvier AM, Rat P, Roignot P, Faivre J, et al. Mutations in the RAS-MAPK, PI(3)K (phosphatidylinositol-3-OH kinase) signaling network correlate with poor survival in a population-based series of colon cancers. Int J Cancer. 2008;122:2255–9. doi: 10.1002/ijc.23388. [DOI] [PubMed] [Google Scholar]
- 57.Kets CM, van Krieken JH, van Erp PE, Feuth T, Jacobs YH, Brunner HG, Ligtenberg MJ, Hoogerbrugge N. Is early-onset microsatellite and chromosomally stable colorectal cancer a hallmark of a genetic susceptibility syndrome? Int J Cancer. 2008;122:796–801. doi: 10.1002/ijc.23121. [DOI] [PubMed] [Google Scholar]
- 58.Ogino S, Goel A. Molecular classification and correlates in colorectal cancer. J Mol Diagn. 2008;10:13–27. doi: 10.2353/jmoldx.2008.070082. [DOI] [PMC free article] [PubMed] [Google Scholar]
- 59.Ogino S, Nosho K, Kirkner GJ, Kawasaki T, Chan AT, Schernhammer ES, Giovannucci EL, Fuchs CS. A cohort study of tumoral LINE-1 hypomethylation and prognosis in colon cancer. J Natl Cancer Inst. 2008;100:1734–8. doi: 10.1093/jnci/djn359. [DOI] [PMC free article] [PubMed] [Google Scholar]
- 60.Roth AD, Tejpar S, Delorenzi M, Yan P, Fiocca R, Klingbiel D, Dietrich D, Biesmans B, Bodoky G, Barone C, Aranda E, Nordlinger B, et al. Prognostic role of KRAS and BRAF in stage II and III resected colon cancer: results of the translational study on the PETACC-3, EORTC 40993, SAKK 60-00 trial. J Clin Oncol. 28:466–74. doi: 10.1200/JCO.2009.23.3452. [DOI] [PubMed] [Google Scholar]
- 61.Popat S, Hubner R, Houlston RS. Systematic review of microsatellite instability and colorectal cancer prognosis. J Clin Oncol. 2005;23:609–18. doi: 10.1200/JCO.2005.01.086. [DOI] [PubMed] [Google Scholar]