Abstract
Dynamic contrast enhanced MRI (DCE-MRI) using gadolinium or manganese provides unique characterization of myocardium and its pathology. In the current study, an ECG-triggered saturation recovery Look-Locker (SRLL) method was developed and validated for fast cardiac T1 mapping in small animal models. By sampling the initial portion of the longitudinal magnetization recovery curve, high temporal resolution (~3 min) can be achieved at a high spatial resolution (195×390 µm2) in mouse heart without the aid of parallel imaging or EPI. Validation studies were performed both in vitro on a phantom and in vivo on C57BL/6 mice (n=6). Our results showed a strong agreement between T1 measured by SRLL and by the standard saturation recovery method in vitro or inversion recovery Look-Locker in vivo. The utility of SRLL in DEC-MRI studies was demonstrated in manganese-enhanced MRI experiments in mice. Our results suggest that SRLL can provide rapid and accurate cardiac T1 mapping for studies utilizing small animal models.
Keywords: T1 mapping, heart, dynamic contrast enhanced MRI, contrast agent
INTRODUCTION
Dynamic contrast enhanced MRI (DCE-MRI) plays an increasingly important role in cardiac imaging. The dynamics of contrast agent uptake and distribution have shown high sensitivity and specificity to many pathological changes that are not detectable by anatomical imaging (1, 2). Gadolinium and manganese (Mn2+) are the two most popular T1 shortening contrast agents that have been used in DCE-MRI studies for the evaluation of myocardial viability and perfusion (3, 4). Typically, T1-weighted spin-echo or gradient-echo images are acquired at high spatial and temporal resolution to track the dynamics of signal enhancement induced by contrast agent accumulation. However, the existence of B1 inhomogeneity hinders the direct quantification of contrast agent concentration from the T1-weighted images (5).
Previous research has shown a linear relationship between relaxation rate (R1) and contrast agent concentration in a relatively wide range (1, 6). Hence, quantification of contrast agent concentration can be achieved by measuring T1 changes directly (7, 8). However, the typical long data acquisition time for T1 mapping has limited its practical use in DCE-MRI studies that require high temporal resolution (9). Therefore, the development of a rapid T1 mapping method that enables quantification of the contrast agent distribution will greatly benefit the application of DCE-MRI.
Several fast T1 mapping methods have been proposed. A commonly used method acquires gradient-echo images with variable flip angles to fit for T1 (10, 11). Another similar approach uses the ratio image of a proton density-weighted image and a T1-weighted image to obtain the T1 map (12). However, these techniques are susceptible to errors associated with an imperfect B1 field (13). Although substantial effort has been devoted to correct for these errors (12, 14), these methods have found limited applications in the heart due to the cardiac motion and susceptibility difference between myocardium and blood. Alternatively, inversion recovery (IR), saturation recovery (SR), and Look-Locker methods track the dynamic recovery of longitudinal magnetization (Mz) for T1 mapping and are inherently more tolerant to B1 inhomogeneity. By sampling multiple time points along the recovery curve in each phase encoding step, the Look-Locker method is the most time efficient method for T1 mapping (15). With the aid of echo-planar (EPI)/segmented k-space imaging and/or parallel acquisition, T1 mapping can be achieved within 30 s (9, 16–18). Recent studies using a modified IR Look-Locker method with EPI scheme was able to acquire T1 maps of human hearts at a high spatial resolution (2×2 mm) within one breathhold (19, 20). However, the fast heart rate in small animals renders the implementation of EPI problematic. As a result, dynamic T1 acquisition in small animal hearts remains a challenge (6).
In this study, we present a saturation recovery Look-Locker (SRLL) method that allows rapid T1 mapping of mouse myocardium within 3 minutes. In contrast to the long repetition time required by the IRLL method, a shorter repetition time (TR) was used in SRLL to reduce imaging time. Simulation studies were employed for error analysis and parameter optimization. Validation was performed on both phantom and mouse hearts in vivo. The utility of SRLL was demonstrated in an in vivo manganese-enhanced MRI (MEMRI) study using a mouse model. Our results suggest that SRLL can provide fast, accurate cardiac T1 mapping for DCE-MRI studies in small animals.
METHODS
Imaging method and T1 mapping
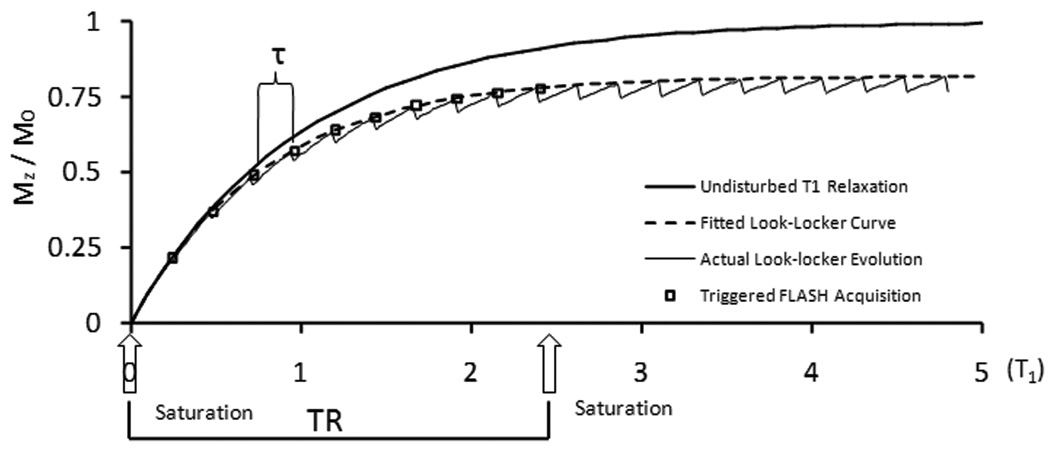
A schematic diagram of the SRLL pulse sequence is shown in Fig. 1. An ECG-triggered saturation module that consisted of three non-slice-selective 90° RF pulses was applied at the beginning of each phase encoding step, followed by ECG-triggered acquisition of k-space lines of N (N=9~11) images using FLASH. This acquisition scheme yielded a TR of ~2.4 s for each phase-encoding step, which rendered a ~85% recovery of the longitudinal magnetization for a typical myocardium T1 value (~1.2 s) before contrast agent injection (6, 21).
Figure 1.
SRLL pulse sequence. An ECG-triggered saturation module is followed by N successive ECG-triggered FLASH acquisitions.
The signal evolution in Look-Locker acquisition has been derived in previous studies (9, 22). The recovery of the longitudinal magnetization before each excitation pulse can be described by an exponential function,
| [1] |
where M(0) is the initial longitudinal magnetization immediately after the saturation pulses and is approximately zero. T1* is the effective longitudinal relaxation time constant and is related to T1, flip angle α and the interval τ by
| [2] |
M* is the effective equilibrium longitudinal magnetization and is related to the equilibrium longitudinal magnetization M0 by
| [3] |
The first-order Taylor expansion of exp(−τ/T1) and leads to the following relationship between T1, T1*, M* and M0 (18).
| [4] |
In the current study, M0 was obtained by acquiring a gradient-echo image with a TR at least 5 times of T1. Since M0 is an intrinsic tissue characteristic that does not vary with contrast agent accumulation, a single measurement at baseline is sufficient for the entire DCE-MRI study. From Eq. 1, T1*, M*, and M(0) can be obtained by a three-parameter fitting to the measured signal M(n). Consequently, Eq. 4 allows the determination of T1.
Error analysis and parameter optimization
While a short TR is desirable for fast T1 mapping, insufficient coverage of the recovery curve leads to increased fitting errors (17). To evaluate the impact of reduced TR on T1 estimation, simulation studies were performed on three different TR values (1.2, 2.4 and 6 s). A set of recovery curves with T1 ranging from 0.2 s to 1.7 s was generated according to Eqs. 1–3, with a flip angle of 10° and a τ of 120 ms (comparable to the R-R interval in a mouse heart). A 5% random noise, similar to the signal-to-noise ratio (SNR) in vivo, was added to the data. T1* and M* were determined by fitting Eq. 1 to the partial recovery data within 1.2 s, 2.4 s and 6 s. This process was performed 25 times for each curve. Consequently, T1 was determined from Eq. 4. The differences between the theoretical T1 values and the estimated T1 values were analyzed using Bland-Altman method.
Further simulation studies were performed to evaluate the effects of the duration of τ on T1 estimation. For a fixed TR value of 2.4 s, another data set was generated with τ = 240 ms (comparable to 2 R-R intervals in a mouse heart) and used to derive T1 as described above. The results were analyzed and compared to the above estimation with τ = 120 ms.
The effects of heart rate fluctuation on the accuracy of T1 estimation were also evaluated. Simulated recovery curves that reflected varied data sampling intervals were generated. Specifically, the signal intensity at the nth data point was calculated using a time value that deviated randomly from the theoretical value of nτ by 5%, 10%, and 15%, respectively. A 5% random noise was also added to the simulated data. Curve fitting and comparison analysis were conducted as described above.
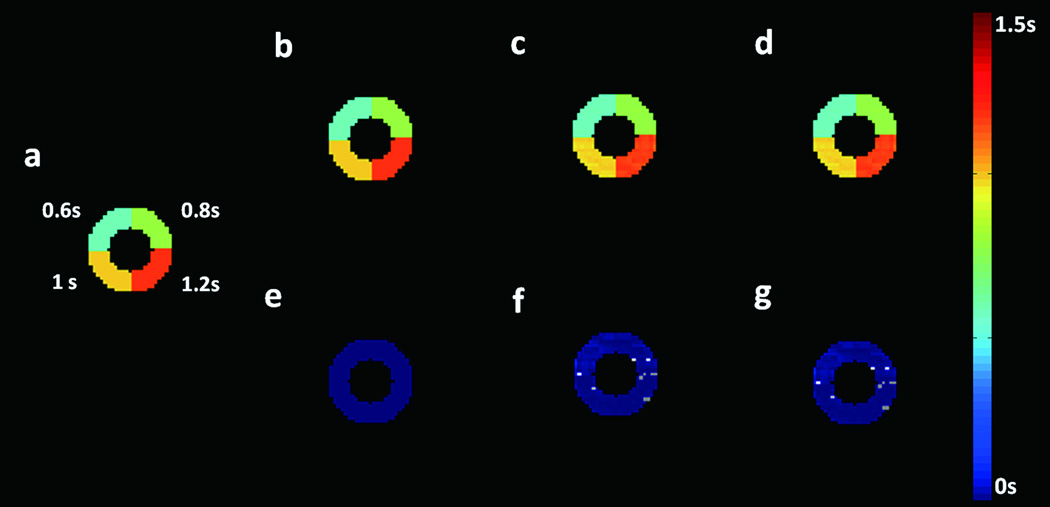
To further evaluate the accuracy of T1 estimation at the presence of beat-to-beat variation, a simulation model was developed using a donut-shaped digital phantom. The phantom has four segments with T1 values of 1, 1.2, 1.4, and 1.2 s, respectively (Fig. 4a). A random rotation of 0.2° was applied to the phantom image to simulate the variation in twist motion of the heart. Variation in myocardial displacement was simulated by applying a random 25 µm translation. To generate the saturation recovery images, each k-space line was simulated sequentially with rotation or displacement applied randomly to the digital phantom. The composite k-space images were Fourier transformed, and pixel-by-pixel curve fitting was performed to determine the T1 values. The theoretical T1 maps were subtracted from the estimated T1 maps to evaluate the estimation errors.
Figure 4.
Simulation of the estimation errors caused by beat-to-beat variations in rotational and translational motion. a. Digital phantom with four segments of different, representative T1 values. b–d. Estimated T1 maps with random translational motion (b), rotational motion (c), and both rotational and translational motion (d) incorporated, respectively. e–g. Difference maps between theoretical and fitted T1 maps (b–d), respectively.
Phantom studies
A multi-compartment phantom that consisted of distilled water dissolved with MnCl2 at various concentrations ranging from 30 to 1000 µM was used for validation studies (Fig. 4A). The MR imaging experiments were performed on a horizontal 9.4T Bruker Biospec scanner (Bruker Biospin Co. Billerica, MA) equipped with a 35-mm birdcage coil. To evaluate the effect of flip angle on T1 estimation, SRLL experiments were performed with a series of flip angles ranging from 6° to 18°. Other imaging parameters were: TR, 2.5 s; TE, 1.9 ms; number of averages, 1; number of FLASH acquisitions, 10; τ, 245 ms; slice thickness, 1 mm; field of view (FOV), 3×3 cm2; matrix size, 128×64. Images were zero-filled to 128×128 during reconstruction. M0 was measured with a long TR of 10 s. Standard spin-echo saturation recovery (SR) experiments were also performed for data comparison and validation (23). Various TR values (50, 90, 140, 200, 500, 800, 1100, 1700, 2400, 3350, 5000, 12500 ms) were used to sample the data on the entire longitudinal recovery curve. Image acquisition time was 3 min and 85 min for SRLL and SR methods, respectively.
In vivo studies
Four-month-old C57BL/6 mice (n=6) were used to validate the current method for in vivo manganese-enhanced MRI (MEMRI) studies. The animals were prepared as described previously (24). Briefly, animals were anesthetized with 1% isoflurane and placed in prone position. Heart rate was maintained at ~500 bpm with 0.8–1.8% isoflurane. Hot air was blown to the mouse with a blow dryer to keep body temperature at around 34°C. ECG, respiration, and body temperature were monitored and recorded by a physiological monitoring system (SA Instruments, Billerica, MA). MR images were acquired using the same coil as the phantom studies. The Mn2+ infusion protocol consisted of a 30-min intraperitoneal infusion of 126 mM MnCl2 solution at a rate of 0.2 ml/hr, followed by a 15-mins wash-out period. The animal protocol was approved by the Institutional Animal Care and Use Committee of the Case Western Reserve University.
The myocardium T1 changes during the Mn2+ infusion protocol were tracked by ECG-triggered SRLL method with the following imaging parameters: TE, 1.9 ms; flip angle, 10°; slice thickness, 1 mm; number of averages, 1; FOV, 2.5×2.5 cm2; matrix size, 128×64. Images were zero-filled to 128×128 during reconstruction. The FLASH acquisitions were triggered every two heart beat, equivalent to a τ ranging from 200 to 270 ms. Based on the heart rate during each experiment, 9 to 11 images were acquired, leading to a TR of ~2.5 s. For data validation, inversion recovery Look-Locker (IRLL) method was also applied before Mn2+ infusion and at the end of wash-out period (6). A 1 ms hyperbolic sech-shaped adiabatic pulse was employed to provide the 180° inversion. For each phase encoding step, 35 data points (TR ≈ 8 s) were acquired to cover the entire longitudinal recovery curve. Other imaging parameters were the same as those for SRLL scans. Total imaging time was 3 and 9 minutes for SRLL and IRLL, respectively.
Statistic analysis
All results were expressed as mean ± SD. Paired student’s t-test and Bland-Altman (25) analysis were performed to compare T1 values measured by SRLL to those measured by standard SR method for in vitro studies or IRLL for in vivo studies, respectively. P<0.05 was considered statistical significant.
RESULTS
Simulation and error analysis
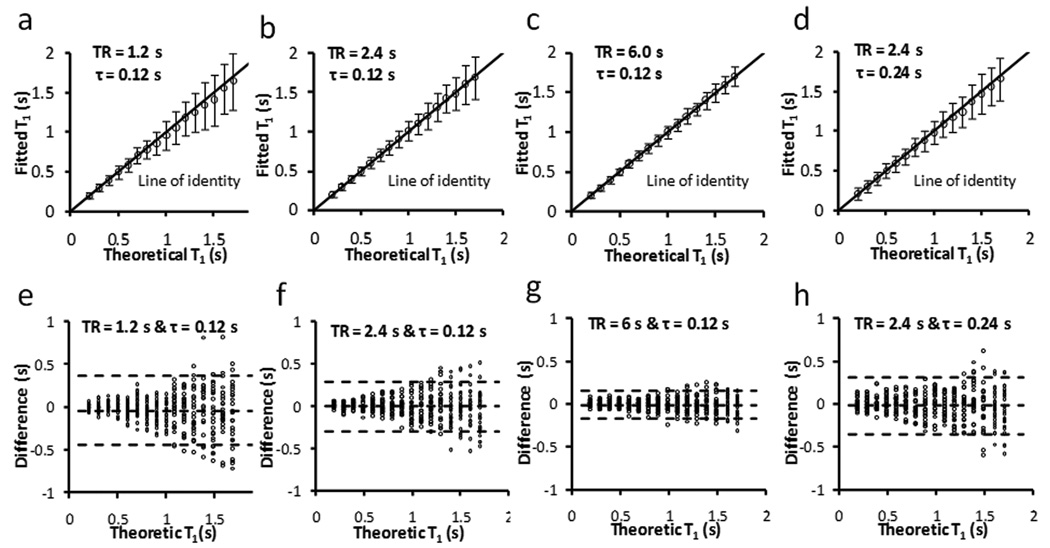
Figure 2 shows the effects of incomplete coverage of the recovery curve on the accuracy of T1 estimation. For all 3 choices of TR, the estimated T1 values exhibited a strong agreement with the theoretical value. Linear regression analysis showed a slope of 0.95, 0.99 and 1 for TR equals 1.2 s, 2.4 s and 6 s, respectively (R2 = 0.99) (Fig. 2a–c). SD for all T1 values was <12% with a moderate (2.4 s) or long (6 s) TR (Fig. 2f & 2g). However, due to limited coverage of the recovery curve with a short TR (1.2 s), estimated T1 values showed large variations (SD>20%) for T1 longer than 1.1 s (Fig. 2e). These results suggested that 2.4 s TR can provide sufficient coverage of the magnetization recovery for accurate estimation of T1 changes in DCE-MRI experiments. Therefore, a TR of 2.4 s was used in all subsequent studies.
Figure 2.
Simulation of the effect of TR on T1 estimation. a–d. Fitted T1 versus theoretical T1. The error bar is the standard deviation from 25 simulations. e–h. Bland-Altman plots of the difference between fitted T1 and theoretical T1. The middle dotted line is the mean of the difference. The upper and bottom dotted lines are the mean plus and minus two times of the standard deviation, respectively.
The rapid switching of imaging gradients during data acquisition interfered with the ECG signal, rendering ECG triggering less reliable. Alternatively, triggering on every two heart beats enabled unambiguous detection of the QRS complex. However, it also led to doubled sampling interval and less data points for curve fitting. To evaluate the accuracy of doubling sampling interval, T1 was estimated using a TR of 2.4 s and a τ of 240 ms that is comparable to two R-R intervals in mice (Fig. 2d&h). Compared with the T1 estimated with a τ of 120 ms (Fig. 2b&f), similar accuracy and SD were observed. Therefore, a two-beat triggering scheme was used in the in vivo studies to ensure consistent data sampling intervals.
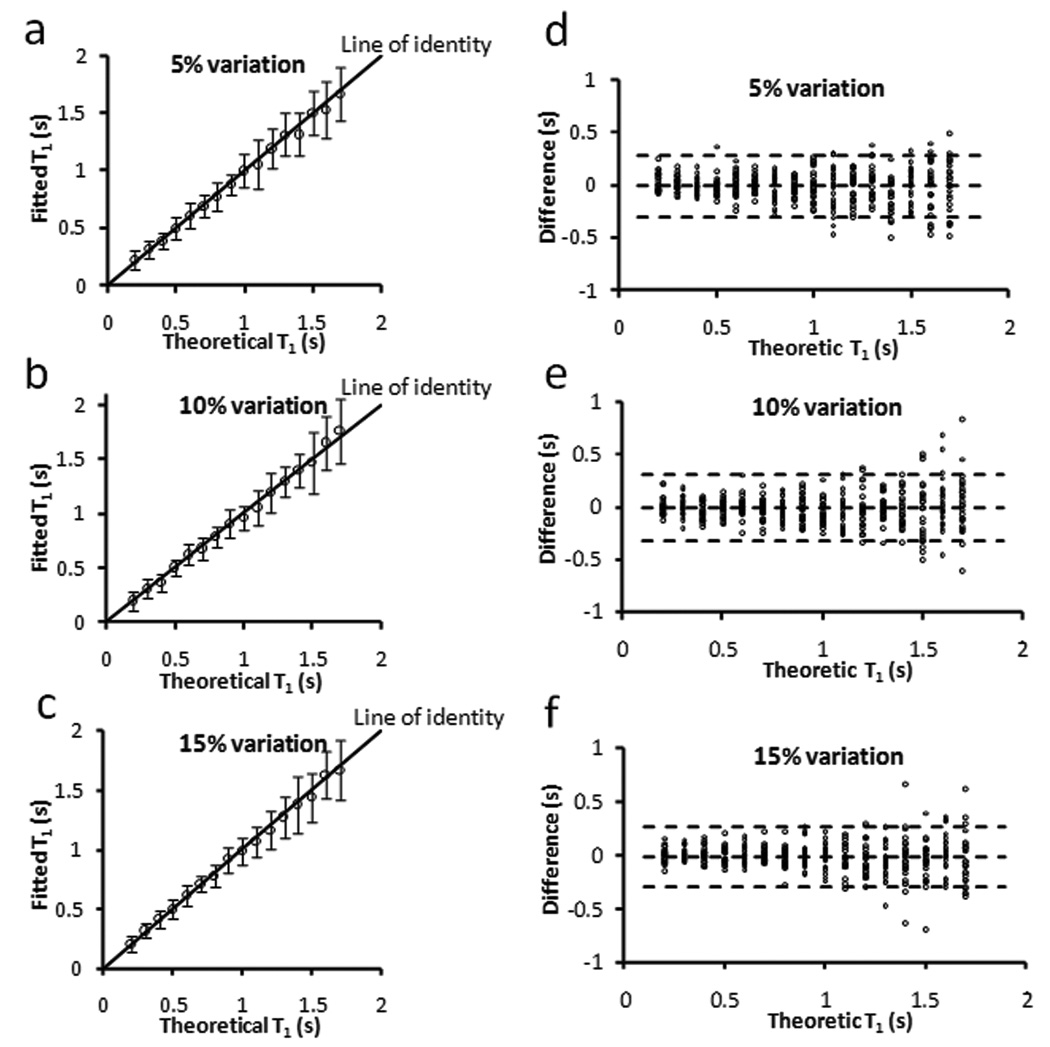
The robustness of SRLL method to heart rate fluctuation is shown in Fig. 3. For heart rate variation of up to 15%, there was a strong agreement between the estimated and theoretical T1 values (Fig. 3a–c). Bland-Altman analysis further showed a less than 5% (P > 0.1) deviation from the theoretic values for all three conditions (Fig. 3d–f). Since heart rate fluctuation is normally within 10% during the acquisition of a T1 map (< 3 min), these data suggested that SRLL was capable of providing reliable T1 estimation for most in vivo studies.
Figure 3.
Simulation of the effect of τ fluctuation on T1 estimation with TR = 2.4 s and τ = 0.24 s. a–c. Fitted T1 versus theoretical T1. The error bar is the standard deviation from 25 simulation runs. d–f. Bland-Altman plots of the difference between fitted T1 and theoretical T1. The middle dotted line is the mean of the difference. The upper and bottom dotted lines are the mean plus and minus two times of the standard deviation, respectively.
Estimation errors associated with beat-to-beat variations in translational and rotational motion are illustrated in Fig. 4. Displacement of up to 25 µm showed minimal effects on T1 estimation (Fig. 4b&e). Errors due to random rotation (0.2°) were slightly larger (~ 5%), with the largest errors occurred at the border zone of 0.8 s and 1.2 s segments (Fig. 4c&f). With both rotational and translational motion present, estimation error further increased to 6% (Fig. 4d&g). Part of the estimation errors can also arise from a non-physiologic phantom with sharp changes in T1 values.
Phantom study
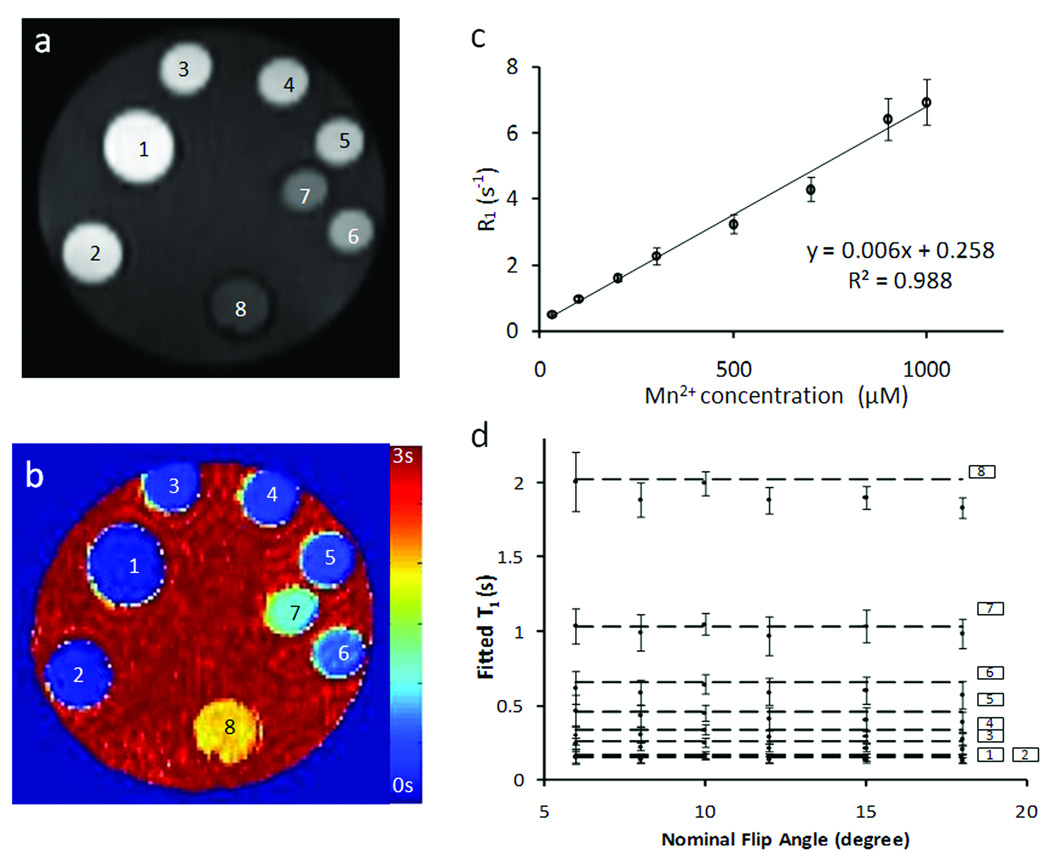
The T1-weighted image and the T1 map of the phantom are shown in Fig. 5. Regression analysis showed a linear relationship (R2 = 0.99) between R1 and Mn2+ concentration of up to 1000 µM, with a slope (relaxivity) of 6.4 (s mM)−1. To investigate the effect of flip angle on T1 estimation, SRLL measurement was performed with flip angles ranging from 6° to 18° (Fig. 5d). For phantoms with 100 µM or higher Mn2+ concentration (T1 < 1.1 s), all flip angles yielded similar T1 estimation compared with those measured by the standard SR method (Fig. 5d, horizontal dashed lines). SRLL estimated T1 showed greater deviation from that measured by SR for 30 µM Mn2+ solution with a T1 of 2 s. The largest deviation (9.6 %) occurred when flip angle was 18°. While a larger flip angle provided better SNR, it also led to greater estimation error. A flip angle of 10° provided the best tradeoff between SNR and T1* contrast, leading to accurate T1 estimation with small SD. Therefore, it was chosen for the in vivo experiments.
Figure 5.
Phantom study. a&b. T1-weighted image and T1 map of the phantom tubes, respectively. Phantoms 1 to 8 contained MnCl2 solutions with the following concentrations (in mM): 1000, 900, 700, 500, 300, 200, 100, and 30. c. Longitudinal relaxation rate constant (R1) versus Mn2+ concentration. d. T1 values measured with different flip angles. The horizontal lines are the T1 values measured by the standard SR method.
In vivo study
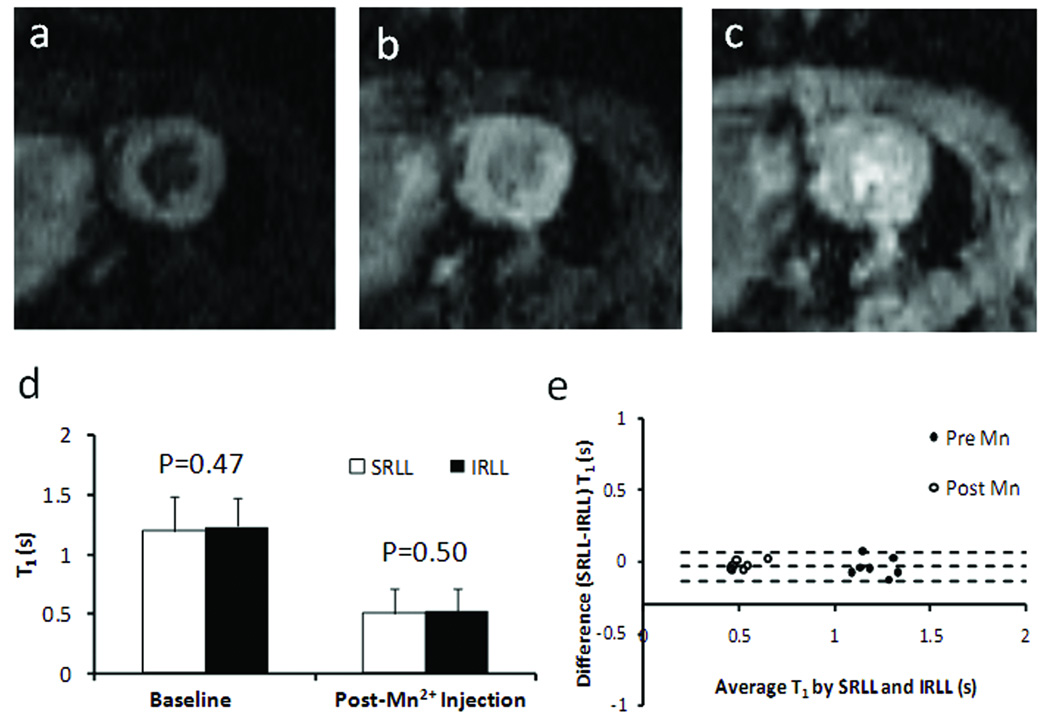
Fig. 6a–c shows representative FLASH images acquired at 2τ, 4τ, and 10τ after the saturation module. The progressive increase in myocardial signal intensity reflected the recovery of longitudinal magnetization and was used to derive the T1 maps. A quantitative comparison of the T1 maps showed no difference in T1 estimation between SRLL and IRLL methods both before and after MnCl2 injection (Fig. 6d–e).
Figure 6.
In vivo T1 mapping. a–c. T1-weighted images acquired at 2τ, 4τ, and 10τ after the saturation pulses, respectively. d. Mean T1 values of the LV myocardium measured by SRLL and standard inversion recovery Look-Locker (IRLL) method before and after Mn2+ injection. e. Bland-Altman plot comparing T1 values measured by SRLL method and IRLL method.
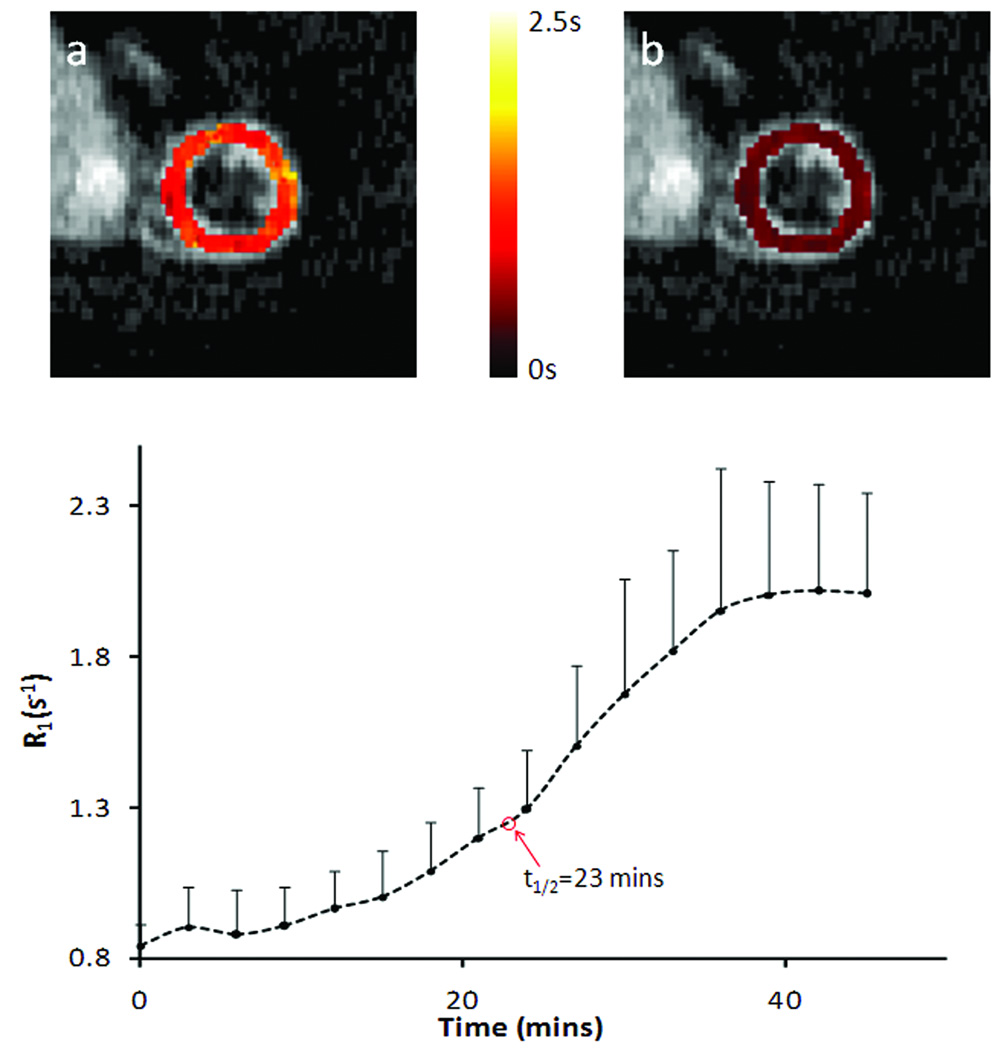
Representative T1 maps before and after Mn2+ infusion and the dynamics of R1 changes are shown in Fig. 6. Compared with the T1 maps at baseline (Fig. 7a), T1 reduction over the whole LV area was observed at the end of 30-mins Mn2+ infusion (Fig. 7b). Correspondingly, R1 increased from the baseline value of 0.84 ± 0.07 s−1 to 2.01 ± 0.33 s−1, with the half maximum R1 reached at 23 min after Mn2+ infusion started (Fig. 7c).
Figure 7.
R1 changes in dynamic MEMRI study. a&b. Representative T1 maps of a heart pre- and post- MnCl2 injection, respectively. c. Time course of R1 changes tracked by SRLL at a temporal resolution of 3 min.
DISCUSSION
Previously, inversion recovery Look-Locker method has been developed for fast T1 mapping in vivo (9). Accurate T1 mapping using inversion recovery can only be achieved with either complete recovery of the longitudinal magnetization via a long TR (>5T1), or by establishing a steady-state such that the longitudinal magnetization immediately before the inversion pulse is the same for each phase-encoding step. While acquisition with long TR suffers from low temporal resolution, the requirements of cardiac triggered acquisition and variations in heart rate prevent the establishment of a steady-state in a mouse heart. By using robust saturation pulses, our current method is equivalent to establishing an initial “steady-state” longitudinal magnetization of zero. This approach can effectively eliminate heart rate induced variations in initial magnetization. By sampling only the initial portion of the recovery curve, the SRLL method can greatly improve the temporal resolution for DCE-MRI studies.
Both SNR and the dynamic range of the signal can affect the accuracy of T1 estimation (23). While a shorter TR is desirable for higher temporal resolution, the dynamic range of the signal is reduced with shortened coverage of the recovery curve. Karlsson et al suggested that a TR of >2T1 was needed for accurate T1 estimation (22). Our error analysis showed similar findings. With a SNR (=20) that was lower than the experimental in vivo SNR (~26), our simulation results suggested that a TR of 2.4 s was sufficient to yield accurate estimations for a wide range of T1 values (0.2~1.7 s) that encompassed possible myocardium T1 changes in DCE-MRI experiments for magnetic field strength up to 11.7 T (26). In the current study, image acquisition was triggered every two heart beats to avoid mis-triggering caused by the interference of switching gradients with the ECG signal. Such an acquisition scheme leads to reduced data points that can be acquired within the same period of time if acquisitions were triggered at every heart beat. However, our simulation results suggest that both acquisition schemes should yield similar accuracy in T1 estimation (Fig. 2b&d). Further, triggering every two heart beats has the additional benefit of less energy deposition.
In the current study, effective longitudinal relaxation time constant (T1*) and equilibrium magnetization (M*) were determined by fitting Eq. [1] to MRI data. Theoretically, T1* is related to T1, the flip angle, and the sampling interval as shown in Eq. [2], which allows the calculation of T1 from T1*. However, actual flip angle often deviates from its nominal value because of the B1 inhomogeneity (14). Although various methods for B1 mapping have been proposed (27, 28), their application to the fast beating mouse hearts are still problematic. Alternatively, T1 can be calculated directly from T1*, M*, and M0 using Eq. [4], which is derived from the first-order Taylor expansion of exp(−τ/T1) and . It should be noted that this approach introduced a 0.3~0.7% underestimation of the T1 values with the current imaging parameters. This systematic underestimation was more pronounced with larger flip angles (Fig. 5d). Although a larger flip angle has the potential benefit of increased SNR, this underestimation can increase from 0.7% to 7% if a 30° flip angle is used instead of 10°. In addition, larger flip angles also reduce T1*-associated imaging contrast, leading to reduced dynamic range for curve fitting (29). Our phantom results showed that T1 estimation was accurate for nominal flip angles ranging from 6° to 15° for a T1< 2 s. This estimation is comparable to that reported in previous studies (18, 30, 31).
The validity of the current method was demonstrated by a strong agreement with the measurement using standard magnetization recovery methods in both phantom and in vivo studies. The baseline myocardium T1 value was also similar to that reported in the literature (26, 32). The measured time course of R1 changes exhibited a similar dynamics as compared to previous cardiac MEMRI studies employing T1-weighted methods (33, 34). According to the study by Waghorn and colleagues (6), the observed R1 changes in our current study indicated that total Mn2+ uptake at the end of MnCl2 infusion protocol was around 24 µg/g dry wt. The constant R1 level during the wash-out period was supported by previous findings that intracellular Mn2+ retention may last for hours (1, 6).
In summary, a fast cardiac T1 mapping method using saturation recovery Look-Locker pulse sequence (SRLL) was developed and validated for studies employing small animal models. Each T1 map can be acquired within 3 min without the aid of parallel imaging or segmentation/EPI techniques. The robustness and accuracy of this method were validated in both phantom and in vivo experiments. The successful demonstration in the MEMRI experiment shows the potential of the SRLL method for practical applications.
ACKNOWLEDGEMENTS
This study was supported by NIH Grants HL73315 and HL86935 (Yu). The authors would like to thank Ya Chen for help with the experimental set up. The authors acknowledge the support of Case Center for Imaging Research funded, in part, through National Cancer Institute Small Animal Imaging Research Program Grant U24 CA110943.
Abbreviation used
- DCE
Dynamic contrast-enhanced
- EPI
Echo planar imaging
- FLASH
Fast low angle shot
- IRLL
Inversion recovery Look-Locker
- LV
Left ventricle
- Mz
Longitudinal magnetization
- MEMRI
Manganese-enhanced MRI
- SNR
Signal-to-noise ratio
- SR
Saturation recovery
- SRLL
Saturation recovery Look-Locker
- SD
Standard deviation
REFERENCES
- 1.Strijkers GJ, Mulder WJ, van Tilborg GA, Nicolay K. MRI contrast agents: current status and future perspectives. Anticancer Agents Med.Chem. 2007;7:291–305. doi: 10.2174/187152007780618135. [DOI] [PubMed] [Google Scholar]
- 2.Edelman RR. Contrast-enhanced MR imaging of the heart: overview of the literature. Radiology. 2004;232:653–668. doi: 10.1148/radiol.2323031558. [DOI] [PubMed] [Google Scholar]
- 3.Saeed M, Wendland MF, Watzinger N, Akbari H, Higgins CB. MR contrast media for myocardial viability, microvascular integrity and perfusion. Eur.J.Radiol. 2000;34:179–195. doi: 10.1016/s0720-048x(00)00198-4. [DOI] [PubMed] [Google Scholar]
- 4.Wagner A, Mahrholdt H, Sechtem U, Kim RJ, Judd RM. MR imaging of myocardial perfusion and viability. Magn Reson.Imaging Clin.N.Am. 2003;11:49–66. doi: 10.1016/s1064-9689(02)00048-x. [DOI] [PubMed] [Google Scholar]
- 5.Cron GO, Santyr G, Kelcz F. Accurate and rapid quantitative dynamic contrast-enhanced breast MR imaging using spoiled gradient-recalled echoes and bookend T(1) measurements. Magn Reson.Med. 1999;42:746–753. doi: 10.1002/(sici)1522-2594(199910)42:4<746::aid-mrm17>3.0.co;2-u. [DOI] [PubMed] [Google Scholar]
- 6.Waghorn B, Edwards T, Yang Y, Chuang KH, Yanasak N, Hu TC. Monitoring dynamic alterations in calcium homeostasis by T (1)-weighted and T (1)-mapping cardiac manganese-enhanced MRI in a murine myocardial infarction model. NMR Biomed. 2008;21:1102–1111. doi: 10.1002/nbm.1287. [DOI] [PubMed] [Google Scholar]
- 7.Koenig SH, Kellar KE. Theory of proton relaxation in solutions of magnetic nanoparticles, including the superparamagnetic size range. Acad.Radiol. 1996;3 Suppl 2:S273–S276. doi: 10.1016/s1076-6332(96)80555-1. [DOI] [PubMed] [Google Scholar]
- 8.Strich G, Hagan PL, Gerber KH, Slutsky RA. Tissue distribution and magnetic resonance spin lattice relaxation effects of gadolinium-DTPA. Radiology. 1985;154:723–726. doi: 10.1148/radiology.154.3.3969477. [DOI] [PubMed] [Google Scholar]
- 9.Chuang KH, Koretsky A. Improved neuronal tract tracing using manganese enhanced magnetic resonance imaging with fast T(1) mapping. Magn Reson.Med. 2006;55:604–611. doi: 10.1002/mrm.20797. [DOI] [PubMed] [Google Scholar]
- 10.Brookes JA, Redpath TW, Gilbert FJ, Murray AD, Staff RT. Accuracy of T1 measurement in dynamic contrast-enhanced breast MRI using two- and three-dimensional variable flip angle fast low-angle shot. J.Magn Reson.Imaging. 1999;9:163–171. doi: 10.1002/(sici)1522-2586(199902)9:2<163::aid-jmri3>3.0.co;2-l. [DOI] [PubMed] [Google Scholar]
- 11.Harrer JU, Parker GJ, Haroon HA, Buckley DL, Embelton K, Roberts C, Baleriaux D, Jackson A. Comparative study of methods for determining vascular permeability and blood volume in human gliomas. J.Magn Reson.Imaging. 2004;20:748–757. doi: 10.1002/jmri.20182. [DOI] [PubMed] [Google Scholar]
- 12.Parker GJ, Barker GJ, Tofts PS. Accurate multislice gradient echo T(1) measurement in the presence of non-ideal RF pulse shape and RF field nonuniformity. Magn Reson.Med. 2001;45:838–845. doi: 10.1002/mrm.1112. [DOI] [PubMed] [Google Scholar]
- 13.Young IR, Bryant DJ, Payne JA. Variations in slice shape and absorption as artifacts in the determination of tissue parameters in NMR imaging. Magn Reson.Med. 1985;2:355–389. doi: 10.1002/mrm.1910020406. [DOI] [PubMed] [Google Scholar]
- 14.Wang J, Qiu M, Kim H, Constable RT. T1 measurements incorporating flip angle calibration and correction in vivo. J.Magn Reson. 2006;182:283–292. doi: 10.1016/j.jmr.2006.07.005. [DOI] [PubMed] [Google Scholar]
- 15.Crawley AP, Henkelman RM. A comparison of one-shot and recovery methods in T1 imaging. Magn Reson.Med. 1988;7:23–34. doi: 10.1002/mrm.1910070104. [DOI] [PubMed] [Google Scholar]
- 16.Deichmann R, Hahn D, Haase A. Fast T1 mapping on a whole-body scanner. Magn Reson.Med. 1999;42:206–209. doi: 10.1002/(sici)1522-2594(199907)42:1<206::aid-mrm28>3.0.co;2-q. [DOI] [PubMed] [Google Scholar]
- 17.Jakob PM, Hillenbrand CM, Wang T, Schultz G, Hahn D, Haase A. Rapid quantitative lung (1)H T(1) mapping. J.Magn Reson.Imaging. 2001;14:795–799. doi: 10.1002/jmri.10024. [DOI] [PubMed] [Google Scholar]
- 18.Steinhoff S, Zaitsev M, Zilles K, Shah NJ. Fast T(1) mapping with volume coverage. Magn Reson.Med. 2001;46:131–140. doi: 10.1002/mrm.1168. [DOI] [PubMed] [Google Scholar]
- 19.Messroghli DR, Radjenovic A, Kozerke S, Higgins DM, Sivananthan MU, Ridgway JP. Modified Look-Locker inversion recovery (MOLLI) for high-resolution T1 mapping of the heart. Magn Reson.Med. 2004;52:141–146. doi: 10.1002/mrm.20110. [DOI] [PubMed] [Google Scholar]
- 20.Messroghli DR, Walters K, Plein S, Sparrow P, Friedrich MG, Ridgway JP, Sivananthan MU. Myocardial T1 mapping: application to patients with acute and chronic myocardial infarction. Magn Reson.Med. 2007;58:34–40. doi: 10.1002/mrm.21272. [DOI] [PubMed] [Google Scholar]
- 21.Skjold A, Kristoffersen A, Vangberg TR, Haraldseth O, Jynge P, Larsson HB. An apparent unidirectional influx constant for manganese as a measure of myocardial calcium channel activity. J.Magn Reson.Imaging. 2006;24:1047–1055. doi: 10.1002/jmri.20736. [DOI] [PubMed] [Google Scholar]
- 22.Karlsson M, Nordell B. Phantom and in vivo study of the Look-Locher T1 mapping method. Magn Reson.Imaging. 1999;17:1481–1488. doi: 10.1016/s0730-725x(99)00078-8. [DOI] [PubMed] [Google Scholar]
- 23.Haacke EM BRTMVR. Magnetic Resonance Imaging: Physical Principles and Sequence Design. New York: Wiley; 1999. [Google Scholar]
- 24.Zhong J, Liu W, Yu X. Transmural myocardial strain in mouse: quantification of high-resolution MR tagging using harmonic phase (HARP) analysis. Magn Reson.Med. 2009;61:1368–1373. doi: 10.1002/mrm.21942. [DOI] [PMC free article] [PubMed] [Google Scholar]
- 25.Bland JM, Altman DG. Statistical methods for assessing agreement between two methods of clinical measurement. Lancet. 1986 Feb 8;1:307–310. [PubMed] [Google Scholar]
- 26.Schneider JE, Cassidy PJ, Lygate C, Tyler DJ, Wiesmann F, Grieve SM, Hulbert K, Clarke K, Neubauer S. Fast, high-resolution in vivo cine magnetic resonance imaging in normal and failing mouse hearts on a vertical 11.7 T system. J.Magn Reson.Imaging. 2003;18:691–701. doi: 10.1002/jmri.10411. [DOI] [PubMed] [Google Scholar]
- 27.Dowell NG, Tofts PS. Fast, accurate, and precise mapping of the RF field in vivo using the 180 degrees signal null. Magn Reson.Med. 2007;58:622–630. doi: 10.1002/mrm.21368. [DOI] [PubMed] [Google Scholar]
- 28.Cunningham CH, Pauly JM, Nayak KS. Saturated double-angle method for rapid B1+ mapping. Magn Reson.Med. 2006;55:1326–1333. doi: 10.1002/mrm.20896. [DOI] [PubMed] [Google Scholar]
- 29.Deichmann R, Haase A. Quantification of T1 Values by SNAPSHOT-FLASH NMR imaging. Journal of Magnetic Resonance. 1992 Jun 24;96:608–612. [Google Scholar]
- 30.Deichmann R. Fast high-resolution T1 mapping of the human brain. Magn Reson.Med. 2005;54:20–27. doi: 10.1002/mrm.20552. [DOI] [PubMed] [Google Scholar]
- 31.Jivan A, Horsfield MA, Moody AR, Cherryman GR. Dynamic T1 measurement using snapshot-FLASH MRI. J.Magn Reson. 1997;127:65–72. doi: 10.1006/jmre.1997.1177. [DOI] [PubMed] [Google Scholar]
- 32.Waghorn B, Yang Y, Baba A, Matsuda T, Schumacher A, Yanasak N, Hu TC. Assessing manganese efflux using SEA0400 and cardiac T1-mapping manganese-enhanced MRI in a murine model. NMR Biomed. 2009;22:874–881. doi: 10.1002/nbm.1414. [DOI] [PubMed] [Google Scholar]
- 33.Hu TC, Pautler RG, MacGowan GA, Koretsky AP. Manganese-enhanced MRI of mouse heart during changes in inotropy. Magn Reson.Med. 2001;46:884–890. doi: 10.1002/mrm.1273. [DOI] [PubMed] [Google Scholar]
- 34.Hu TC, Christian TF, Aletras AH, Taylor JL, Koretsky AP, Arai AE. Manganese enhanced magnetic resonance imaging of normal and ischemic canine heart. Magn Reson.Med. 2005;54:196–200. doi: 10.1002/mrm.20516. [DOI] [PubMed] [Google Scholar]


