Abstract
In all manufacturing processes there are tolerances; however, orthodontic bracket manufacturers seldom state the slot dimensional tolerances. This experiment develops a novel method of analyzing slot profile dimensions using photographs of the slot. Five points are selected along each wall, and lines are fitted to define a trapezoidal slot shape. This investigation measures slot height at the slot's top and bottom, angles between walls, slot taper, and the linearity of each wall. Slot dimensions for 30 upper right central incisor self-ligating stainless steel brackets from three manufacturers were evaluated. Speed brackets have a slot height 2% smaller than the nominal 0.559 mm size and have a slightly convergent taper. In-Ovation brackets have a divergent taper at an average angle of 1.47 degrees. In-Ovation is closest to the nominal value of slot height at the slot base and has the smallest manufacturing tolerances. Damon Q brackets are the most rectangular in shape, with nearly 90-degree corners between the slot bottom and walls. Damon slot height is on average 3% oversized.
1. Introduction
Manufacturers rarely state orthodontic bracket slot dimension tolerances; however, in all manufacturing processes, variations exist. Different machining techniques can cause different irregularities. For example, injection molding will tend to have more rounded corners than precision grinding and machining techniques [1].
Orthodontic bracket slot profile variances have an impact on torque play and third-order torque expression [2, 3]. Typically the bracket slot height will be stated as a nominal height; previous studies have found variations between the nominally stated sizes and the measured sizes [4–9], with some brands being oversized up to 27% [10].
Measuring bracket slot dimensions is difficult; most brackets slots have rounded corners, and/or slot walls are not parallel leading to a trapezoidal slot shape. Recent studies have used a series of different devices to measure points using crosshairs. Each identifies the nonorthogonal irregularities in profile shape as the cause of the difficulty in lining the crosshair up in the desired location [5, 10]. Meling et al. [4] used torque play to measure slot height indirectly in an attempt to overcome the difficulties of measuring nonrectangular profiles. Cash et al. [10] measured bottom and top slot height and suggested that different bracket types have different slot shapes.
To date no previous study has attempted to directly define the slot profile to investigate manufacturing repeatability and tolerances using more than two-point slot height measurements. In addition, the slot profile has not previously been analyzed for modern self-ligating orthodontic brackets. This investigation aims to develop a novel method using several digitally selected points and a series of fitted lines to define a number of measurable slot profile parameters.
2. Methods and Materials
In this study three types of 0.022 in (0.559 mm) slot upper right central incisor stainless steel self-ligating brackets are investigated: Damon Q with 15° torque prescription (Ormco Corporation, Orange, CA, USA), In-Ovation-R with 12° torque prescription (GAC, Bohemia, NY, USA), and Speed with 12° torque prescription (Strite Industries, Cambridge, Ontario, Canada), all having a 0.559 mm nominal slot height. This investigation uses a sample size of 30 for each bracket type.
The mesial profiles of the brackets are photographed using a digital SLR (single-lens reflex) camera (Canon EOS-D10 10D, Tokyo, Japan) through a microscope (Carl Zeiss MicroImaging GmbH, Jena, Germany). Brackets were carefully aligned so that the slots were photographed perpendicularly to the slot. Alignment was confirmed by visually reviewing images to ensure that brackets were not tilted. Images collected through the microscope were scaled by 197.548 pixel/mm and the camera was set at a focal length of 4.4645 mm. The images are calibrated and processed using commercial software (DaVis 7.2, LaVision GmbH DaVis 7.2, Göttingen, Germany, 2007). Points were selected and exported for analysis in a spreadsheet (Microsoft Office Excel 2003, Microsoft Corporation, Redmond, WA, USA).
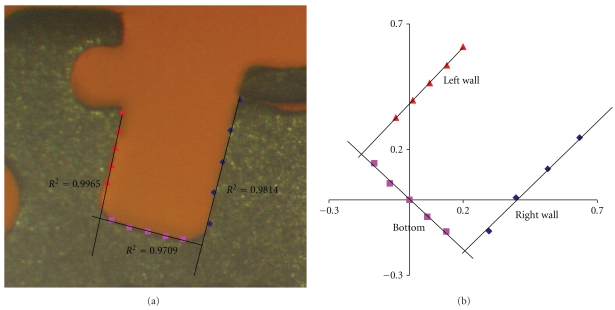
In each photo 15 points are selected, as seen in Figure 1(a). Five points are along the wall on the right-hand side wall, 5 points along the left-hand side (gingival) wall, and 5 points along the bottom. The points are all plotted on a 2-dimensional Cartesian (x,y) coordinate system as shown in Figure 1(b). Each corner has a radius, and the points are selected just outside the radius. Along each wall the two endpoints are selected first. The spreadsheet suggests approximately where the middle three points should be. For example, the right wall is mostly vertical. Therefore, using the y-coordinates from the two endpoints, the spreadsheet will give three more y-coordinates equally spaced between the endpoints. The user attempts to find the three middle points along the wall with y-coordinates that are within 0.01 mm of the suggested y-coordinate. This process ensures that all five points along a given wall are nearly equally distanced. The left wall uses the same process, and the bottom wall, since it is mostly in the horizontal direction, suggests x-coordinates.
Figure 1.
Slot profile 15 points selected for analysis of a Speed bracket. (a) The points overlaid on the slot photo, and (b) the points as graphed on a 2D Cartesian coordinate system.
In Excel a best fit line is generated for both slot walls and the bottom using linear regression. Since conventional linear regression is not accurate for near vertical lines with errors in the x-axis, the bottom line is rotated to set a slope of −1. This causes the slot wall lines to have slopes nearing 1, therefore allowing the linear regression to generate much more accurate best fit lines. Figure 1(b) shows the points plotted on in a 2-dimensional coordinate system and rotated to set the bottom line at a slope of −1. The three lines are defined as the left wall, the right wall, and the bottom.
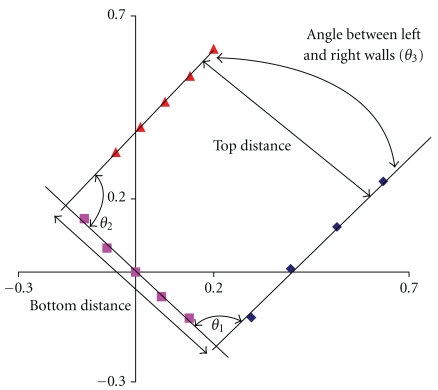
A total of five physical measurements are calculated from the trapezoidal profile and are shown in Figure 2. The slot top and bottom distances correspond to what is conventionally known as the slot height. The angle between the left and right walls measures the slot taper (θ3), and the other two angles provide a metric of the slot rectangularity (θ1 and θ2).
Figure 2.
Physical profile measurements.
The distance between any two 2-dimensional Cartesian points is given by
| (1) |
The bottom distance is calculated as the distance between the points generated by the intersection of the left wall and bottom lines, and the right wall and bottom lines. The top distance is calculated by first taking the y-coordinate of the highest plotted point on the left wall and determining the corresponding x-coordinate that lies on its fitted line. For sake of simplicity, we will call this point on the left wall line “Pt 1.” A line is generated through “Pt 1” with the same slope as the bottom line, and its intersection with the right line is calculated, which we will call “Pt 2.” The distance between “Pt 1” and “Pt 2” is the top distance. This approach is meant to give the slot height at the top of the slot. Knowing the slope of each fitted line, the slot angles are calculated using the following equations:
| (2) |
In addition to these five physical measurements, the R2 value is calculated for each regression line. This will give an indication of any severely nonlinear walls in the slot.
3. Results and Discussion
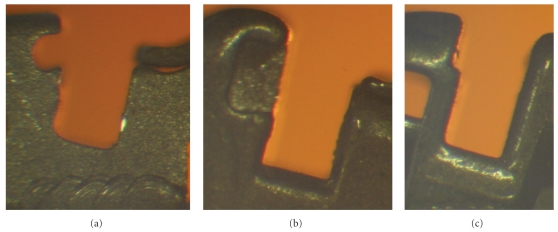
Representative images of each bracket are shown in Figure 3. Speed brackets have strongly pronounced rounding in the corners where the right and left walls meet the bottom. This study does not investigate the radius of the rounds, and the points that are selected for analysis are not in the round. However, the larger the rounding radius, the less accurate the assumption is that the slots are essentially a trapezoidal shape. The Damon bracket has a slight rounding in the corners at the slot bottom, and In-Ovation appears nearly square. Although the slot depth is not measured, it can be clearly seen in the pictures that Damon brackets have the deepest slot. This means the left and right wall lines are longer, which could cause a greater amount of error in the slot height measurements (bottom distance and top distance).
Figure 3.
Example photos of the slots of (a) Speed, (b) In-Ovation R, and (c) Damon Q.
Average measurements of all bracket types are presented in Table 1. The slot is 0.556 mm and 0.547 mm as measured at the bottom and top, respectively. Compared to the nominal slot size of 0.559 mm, statistically speaking 63% and 95% of Speed brackets are undersized as measured at the bottom and top, respectively. However, the reported bottom distance is not a realistic representation of the Speed bracket's actual bottom distance. The corners are not only rounded, but sunk in at the bottom of the slot, which violates the assumption that the slots are trapezoidal in shape. Therefore, the distance along the bottom of the slot would be effectively larger. On the other hand, the top distance, which is smaller than the measured bottom distance, is not impacted by rounded and sunken corners.
Table 1.
Comparison between Speed, In-Ovation, and Damon brackets.
| Speed | In-Ovation R | Damon Q | |
|---|---|---|---|
| Average | Average | Average | |
| (standard deviation) | (standard deviation) | (standard deviation) | |
| Bottom Distance (mm) | 0.556 (0.008) | 0.564 (0.009) | 0.572 (0.019) |
| Top Distance (mm) | 0.547 (0.007) | 0.583 (0.007) | 0.570 (0.022) |
| θ1 (degrees) | 87.72 (1.10) | 90.87 (0.72) | 89.24 (1.03) |
| θ2 (degrees) | 91.34 (1.53) | 90.61 (1.09) | 90.57 (1.18) |
| θ3(degrees) | −0.94 (1.35) | 1.47 (0.86) | −0.20 (0.84) |
| R2 Right Wall Line | 0.999 (0.001) | 0.999 (0.001) | 0.999 (0.001) |
| R2 Bottom Line | 0.993 (0.003) | 0.999 (0.001) | 0.998 (0.002) |
| R2 Left Wall Line | 0.996 (0.003) | 0.999 (0.001) | 0.999 (0.002) |
In-Ovation slot size is very near the nominal value at the bottom, but oversized by 2.6 standard deviations at the top of the slot, meaning that over 99.5% of In-Ovation brackets are oversized as measured at the top. The difference between the top and bottom slot width is the result of what Cash et al. term a “divergent” slot shape [10]. The divergent shape is also seen by the positive angle between the right and left walls.
Damon brackets are the most rectangular slot, as evidenced by having nearly 90° angles at the bottom corners (θ1 and θ2), and a near zero taper angle (θ3). This rectangular shape results in very similar top and bottom distances. Both are oversized compared to the nominal 0.559 mm slot by approximately 1%, on average.
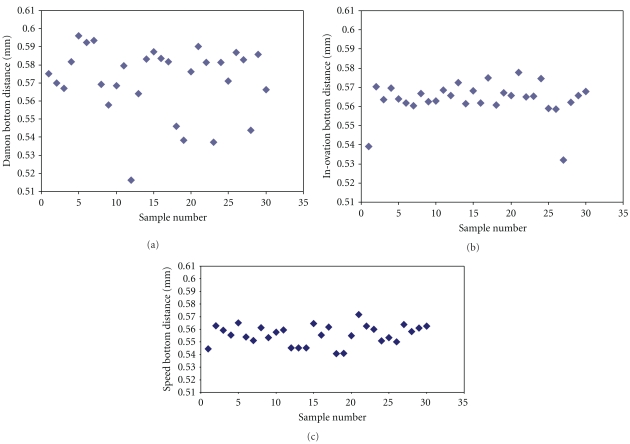
The variability of the bottom slot of the three test brackets is demonstrated in Figure 4. The measurements made of the In-Ovation brackets are subject to less scatter due to near perpendicular corners whereas Damon and Speed brackets exhibit more scatter due to the rounding of the corners.
Figure 4.
Scatter plot of Damon, In-Ovation, and Speed brackets showing distribution of data for measured bottom distance: (a) Damon Q bracket, (b) In-Ovation R bracket, and (c) Speed bracket.
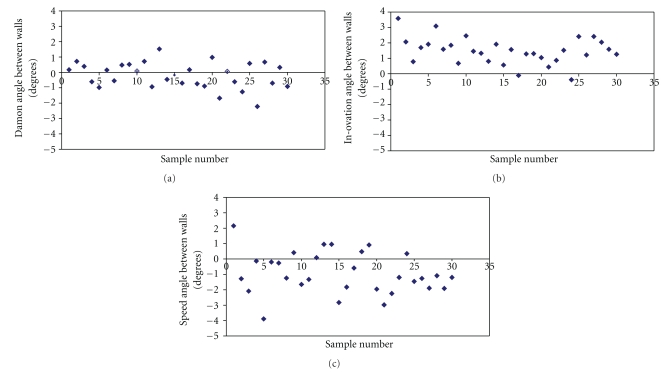
As well, the variability of the angles measured for the three brackets was examined. The resulting scatter plots can be seen in Figure 5. Due to the rounding of the corners, the Speed brackets have the widest spread of values among the three test brackets. This figure also shows that the Damon and In-Ovation brackets have less variability due to the near trapezoidal shape of the two bracket slots.
Figure 5.
Scatter plots of Damon, Speed, and In-Ovation brackets showing the distribution of data for the difference between measured left and right slot angles: (a) Damon Q bracket, (b) In-Ovation R bracket, and (c) Speed bracket.
Often tolerances are reported as being ±2 standard deviations since 95% of all data is within 2 standard deviations of the average. Using this rule of thumb, the tolerances of the slot heights are 15 μm, 15 μm, and 43 μm for Speed, In-Ovation, and Damon, respectively, as measured at the top of the slot. Damon notably has the highest tolerance in slot height. Using the formula presented by Meling et al. to calculate torque play [11], and assuming a rectangular slot and a nominal 0.483 × 0.635 mm (0.019 × 0.025 in) wire, the torque play theoretically changes 4.7° from a 43 μm difference in slot height. Using the same formula, the difference between the average torque play between a Speed and Damon bracket is 2.3°. These torque play differences are an idealized estimate, and actual torque play is dependent on factors such as bracket/wire friction and beveling of wire corners [2, 11–13].
Badawi et al. [14] reported torque expression for varying degrees of wire twist in self-ligating brackets. The standard deviations in torque measurements for all bracket types were large and the authors suggested that this may be partially related to variation in slot dimensions. Using their torque expression data, a torque play of 4.7° could result in variation of torque expression of 5–10 Nmm, which is clinically relevant. The difference in average torque play (2.3°) between Damon and Speed brackets testing in the present study is probably not a major clinical concern.
All three brackets demonstrate high levels of linearity on the right wall. Speed has a notable drop in linearity on the left wall and the bottom. It can be visually seen in Figure 3(a) that Speed has a slightly concave shape on the bottom of the slot, which accounts for the nonlinear behavior on the bottom. The left wall tends to have a slightly convex shape but varies from bracket to bracket. In-Ovation R and Damon are both highly linear, as evidence by being within 1 standard deviation of an R2 value of 1 on all three walls.
Although this is the most thorough analysis of slot profiles found in the current literature, this experimental procedure has limitations. Taking only 5 equally spaced points on each wall is not a full profile analysis. It is possible that a bracket could have an irregularity at the same place on each bracket which does not coincide with one of the investigated points. Also, differences in linearity must be severe to be able to draw conclusions from an R2 that is generated from only 5 points. Moreover, the assumption is made that the profiles all form a trapezoidal style shape. It is readily observed in Figure 3 that this is not the case for all brackets, especially for Speed brackets. The nonlinearity reported in Table 1 for the Speed bracket supports the notion that the trapezoidal assumption is not entirely true. Finally, if the photo of any brackets were to be taken at even a slight angle, it would skew the measurements of slot height and artificially increase the reported tolerances. It is possible that this is part of the reason for Damon's unusually high standard deviations.
The present study evaluated the mesial profiles of the brackets and it is possible that different results would have been obtained for the distal profiles. The use of best fit lines based on 15 points may underestimate the interaction between slot dimension and wire dimension. It is possible that local regions of the slot are narrower than what the best fit lines suggest. The next logical step in slot profile analysis is to utilize commercial software to generate analysis at hundreds or thousands of points along the profile, occasionally used industrially in quality control programs. This type of analysis would be able to measure maximum variations and identify all repeatable imperfections in the brackets. Future analysis should also include distal profiles of the brackets.
The International Organization for Standardization (www.iso.org/) lists the standards for “brackets and tubes for use in orthodontics ISO/FDIS 27020” as being under development. Bracket slot dimension tolerances should be included in ISO standards.
4. Conclusions
The purpose of this study was to investigate the manufacturing tolerances and repeatability of the slot profile in self-ligating orthodontic brackets.
-
(i)
A novel technique of measure slot profiles has been developed, which enables the calculation of slot height at the top and bottom of the slot profile, the slot taper, and the slot rectangularity as measured by the angles between the slot walls and bottom.
-
(ii)
Speed brackets have relatively nonlinear walls and large fillets at the base of the slot. In addition, Speed brackets have a slot height approximately 2% smaller than the nominal 0.559 mm size, as measured at the top of the slot profile.
-
(iii)
In-Ovation brackets have a slot shaped as a divergent taper at an average angle of 1.47°. Of the tested brackets, In-Ovation is closest to the nominal value of slot height, as measured at the slot base. It also most closely resembles a trapezoidal shape as evidenced by having the highest linearity, and visual inspection determines that it has the smallest radius at the corners of the slot base.
-
(iv)
Damon brackets are the most rectangular in shape, with nearly 90-degree corners between the bottom of the slot and the slot walls. Damon has the highest measured manufacturing tolerance, but the limitations in the experimental procedure would warrant additional research to make a conclusive statement regarding Damon's high variability between brackets. Damon brackets are on average 3% oversized compared to the nominal slot height.
Acknowledgment
Funding for this research was provided by the Dr. Reyburn McIntyre Fund and the Natural Sciences and Engineering Research Council of Canada (NSERC).
References
- 1.Kalpakjian S, Schmid SR. Manufacturing Engineering and Technology. 4th edition. Upper Saddle River, NJ, USA: Prentice Hall; 2001. [Google Scholar]
- 2.Fischer-Brandies H, Orthuber W, Es-Souni M, Meyer S. Torque transmission between square wire and bracket as a function of measurement, form and hardness parameters. Journal of Orofacial Orthopedics. 2000;61(4):258–265. doi: 10.1007/s000560050011. [DOI] [PubMed] [Google Scholar]
- 3.Gioka C, Eliades T. Materials-induced variation in the torque expression of preadjusted appliances. American Journal of Orthodontics and Dentofacial Orthopedics. 2004;125(3):323–328. doi: 10.1016/j.ajodo.2003.02.007. [DOI] [PubMed] [Google Scholar]
- 4.Meling TR, Ødegaard J, Seqner D. On bracket slot height: a methodologic study. American Journal of Orthodontics and Dentofacial Orthopedics. 1998;113(4):387–393. doi: 10.1016/s0889-5406(98)80009-7. [DOI] [PubMed] [Google Scholar]
- 5.Meling T, Ødegaard J, Holthe K, Meling EO, Segner D. A formula for the displacement of an arch wire when subjected to a second-order couple. American Journal of Orthodontics and Dentofacial Orthopedics. 1998;113(6):632–640. doi: 10.1016/s0889-5406(98)70223-9. [DOI] [PubMed] [Google Scholar]
- 6.Creekmore TD. Dr. Thomas D. Creekmore on torque. Journal of Clinical Orthodontics. 1979;13(5):305–310. [PubMed] [Google Scholar]
- 7.Creekmore TD, Kunik RL. Straight wire: the next generation. American Journal of Orthodontics and Dentofacial Orthopedics. 1993;104(1):8–20. doi: 10.1016/0889-5406(93)70023-H. [DOI] [PubMed] [Google Scholar]
- 8.Siatkowski RE. Loss of anterior torque control due to variations in bracket slot and archwire dimensions. Journal of Clinical Orthodontics. 1999;33(9):508–510. [PubMed] [Google Scholar]
- 9.Kusy RP, Whitley JQ. Assessment of second-order clearances between orthodontic archwires and bracket slots via the critical contact angle for binding. Angle Orthodontist. 1999;69(1):71–80. doi: 10.1043/0003-3219(1999)069<0071:AOSOCB>2.3.CO;2. [DOI] [PubMed] [Google Scholar]
- 10.Cash AC, Good SA, Curtis RV, McDonald F. An evaluation of slot size in orthodontic brackets—are Standards as expected? Angle Orthodontist. 2004;74(4):450–453. doi: 10.1043/0003-3219(2004)074<0450:AEOSSI>2.0.CO;2. [DOI] [PubMed] [Google Scholar]
- 11.Meling TR, Ødegaard J, Meling EO. On mechanical properties of square and rectangular stainless steel wires tested in torsion. American Journal of Orthodontics and Dentofacial Orthopedics. 1997;111(3):310–320. doi: 10.1016/s0889-5406(97)70190-2. [DOI] [PubMed] [Google Scholar]
- 12.Meling TR, Ødegaard J. The effect of cross-sectional dimensional variations of square and rectangular chromecobalt archwires on torsion. Angle Orthodontist. 1998;68(3):239–248. doi: 10.1043/0003-3219(1998)068<0239:TEOCSD>2.3.CO;2. [DOI] [PubMed] [Google Scholar]
- 13.Meling T, Ødegaard J, Meling E. Cross-sectional stability of square and rectangular stainless steel wires. Kieferorthopädische Mitteilungen. 1994;8:41–54. [Google Scholar]
- 14.Badawi HM, Toogood RW, Carey JPR, Heo G, Major PW. Torque expression of self-ligating brackets. American Journal of Orthodontics and Dentofacial Orthopedics. 2008;133(5):721–728. doi: 10.1016/j.ajodo.2006.01.051. [DOI] [PubMed] [Google Scholar]


