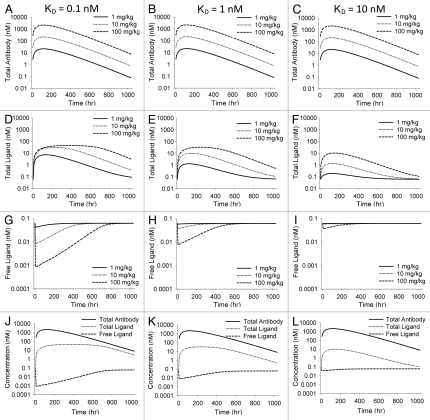
Figure 2.
Simulations illustrating effects of varying KD in the general antibody-ligand PK/PD model. All parameters except KD were held constant throughout simulations. KD was 0.1, 1 and 10 nM for the three scenarios. Effect of varying KD on total antibody concentration (A–C), total ligand (D–F) and free ligand (G–I) are shown. (J–L) show total antibody, total ligand and free ligand on the same plot for each scenario at a 100 mg/kg dose of antibody.

