Abstract
During the first 5 years (1981–1985) of the liver transplantation program in Pittsburgh, a total (preoperative, intraoperative, and postoperative) of 18,668 packed red cell units, 23,627 fresh-frozen plasma units, 20,590 platelet units, and 4241 cryoprecipitate units was transfused for the procedures. This represents 3 to 9 percent of the total of blood products supplied by the Central Blood Bank to its 32 member hospitals. Six hundred thirty-six (636) transplants were performed on 485 patients in two hospitals: the Presbyterian University Hospital (564 beds) and Children’s Hospital of Pittsburgh (236 beds). All of the blood components used in the operations were procured and released by the Central Blood Bank. This report describes some of these findings.
The Development of liver transplantation (LTx) programs in recent years has put new demands on blood banks and transfusion services, which must devise means of coping with this new challenge. The Central Blood Bank of Pittsburgh (CBB) provides blood product support for 32 member hospitals. Two of these hospitals, Presbyterian University Hospital (PUH, 564 beds) and Children’s Hospital of Pittsburgh (CHP, 236 beds) began doing liver transplants in 1981. The results of this experiment are reported here.
Study Results
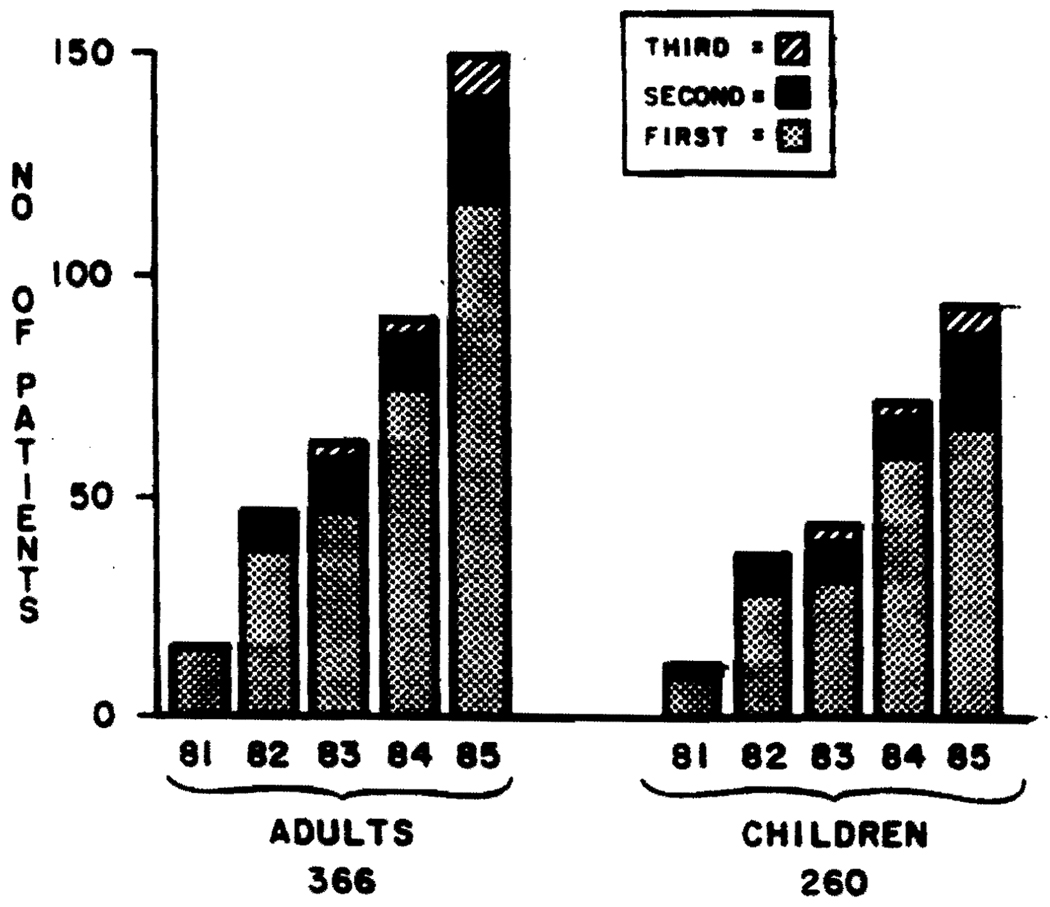
Figure 1 divides the numbers of operations done in Pittsburgh by 1) the year of transplantation, 2) the hospital, and 3) the number of transplantations per patient. The numbers increased almost exponentially. Table 1 shows that, during the first 5 years, 290 adults and 195 children underwent 626 LTx. Of these, 61 adults and 54 children received two livers, and 15 adults and 11 children received three livers.
FIG 1.
Numbers of LTx per year, per hospital, and per repeat operation.
Table 1.
Numbers of liver transplantations
| PUH* |
CHP* |
||||||||
|---|---|---|---|---|---|---|---|---|---|
| 1‡ | 2 | 3 | Total | 1‡ | 2 | 3 | Total | Total | |
| 1981 | 16 | 1 | 0 | 17 | 9 | 2 | 1 | 12 | 29 |
| 1982 | 37 | 9 | 0 | 46 | 29 | 9 | 0 | 38 | 84 |
| 1983 | 47 | 12 | 2 | 61 | 32 | 10 | 2 | 44 | 105 |
| 1984 | 75 | 13 | 3 | 91 | 59 | 10 | 3 | 72 | 163 |
| 1985 | 115 | 26 | 10 | 151 | 66 | 23 | 5 | 94 | 245 |
| Total | 290 | 61 | 15 | 366 | 195 | 54 | 11 | 260 | 626 |
PUH = Presbyterian University Hospital.
CHP = Children’s Hospital of Pittsburgh.
Number of liver LTx performed in reported patients.
Table 2 shows the components used preoperatively, intraoperatively, and postoperatively. Most packed red cells (RBCs) (64%) and cryoprecipitate (86%) were used intraoperatively. Slightly more than one-half of the fresh-frozen plasma (FFP) and less than one-half of the platelets were used in the operating room. Table 2 also compares the total number of components used for LTx with those distributed by CBB in the 5 years. The percentages ranged from 3 for RBC to 9.2 for FFP.
Table 2.
Total amounts of blood products (1981–1985) for adults and children
| RBC | FFP | Plat* | Cryo† | |
|---|---|---|---|---|
| Preoperative | 1546 | 2572 | 1098 | 96 |
| Intraoperative | 12,007 | 12,884 | 9420 | 3640 |
| Postoperative | 5315 | 8171 | 10,072 | 505 |
| Total | 18,868 | 23,627 | 20,590 | 4241 |
| CBB total units | 622,000 | 256,000 | 240,000 | 60,000 |
| LTx use (% of CBB total) |
3.0 | 9.2 | 8.6 | 7.1 |
Plat = Platelet units.
Cryo = Cryoprecipitate units.
Table 3 shows the use of blood components in the two hospitals in 1985, the last year of this study. These high percentages of blood component use are even more striking if the total of 31,000 patient admissions to the two hospitals is considered. The patients who had LTx accounted for less than 0.01 percent of admissions, yet used approximately 25 percent of the blood.
Table 3.
Total blood products in units used in each hospital, total used for LTx, and percentage for LTx (1985)
| PUH | LTx | Percentage* of LTx |
CHP | LTx | Percentage* of LTx |
|
|---|---|---|---|---|---|---|
| RBC | 23152 | 4318 | 19 | 4142 | 1093 | 26 |
| FFP | 15037 | 4759 | 32 | 3286 | 2049 | 62 |
| Plat† | 23216 | 4788 | 21 | 4593 | 2179 | 47 |
| Cryo‡ | 2934 | 1526 | 52 | 1432 | 229 | 16 |
Percent of use of this component at the institution.
Plat = Platelet units.
Cryo = Cryoprecipitate units.
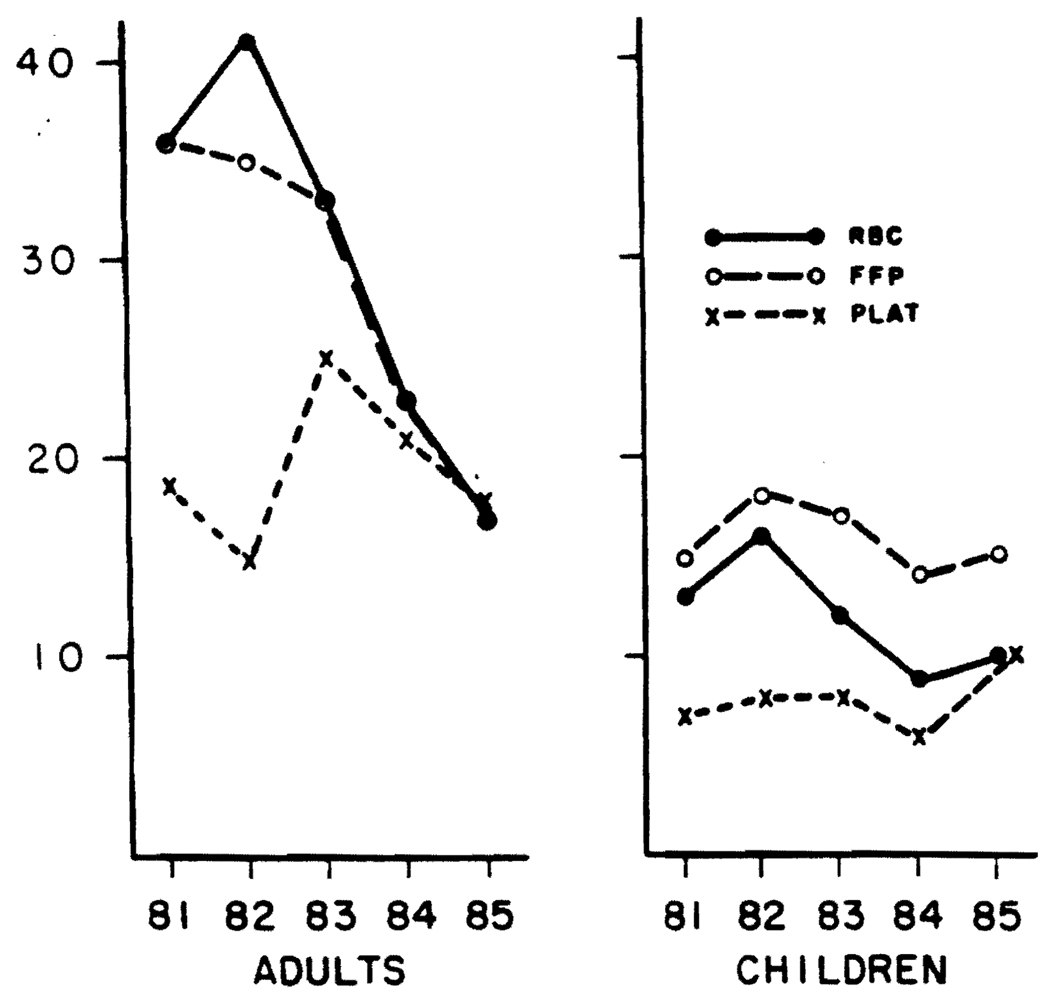
Figure 2 shows the mean use of blood components in the operating room per patient per year. After 1982, there were sharp drops in the use of RBC and FFP in adults. The use of platelets and cryoprecipitate followed no pattern, and the pediatric operations showed no trend to less use of blood components.
FIG 2.
Mean units of RBC, FFP, or platelets used per operation per year (including second and third LTx). Plat = platelets.
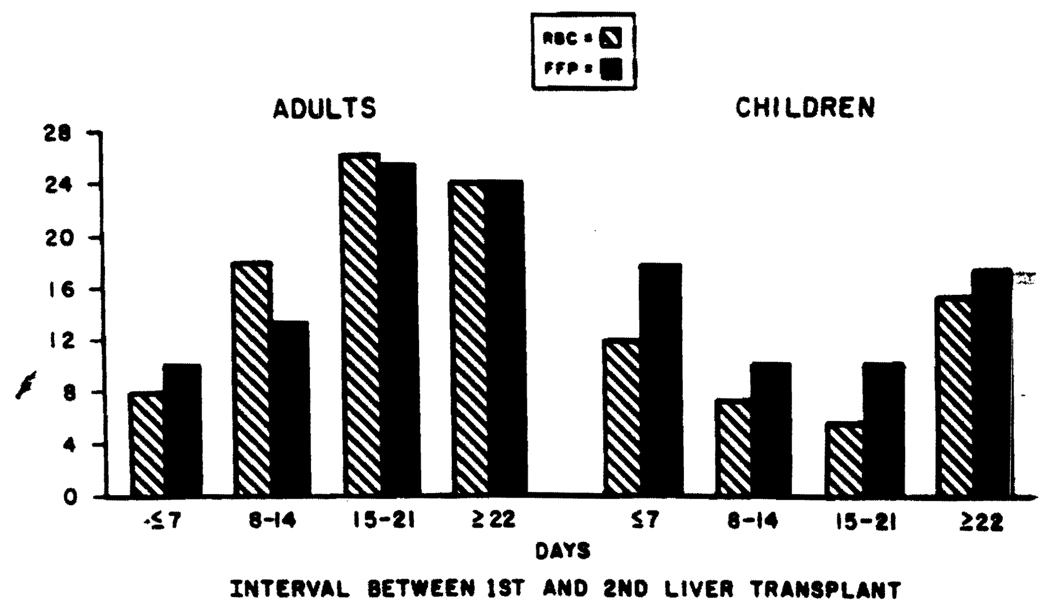
Table 4 shows the decrease in blood use associated with second and third LTx procedures in adults. Blood component use in the first LTx was somewhat higher than that shown for all LTx. Figure 3 shows that, if the interval between first and second LTx in adults was 7 days or less, the blood use per patient was roughly one-half (RBC, 8 units; FFP, 10 units) that of the total for all second LTx. Negligible differences were noted in repeat procedures among children who had LTx.
Table 4.
Blood use in adults (mean units/patient/operation) in all procedures and in repeat transplantation
| Number of procedures |
RBC | FFP | Plat* | Cryo† | |
|---|---|---|---|---|---|
| All LTx | 366 | 25 | 24 | 20 | 9 |
| 1st LTx only | 290 | 27 | 26 | 20 | 10 |
| 2nd LTx only | 61 | 18 | 18 | 19 | 8 |
| 3rd LTx only | 15 | 17 | 18 | 21 | 9 |
Plat = Platelet units.
Cryo = Cryoprecipitate units.
FIG 3.
Mean units of RBC and FFP in second LTx related to the interval between first and second LTx.
Table 5 shows the mean use of “blood” (RBC plus FFP) in 229 patients who fell into four of the major diagnostic categories: postnecrotic cirrhosis (PNC, primary biliary cirrhosis (PBC, sclerosing cholangitis (SC, and carcinoma/neoplasia (CA). Because of the dependence on surgical technique and the changes observed by year of surgery, the relationship between original diagnosis and blood use is difficult to express. It is obvious that in 1985 the PNC group that showed the greatest number of coagulation abnormalities also used the greatest amount of blood, whereas the CA group that showed the most normal coagulation patterns used the least blood.
Table 5.
Mean “blood” (RBC + FFP) use in 229 adult patients* divided by diagnostic category and year
| PNC† |
PBC‡ |
SC§ |
CA∥ |
|||||
|---|---|---|---|---|---|---|---|---|
| Number | Mean | Number | Mean | Number | Mean | Number | Mean | |
| 1981 | 8 | 78 | 1 | 37 | 1 | 16 | 3 | 31 |
| 1982 | 6 | 136 | 11 | 47 | 5 | 92 | 6 | 50 |
| 1983 | 15 | 90 | 11 | 49 | 7 | 86 | 7 | 60 |
| 1984 | 20 | 47 | 13 | 48 | 16 | 27 | 6 | 33 |
| 1985 | 40 | 37 | 43 | 30 | 6 | 30 | 4 | 23 |
Miscellaneous and fulminant omitted.
PNC = Postnecrotic cirrhosis.
PBC = Primary biliary cirrhosis.
SC = Sclerosing cholangitis.
CA = Carcinoma/neoplasia.
Discussion
The preceding findings demonstrate the major demands on blood banks in centers where significant numbers of LTx are performed. Early studies from this laboratory1,2 and the data shown in Table 5 suggest that blood use was at least to some extent dependent on the basic disease and the severity of preoperative coagulation defects. Improvements in surgical and anesthesiologic techniques, intraoperative coagulation monitoring, and therapy of intraoperative fibrinolysis3 may have contributed to the substantial drop in blood use per adult patient over the period described. Future developments may result in further decreases in blood component usage. Due to the surgical demands for blood and blood components (liver transplantation, heart and heart-lung transplantation, etc.), CBB found it necessary to import from other blood banks about 25 percent of the blood components used. Autologous intraoperative recovery of blood supplied only a moderate portion of the demand. For LTx, this may have been due in part to the presence of ascites or to the possible bacterial contamination of the operative area. Washed autologous red cells might have been satisfactory, but recovery was slow in the face of frequent large and immediate needs. A new pump capable of delivery of 21 per min4 was life-saving for some patients who were near exsanguination.
Another concern was the possible introduction of infectious or viral agents due to the large numbers of donor exposures. In 1982, the mean number of exposures per patient was 173 units of blood components; in 1983, it was 201. In these years, all blood was tested for hepatitis B surface antigen but not for antibodies to human immune deficiency virus (HIV) or for non-A, non-B (NANB) hepatitis. If transmission of NANB hepatitis can occur from 5 percent5 of donor units and HIV from 0.04 percent,6 one would expect these transfusion-transmitted infections to be relatively common. Such was not observed, perhaps because new hepatitis was masked by the recurrence of old hepatitis. Drug-induced (cyclosporine) toxic effects on the new livers might also have obscured NANB effects. High-dose immunosuppressive therapy mimicked the symptoms of acquired immune deficiency syndrome (AIDS), and the two may not be able to be differentiated. In fact, the Centers for Disease Control does not recognize a diagnosis of AIDS in clinically immunosuppressed patients with opportunistic infections. CBB is currently recommending that modified whole blood (platelet-poor7) be substituted for the first 10 units of both RBC and FFP, for a significant decrease in infection exposure. In the early phases of the operation, platelets would not be added because of their possible thrombogenic effects. Coagulation factors in the reconstituted stored whole blood would be expected to be somewhat lower than in FFP.
References
- 1.Bontempo FA, Lewis JH, Van Thiel DH, et al. The relation of preoperative coagulation findings to diagnosis, blood usage, and survival in adult liver transplantation. Transplantation. 1985;39:532–536. doi: 10.1097/00007890-198505000-00015. [DOI] [PMC free article] [PubMed] [Google Scholar]
- 2.Butler P, Israel L, Nusbacher J, Jenkins DE, Jr, Starzl TE. Blood transfusion in liver transplantation. Transfusion. 1985;25:120–123. doi: 10.1046/j.1537-2995.1985.25285169201.x. [DOI] [PMC free article] [PubMed] [Google Scholar]
- 3.Kang YG, Lewis JH, Navalgund A, et al. Epsilonaminocaproic acid for treatment of fibrinolysis during liver transplantation. Anesthesiology. (in press). [PMC free article] [PubMed] [Google Scholar]
- 4.Sassano JJ. The rapid infusion system. In: Winter PW, Kang YG, editors. Hepatic transplantation. Philadelphia: Praeger; 1986. pp. 120–134. [Google Scholar]
- 5.Alter HJ, Purcell RH, Holland PV, Alling DW, Koziol DE. Donor transaminase and recipient hepatitis: impact on blood transfusion services. JAMA. 1981;246:630–634. [PubMed] [Google Scholar]
- 6.Schorr JB, Berkowitz A, Cumming PD, Katz AJ, Sandler SG. Prevalence of HTLV-III antibody in American blood donors (letter) N Engl J Med. 1984;313:384–385. doi: 10.1056/NEJM198508083130610. [DOI] [PubMed] [Google Scholar]
- 7.Counts RB, Haisch C, Simon TL, Maxwell NG, Heimbach DM, Carrico CJ. Hemostasis in massively transfused trauma patients. Ann Surg. 1979;190:91–99. doi: 10.1097/00000658-197907000-00020. [DOI] [PMC free article] [PubMed] [Google Scholar]


