Abstract
We report the establishment of three distinct pituitary-derived murine cell lines generated by targeted T-antigen-induced transformation. The Pit1/0 line expresses pituitary-specific transcription factor-1 (Pit-1) but lacks expression of GH, prolactin (Prl), or TSH, and the Pit1/Prl line is selectively positive for Pit-1 and Prl. The third line, Pit1/Triple, expresses Pit-1 and all three of the Pit-1-dependent hormones: GH, Prl, and TSHβ/glycoprotein hormone α-subunit. The three corresponding transformation events appear to have captured pituitary cells representing: 1) an initial step in the Pit-1(+) lineage, 2) a cell line that corresponds to the differentiated lactotrope, and 3) a novel tri-hormone intermediate that may represent a pivotal step in Pit-1(+) cell lineage differentiation. The documented dependence of the tri-hormone expression in the Pit-1/Triple line on Pit-1 activity supports its potential role in the pathway of pituitary cell differentiation. The presence of a 123-kb human transgene encompassing the hGH locus (hGH/bacterial artificial chromosome) in two of these lines, Pit1/0 and Pit1/Prl, further expands their potential utility to the analysis of gene activation within the hGH gene cluster.
Three cell lines representing distinct stages of the Pit-1 (+) lineage are generated from the mouse pituitary by T-antigen mediated transformation.
The anterior pituitary regulates a broad spectrum of physiologic functions including growth, reproduction, lactation, and general metabolism. It is comprised of five cell types, each marked by expression of a distinct hormone: somatotropes (GH), lactotropes [prolactin (Prl)], thyrotropes (TSHβ), corticotropes (melanocyte stimulating hormone/ACTH), and gonadotropes (LH and FSH). These cells arise at distinct developmental stages of anterior pituitary organogenesis, beginning at embryonic d (e)8.5 by the formation of Rathke’s pouch in response to signaling between the ventral diencephalon and the oral ectoderm. The subsequent phase of rapid cell proliferation and differentiation is directed by precise spatial/temporal patterns of overlapping signaling gradients and the interplay of multiple transcription factors (1). A critical determinant in this process is the POU-homeo domain protein, pituitary-specific transcription factor (Pit)-1. This transcription factor is essential for expansion and terminal differentiation of three of the five anterior pituitary lineages: somatotropes, lactotropes, and thyrotropes (1,2). The promoters of the three corresponding hormone genes, GH, Prl, and TSHβ, each contains one or more Pit-1 binding sites as does the promoter of the Pit-1 gene itself (3,4,5). In humans, as opposed to rodents, the GH gene is encoded in a cluster of five genes that is under long-range control of a multicomponent locus control region (LCR) (6). The major pituitary-specific component of the hGH LCR, hypersensitive site I (HSI), also contains an array of functionally critical Pit-1 binding sites (7). Consistent with its central role in pituitary cell differentiation, the loss of Pit-1 expression in mice and humans leads to a failure of somatotrope, lactotrope, and thyrotrope formation, resulting in a combined pituitary hormone deficiency syndrome (8,9).
Although the essential role of Pit-1 in anterior pituitary development is well established, the hierarchy of additional regulatory factors controlling gene activation and repression during this process and the exact identity and ordering of cellular intermediates is less well understood. Such studies are impeded to a certain extent by the difficulty in isolating quantities of pure populations of cells representing defined steps in this process. To address this need, we have used SV40 T-antigen (Tag)-induced cell transformation (10) to establish cell lines representing distinct stages in Pit-1-dependent cell differentiation in the anterior mouse pituitary.
Results
Generation of Tag transgenic mice and induction of pituitary tumors
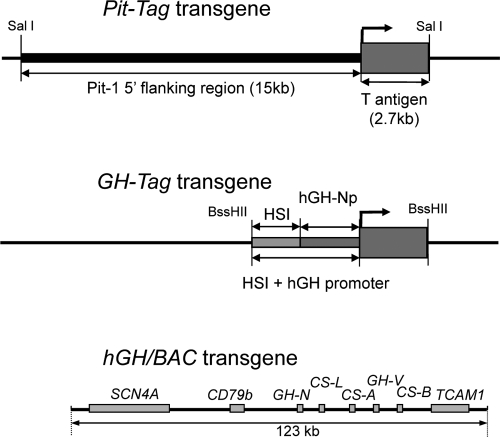
The SV40 Tag open reading frame (ORF) was placed under the transcriptional control of either Pit-1 regulatory sequences or GH regulatory sequences (Pit-Tag and GH-Tag transgenes, respectively) (Fig. 1). In the former case, 15 kb of Pit-1 gene 5′-flanking sequences, extending to the Pit-1 promoter, were used to drive Tag expression. This Pit-Tag transgene is the same as that used to generate the GHFT1 cell line (10). To target Tag oncogene expression in cells at a later developmental stage, we placed the same Tag open reading frame under control of hGH-N regulatory elements, including the minimal hGH-N promoter linked to the HSI determinant of the hGH LCR. As was shown previously in our laboratory (6,11,12), the deoxyribonuclease (DNase) I HSI represents an essential component of the pituitary hGH LCR. On the basis of these previously published studies, the use of this DNA element, together with minimal hGH-N promoter, was predicted to activate expression of Tag during lactosomatotrope terminal differentiation.
Figure 1.
Schematic representation of the Tag transgenes. Pit-Tag, SV 40 Tag ORF (encoding both large and small Tags and their polyA signal) was placed under control of the Pit-1 5′-regulatory sequences (15 kb) (10). The transgene was released from the carrying plasmid DNA with SalI before injection. GH-Tag, Pit-1 regulatory sequences in Pit-Tag construct were replaced with hGH-N regulatory sequences (404-bp HSI encompassing fragment of the hGH-N LCR and a 500-bp segment encompassing the hGH-N minimal promoter). The GH-Tag transgene was released from the plasmid with BssHII before injection. hGH/BAC transgene, This 123-kb human BAC encompasses the five-gene hGH cluster along with the flanking genes SCN4A, CD79b, and TCAM1. The position of each gene is indicated by a labeled rectangle; exon structure is not displayed. hGH-NP, hGH-N promoter.
The two transgenes, Pit-Tag and GH-Tag, were separately injected into fertilized mouse eggs generated by crossing a male carrying the 123-kb hGH/bacterial artificial chromosome (BAC) transgene (13) with a CD1 (wild type) female. The hGH/BAC transgene encompasses the entire hGH gene cluster and extensive flanking sequences (hGH/BAC) (Fig. 1) and is appropriately expressed in the mouse (line 1210B) (13). As expected, these injections produced a number of Tag-transgenic mice (Pit-Tag or GH-Tag), approximately half of which were compound transgenic in that they also carried the hGH/BAC transgene.
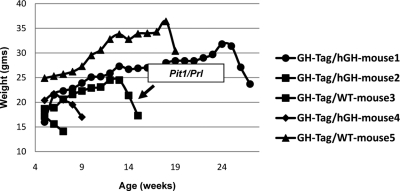
All Tag-transgenic founder mice were weighed on a regular basis from the time of birth and were observed for behavioral abnormalities. All measurements and observations were carried out in parallel on nontransgenic littermates. The mice carrying the Tag transgenes developed evidence of pituitary tumors, primarily detected by a drop in growth rate, between 4 and 26 wk of age (see Pit1/Prl examples, Fig. 2). The affected mice were killed at the first sign of distress, and the tumors were excised. A total of 19 Tag mice from Pit-Tag transgene injections and 25 Tag positives from GH-Tag transgene were generated. Frequent early death (before 5 wk of age) was observed for both transgenes so that only six Pit-Tag and 11 GH-Tag tumors were successfully extracted from adult mice and subjected to the cell line establishment procedure. The cells in these tumors were disaggregated with collagenase P and DNase I followed by mechanical dispersal (10). The cells were then plated in high serum DMEM (see Materials and Methods). This approach facilitates cell attachment to the plate, stimulates cell division, and reduces fibroblast contamination of the culture (14). The initial cell culture contained a heterogeneous mixture of tumor cells, fibroblasts, and uncharacterized cells. Intensive cell growth over the initial several weeks was followed by a slower phase of overall cell proliferation. Eventually, stable cultures were established from three independent tumors, two targeted by Pit-Tag and one by GH-Tag. These lines had stable doubling times, could be cultured to confluence without excessive cell death, could be expanded after single cell cloning, and could be stored in liquid nitrogen and subsequently thawed and cultured. All three lines have been grown in culture for 1–2 yr without change in their phenotypes or expression profiles (see below).
Figure 2.
Growth curves of GH-Tag transgenic mice demonstrate abrupt decrease in weights as mice develop pituitary tumors. Five mice were identified as Tag positive in this particular round of GH-Tag transgene injections. Three of these mice were also transgenic for the hGH-N BAC. All five mice developed pituitary tumors. In all cases, tumor formation was marked by a dramatic downward inflection in the weight curve, indicating the time point for tumor extraction. Each tumor was placed in separate culture, and a single line (Pit1/Prl) was successfully established.
Expression analysis of the three established cell lines
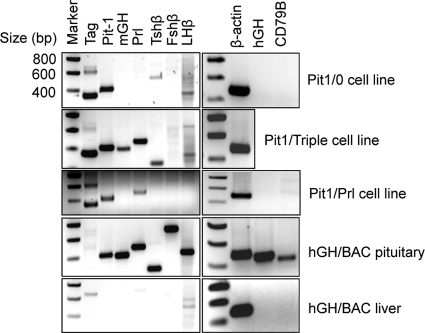
Random-primed cDNA pools were prepared from RNA isolated from each cell line, and gene expression was assessed by targeted PCR (Fig. 3). The analysis focused on expression of Tag, Pit-1, the three Pit-1-dependent pituitary hormones (GH, Prl, and TSHβ), and the Pit-1-independent gonadotrope hormones (FSHβ and LHβ). β-Actin mRNA was included in the analysis as a positive control. All PCR products were confirmed to originate from mRNA and all primers were designed to produce products that clearly distinguish cDNA from genomic (intron containing) amplification products. The two cell lines carrying the hGH/BAC transgene were additionally tested for expression of hGH and hCS-A (human chorionic somatomammotropin A).
Figure 3.
RT-PCR analyses reveal distinct expression profiles for each of the three Tag-transformed cell lines. RNAs from each of the three new pituitary cell lines were analyzed in parallel with total mouse pituitary mRNA and total liver mRNA isolated from an hGH/BAC transgenic mouse, as controls. The analysis of the hGH/BAC pituitary was positive for each of the indicated pituitary hormone mRNAs and negative for Tag mRNA. Each of the amplified cDNA bands corresponds to predicted size. As expected, the liver of this mouse is lacking all of the mRNAs of interest. Each of the three newly generated cell lines displays the expression of a distinct subset of pituitary mRNAs. The faint band generated in the Tshβ analysis of the Pit1/0 line and the faint bands in several of the Lhβ analyses represent background unrelated to hormone expression (compare with pituitary RNA control study). A 200-bp size marker ladder is shown to the left of each gel.
Pit1/0 cell line
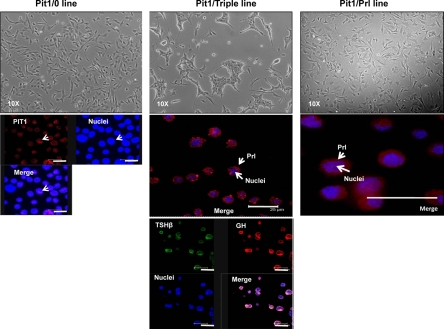
This line was established from a pituitary tumor that developed at 12 wk of age in a mouse carrying the Pit-Tag and hGH/BAC transgenes. Because the Pit-Tag transgene was identical to that used to generate the previously reported GHFT1 line (10), the two lines were directly compared. We noted a marked similarity in cell morphology between these two lines (Fig. 4 and data not shown) with a cell doubling time of 24 h for both. As is the case for GHFT1 cells, the Pit1/0 cells were Pit-1(+) but lacked expression of the Pit-1-dependent hormones (GH, Prl, and TSHβ) (Fig. 3). Immunofluorescent analysis confirmed the expression of Pit-1 with the expected nuclear localization (Fig. 4). As has been modeled for the GHFT1 cells, the Pit1/0 line most likely represents the initial step of somato-lacto-thyrotropic differentiation at which time the Pit-1 gene is expressed, but subsequent steps in terminal differentiation have not yet occurred (10). The major difference between the Pit1/0 cell line and the GHFT1 line is that the former contains an integrated copy of a fully functional hGH/BAC transgene (13). This transgene, not unexpectedly, remains transcriptionally silent in this line.
Figure 4.
Phase contrast and immunofluorescence analyses of the three Tag-transformed cell lines confirm distinct cell morphology and hormone expression profiles. Phase photomicrographs of the three cell lines are shown in the top three panels and immunofluorescence studies in the lower panels. The Pit1/0 and Pit1/Prl lines have a similar single-cell appearance (upper right and upper left panels, respectively), whereas the Pit1/Triple line displays a strong tendency to form cell clusters (center top panel). Pit-1 protein was detected within the nuclei of all cells in each of the three lines (the Pit1/0 line shown here and data not shown). The coexpression of Prl, GH, and TSHβ in all Pit1/Triple cells is demonstrated by the immunofluorescence study (center middle and lower panels); all cells are positive for all three hormones. The merge frame in this study combines the signals from the GH and TSHβ staining. The Pit1/Prl cell line is positive for Prl, consistent with the RNA analysis. Bars in the immunofluorescence images, 25 μm.
Pit1/Triple cell line
This line was generated from an independent Pit-Tag-induced pituitary tumor that was detected and harvested at 20 wk of age. The morphology and the pattern of marker expression in this Pit1/Triple line differed markedly from the Pit1/0 and GHFT1 cell lines. These cells grew at a slower rate (2.5-d doubling time), and they displayed a strong tendency to form cell clusters (Fig. 4). In addition to the expression of the Tag transgene, these cells coexpress Pit-1 and all three of the Pit-1-dependent hormone genes, GH, Prl, and TSHβ (Fig. 3). In contrast, there is no evidence for expression of Pit-1-independent pituitary markers (FSHβ and LHβ). These RT-PCR data were confirmed by immunofluorescence (Fig. 4), which confirmed that the Pit1/Triple cells express all three Pit-1-dependent hormones.
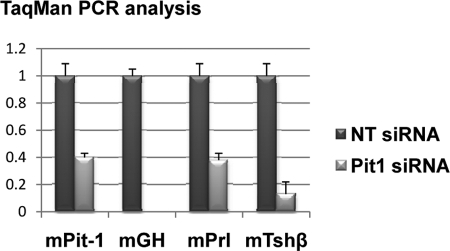
To explore the basis for the tri-positive hormone phenotype, we assessed the impact of Pit-1 gene silencing on hormone gene expression in these cells. The cells were evaluated 72 h after Pit-1 small interfering RNA (siRNA) transfection for Gh, Prl, and Tshβ mRNAs by real-time RT-PCR (Fig. 5). Two independent Pit-1 silencing experiments demonstrated a complete loss of Gh mRNA, a 10-fold decrease in Tshβ mRNA, and a 2.5-fold decrease in Prl mRNA. These data confirm that the tri-positive hormone expression profile in the Pit1/Triple cell line is dependent on Pit-1 action.
Figure 5.
Tri-hormone expression in the Pit1/Triple cell line is Pit-1 dependent. Real-time PCR data representing two independent studies revealed a significant negative impact of the Pit-1 depletion (Pit1 siRNA) on mGH, Prl, and Tshβ levels when compared with a nontargeting siRNA (NT siRNA). Error bars, 1 sd. In each binary comparison, the difference between Pit-1 siRNA and nontargeting siRNA is highly significant (P < 0.001).
Pit1/Prl cell line
The third cell line was established from a pituitary tumor induced by the GH-Tag transgene. This transgene was designed to transform a Pit-1 expressing cell at a later stage of pituitary development. A mouse that was transgenic for both the GH-Tag and hGH/BAC transgenes developed a clinically apparent tumor at 15 wk (Fig. 2). The cells from this tumor grew at an intermediate rate (36-h doubling time) and were morphologically similar to the Pit1/0 and GHFT1 cells (Fig. 4). mRNA and protein (immunofluorescent microscopy) analyses revealed expression of both Pit-1 and Prl in the absence of GH, TSHβ, human GH (hGH), and hCS-A (Figs. 3 and 4 and data not shown).
Analysis of cell lines for expression of additional factors
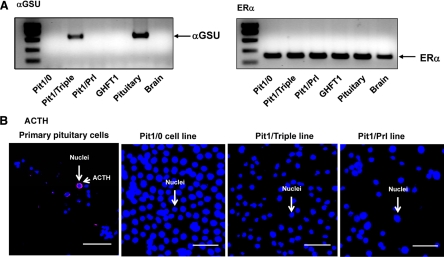
We tested each of the cell lines for additional markers of pituitary cell differentiation and function. These markers included estrogen receptor (ER)α, GATA-2 (GATA binding protien 2), prophet of Pit-1 (Prop-1), ACTH, and glycoprotein hormone α-subunit (αGSU). ERα was highly expressed in all cell lines (Fig. 6A), GATA-2 was expressed at very low levels in all cell lines, and Prop-1 could not be detected, although in the later case, a robust positive control was not available for comparison (data not shown). The analysis of αGSU was more informative (Fig. 6A). As defined in prior studies, αGSU first becomes detectable in the developing Rathke’s pouch at mouse e8.5, peaks at e11, and its expression subsequently drops to undetectable levels in somatotropes and lactotropes, whereas it remains active in the thyrotropes and gonadotropes through adulthood (1). Of note, αGSU mRNA was only detected in Pit1/Triple cells. This expression was consistent with the expression of TSHβ in this cell line and further supports the characterization of the Pit1/Triple cell line as representing an intermediately positioned cell in the Pit-1 lineage that precedes the divergence of the thyrotrope and the somato-lactotropes. There was no ACTH protein observed in any of the newly established cell lines (Fig. 6B).
Figure 6.
Analysis for expression of additional factors in newly established cell lines. A, RT-PCR assessment for αGSU and ERα. RNA samples from each of the three new cell lines were assessed by RT/PCR for αGSU and ERα mRNA expression in parallel with the GHFT1 line and mRNA isolated from mouse pituitary and brain of a wild-type mouse. Positive and negative controls (adult mouse pituitary and liver, respectively) demonstrated the expected expression patterns. These data reveal that αGSU is selectively expressed in the Pit1/Triple line. This finding is consistent with the expression of the Tshβ mRNA in this line. ERα was found to be ubiquitously expressed in all cell lines and tissues analyzed. B, Immunofluorescence assessment for ACTH. Analysis of disaggregated primary pituitary cells demonstrates corticotrope (cytoplasmic ACTH staining) cells, whereas the parallel analysis of the three cell lines fails to reveal evidence ACTH expression.
Pit-1 RNA and protein levels in newly established cell lines
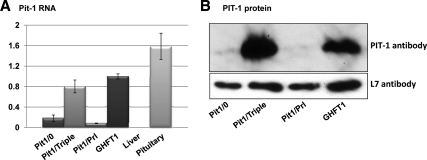
Pit-1 plays a critical role in anterior pituitary development and is essential for the differentiation of somatotropes, lactotropes, and thyrotropes (1,2). Using the newly established cell lines along with the GHFT-1 cells, we tested the hypothesis that the extent of anterior pituitary cell differentiation can be directly related to levels of Pit-1 expression. Because there may be a transient discordance between Pit-1 mRNA and protein expression early in the developmental pathway (10), both were quantified (Fig. 7). The expression of Pit-1 mRNA in the Pit1/0, Pit1/Triple, Pit1/Prl, and GHFT1 cell lines spanned a 10-fold range. The highest levels of Pit-1 expression, at both the mRNA and protein levels, were in the Pit1/Triple and the GHFT1 cells. The general concordance of mRNA and protein expression failed to recapitulate the proposed in vivo delay in Pit-1 protein production. The high level of Pit-1 expression in the GHFT1 line suggests that high-level expression of Pit-1 is not sufficient to drive GH gene activation. In contrast, cells with essentially the same high level of Pit-1 expression (Pit1/Triple) are tri-positive, and the cells that most resemble the mature lactotrope (Pit1/Prl) have levels of Pit-1, which, although clearly present (see Fig. 3), are quite low. These data support a model in which the differentiation of the cell types and the corresponding hormone gene expression, although dependent on Pit-1 (Fig. 5), are not a direct function of Pit-1 expression levels.
Figure 7.
Analysis of Pit-1 RNA and protein levels in the newly established cell lines reveals a lack of correlation with hormone gene expression. A, Real-time PCR quantitative assessment of Pit-1 expression in the three new cell lines is shown along with the analysis of GHFT1 cell lines (10). Controls shown include analysis of RNA from liver and pituitary from a wild-type mouse. B, Western blot analysis of Pit-1 protein levels in indicated pituitary cell lines.
Discussion
Cultured cell lines have contributed substantially to the analysis of pituitary cell function and hormone expression. Lines that have been of particular utility in this regard include the somatotropic/lactotropic GH3 (rat) and GH4C1 (rat), corticotropic AtT20 (mouse), gonadotropic αT3 and αT4 (mouse), and presomatotropic GHFT1 (mouse) cell lines (10,15,16,17). In the present study, we have used targeted Tag expression in the mouse (10,17) in an attempt to further expand this set of investigational tools. Three new lines are reported. The principal characteristics of all three newly established pituitary cell lines (hormones produced, Pit-1 expression, presence of hGH locus) are summarized in Table 1. Two of these lines appear to represent well-defined steps in anterior pituitary development. The first correlates with the precursor of the Pit-1-dependent lineages (Pit1/0), in which Pit-1 is expressed, but the subsequent activation of hormone gene expression has not yet occurred. In the mouse, this would correlate with the development of the anterior pituitary at e12.5 and e13.5 (10). The second appears to represent the differentiated lactotrope (Pit1/Prl), in which Pit-1 and Prl are coexpressed in the absence of the other Pit-1-dependent hormones. Both of these lines carry the hGH/BAC transgene locus. Thus, in addition to their intrinsic value in representing defined stages in mouse pituitary development, they may be of significant utility in the analysis of hGH locus activation and/or repression in course of embryonic pituitary development. The Pit1/0 cell line represents a very early stage of somatotropic development when Pit-1 is already activated but expression of GH is not yet observed. In the case of the lactotrope line (Pit1/Prl), we assume that the hGH locus was likely to have been activated at some intermediate stage (somatolatotrope) and then subsequently silenced during the terminal lactotrope differentiation stage. Thus, the use of both lines in chromatin immunoprecipitation experiments would allow a direct comparison of preactivated and silenced chromatin structures of the hGH locus. Furthermore, it may also be possible in the future to reverse the Tag developmental blockade in the Pit1/0 cells and follow the subsequent activation of the hGH locus.
Table 1.
Characteristics of newly established cell lines
| Cell line | Hormones expressed | PIT-1 expressed | Presence of the hGH locus |
|---|---|---|---|
| Pit1/0 | None | Yes | Present |
| Pit1/Prl | PRL | Yes | Present |
| Pit1/Triple | GH, TSHβ/αGSU, PRL | Yes | Absent |
The third line, Pit1/Triple, may be of particular interest. In this case, the Pit-Tag transformation has captured a cell that expresses Pit-1 and all three of the Pit-1-dependent hormones: GH, Prl, and TSHβ/αGSU. This result points to the existence of an intermediate tri-potent precursor stage that can eventually give rise to somatotropes, lactotropes, and thyrotropes. Consistent with this model, the expression of all three of these hormone genes is dependent on the continued expression of Pit-1 (Fig. 5). The data further revealed that GH expression was more sensitive than Prl or TSHβ to the Pit-1 depletion. Whether this latter observation reflects difference(s) in the kinetics of gene expression or the stability of the corresponding mRNAs was not addressed in this study. Although the existence of somatolactotropes is well established in the adult pituitary, the existence of a cell line expressing all three Pit-1 hormones has not been previously reported.
The isolation of the Pit1/Triple line raises the question of whether tri-positive cells exist in vivo. The only indication that this may be the case is a set of human monomorphous plurihormonal pituitary adenomas (18,19,20). These tumors occur postnatally and as such presumably occur long after full differentiation of anterior pituitary. This tumor phenotype could reflect transformation-mediated dedifferentiation (17), or alternatively, it could represent expansion of a pluripotent pituitary stem cell precursor. Consistent with the second possibility is the recent report of a small (<0.05%) population of multipotent progenitor/stem cells in the adult mouse pituitary. Such pluripotent stem cells could play a role in maintaining the plasticity and regenerative capacity of the pituitary necessary to expand the Pit-1 lineage to meet physiologic needs (21). Recently, it was shown that adult stem cells are present in the periluminal region of the mature anterior pituitary (22). These cells are able to generate all of the terminally differentiated endocrine cell types of the pituitary gland. Taken together, these observations suggest that the Pit1/Triple cells may represent a unique cell precursor of the somato-lacto-thyrotrope lineage.
A number of recent publications (summarized in Ref. 1) have proposed molecular mechanisms underlying anterior pituitary organogenesis. The αGSU, arising at e8.5 in mouse, is the first hormone subunit to be expressed during pituitary development. The transcription factor Prop-1 becomes detectable at e10.5, spikes at e12.5, activates expression of Pit-1, and then markedly declines by e14. Pit-1 protein expression can be detected as early as e13.5 in mouse and continues in somatotropes, lactotropes, and thyrotropes throughout adult life (1). Thyrotropes and gonadotropes, both arising from the ventral portion of the rodent pituitary, share a common feature of secreting heterodimeric hormones comprising a common subunit (αGSU) and lineage-specific β-subunits (TSHβ, LHβ, and FSHβ, respectively). These two cell types retain some plasticity and can interconvert under specific experimental conditions. For example, gonadotropes can be converted into thyrotropes by ectopic expression of the Pit-1 gene placed under control of αGSU regulatory sequences (23). Because gonadotropes diverge from the main pathway of anterior pituitary differentiation before Pit-1 activation and before the establishment of somato-lacto-thyrotrope lineages, the presence of the αGSU subunit in the Pit1/Triple lines is consistent with the presence of the TSHβ. The coexpression of TSHβ, αGSU, GH, and Prl supports a model in which the Pit1/0 line represents a pivotal multipotential intermediate in pituitary cell differentiation.
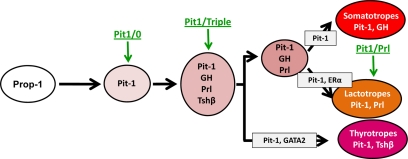
A modified pathway of gene activation during pituitary differentiation is shown in Fig. 8. This model indicates the proposed positions represented by the three new cell lines. The position of the Pit1/0 is likely to be the same as the widely studied GHFT1 cells. Although the latter is often referred to in the literature as a “presomatotrope” (10), it may be more accurate to recognize that it represents the common precursor to all three Pit-1 dependent lineages. The Pit1/Triple cell line may represent an intermediate, in which Pit-1 has activated all three hormones. This would occur before alterations in gene expression that eventuate in the generation of the final differentiated cell types. The expression patterns of the Pit1/Prl cells are most consistent with the mature lactotrope. Thus, the three newly established cell lines occupy positions at the initial, intermediate, and terminal stages of anterior pituitary development. They have all been generated in parallel from mice with similar genetic backgrounds further facilitating their comparison. Finally, two of these lines carry an intact and extensive hGH locus transgene and as such may serve as useful reagents for subsequent studies.
Figure 8.
The three new Tag-transformed pituitary cell lines occupy distinct positions in the pathway of pituitary cell differentiation. Expression of Prop-1, an initial step to the establishment of all somatotropes, lactotropes, and thyrotropes, is followed in 1–2 d by expression of Pit-1. Cells expressing Pit-1 in the absence of GH, Prl, or Tshβ are considered to be the immediate precursors of the somato-lacto-thyrotrope lineage and are represented by the Pit1/0 cell line. Pit-1 subsequently activates the differentiation of the somatotrope-lactotrope-thyrotrope lineages. We hypothesize that the Pit1/Triple line, which expresses all three Pit-1-dependent hormones (GH, Prl, and TSHβ), represents the initial step in this pathway. The thyrotrope lineage then diverges from the somatolactotropes that subsequently gives rise to fully differentiated somatotropes and lactotropes. The third line, Pit1/Prl, appears to represent the differentiated lactotrope.
Materials and Methods
Production of transgenic mice
The Pit-Tag transgene was kindly provided by Pamela Mellon (10). The GH-Tag transgene was produced by placing the same SV40 Tag ORF under control of the hGH-N minimal promoter and HSI LCR component (“F14” fragment) (7,24). Both transgenes were released from carrier vectors (SalI for Pit-Tag and BssHII for GH-Tag), and the transgene segment was gel-isolated and purified through Elutip columns (Whatman, Kent, UK) before injection. Fertilized one-cell mouse embryos used for injection were generated by mating CD1 females with males heterozygous for the 123-kb hGH/BAC transgene (13). Microinjection of purified DNA (2 ng/μl) followed by reimplantation of the resulting embryos into pseudopregnant CD1 females was performed by University of Pennsylvania Transgenic Mouse Core. PCR genotyping of genomic DNA extracted from mouse tail tips used the following primer sets:
Primers 5′-CCTCAGTCCTCACAGTCTGT-3′ (direct) and 5′-GCTAGGAGTAGCTATTGACC-3′ (reverse) detected Tag sequences (Pit-Tag or GH-Tag transgenes);
Primers 5′-TTTGACAACGCTATGCTCCG-3′ (direct) and 5′-GGATGAGCAGCAGGGAGATG-3′(reverse) identified the hGH-N/BAC transgene.
Establishment of pituitary cell lines
Tag positive mice were weighed weekly with comparisons with nontransgenic littermates. Development of pituitary tumors was consistently indicated by an abrupt drop-off in the weight curve (see example in Fig. 2). The affected mice were killed by cervical dislocation, and the pituitary tumors were removed, incubated for 30 min at 37 C in cell disrupting solution [10 mg/ml of collagenase P (Roche, Indianapolis, IN) and 20 U DNase I (Invitrogen, Carlsbad, CA) in 1× PBS (GIBCO, Freiburg, Germany)]. Cells were dispersed by pipetting and plated in DMEM fetal bovine serum (FBS) enriched medium [DMEM (GIBCO) supplemented with 15% of FBS (GemCell), 1% nonessential amino acids solution (GIBCO), and 1% antibiotic-antimycotic solution (GIBCO)]. Cells were monitored daily, and the establishment of each particular cell line required an individualized approach. In general, the cells were periodically transferred at confluence to new dishes and/or split 1:5 (depending on each particular tumor) until a cell population of uniform morphology and stable growth rate was formed. At the end of a 2- to 3-month period, the established cell lines were assayed for marker expression. Each of the three final lines was stored in liquid nitrogen in 90% FBS/10% dimethyl sulfoxide and could be subsequently thawed with excellent viability.
Cell transfection and RNA analysis
Pit-1 siRNA (Dharmacon, Lafayette, CO) was transfected into Pit1/Triple cells following the manufacturer’s protocol (Accell siRNAs). For RT-PCR assays, total RNA from cell lines and tissues was extracted using RNA-Bee solution (Tel-test), treated with DNase I (Invitrogen), and random primed to generate a cDNA pool. Resulting cDNA was used in a standard PCR assay (annealing temperature = 55 C for all primers used) to detect the mRNAs of interest. Primers designed and used for this purpose were as follows:
Tag, 5′-CAGAGAGGAATCTTTGCAGC-3′ and 5′-TGTTGAGAGTCAGCAGTAGC-3′; Pit-1, 5′-ACAAGTTTCCAGACCACACC-3′ and 5′-TCTTCCTTTCGTTTGCTCCC-3′; mouse GH (mGH), 5′-CATCCTAGAGTCCAGATTCC-3′ and 5′-CTTCAAGAAGGACCTGCACA-3′; Prl, 5′-TTTCTCACTACATCCATACCC-3′ and 5′-TGTCAACCTTGTGGGAATGC-3′; Tshβ, 5′-TACTGCCTGACCATCAACAC-3′ and 5′-TTCTGACAGCCTCGTGTATG-3′; Fshβ, 5′-AATCTGCTGCCATAGCTGTG-3′ and 5′-TCCCTCTAGACTCATGCATG-3′; LHβ, 5′-ATCAAGAATGGAGAGGCTCC-3′ and 5′-ACAGGCCATTGGTTGAGTCC-3′; β-actin, 5′-AGAGCAAGAGAGGTATCCTG-3′ and 5′-GCAACATAGCACAGCTTCTC-; hGH, 5′-TTTGACAACGCTATGCTCCG-3′ and 5′-CGTAGTTCTTGAGTAGTGCG-3′; and CD79b, 5′-ACACGTTTTCCTCCAAGGAG-3′ and 5′-CATTGTCCTCAAACCGGATG-3′.
For quantitative RNA analysis, DNase I-treated RNA was converted into cDNA using a High Capacity cDNA Reverse Transcription kit (Applied Biosystems, Foster City, CA) and levels of Pit-1, mGH, Prl, and Tshβ mRNAs were assessed by real-time PCR (TaqMan) and normalized to the corresponding levels in the Pit1/Triple cell line (defined as 1.0) where all four RNAs were detected. The following TaqMan assay mixtures were used: Mm00476852_m1 (Pit-1 assay), Mm00433590_g1 (mGH assay), Mm00599949_m1 (Prl assay), Mm00437190_ m1 (Tshβ assay), mouse glyceraldehyde-3-phosphate dehydrogenase endogenous control assay, and TaqMan Universal PCR Master mix (Applied Biosystems). Real-time PCRs were carried on a 7900HT machine, and the resulting data treated using SDS 2.2 software.
Protein analysis (Western blot analysis and immunofluorescence)
Western blot analyses were performed following the standard protocol using Pit-1 antibodies N-20 (Santa Cruz Biotechnology, Inc., Santa Cruz, CA) and L-7 antibodies (25) for controls.
Immunofluorescent staining
Cells were collected and placed on poly-lysine coated slides. The cells were fixed in 4% formaldehyde in PBS and permeabilized in 0.5% saponin and 0.5% Triton X-100 in PBS. The cells were blocked in 4× sodium saline citrate (SSC), 2% BSA, and 0.1% Tween 20. The GH, Prl, and TSHβ were detected using antibodies specific for these hormones (National Hormone and Peptide Program, National Institutes of Health). The primary antibodies were used at a 1:2000 dilution. The slides were incubated with primary antibodies for 2 h at room temperature, washed with 4× SSC, 0.1% Triton X-100, and incubated with secondary antibodies. The secondary antibodies were Cy2 or Cy3-conjugated donkey antirabbit IgG, detecting Prl or TSHβ, or Cy3-conjugated donkey antihuman IgG, detecting GH (Jackson ImmunoResearch, West Grove, PA). After washing with 4× SSC, 0.1% Triton X-100, the cells mounted with Fluorescent Mounting Medium (KPL, Gaithersburg, MD) and visualized by confocal microscopy (Leica TCS SP; Leica, Wetzlar Germany) and Olympus 1 × 70 inverted microscopy (Olympus America, Inc., Melville, NY).
Acknowledgments
We thank Dr. Pamela Mellon for providing the pGHFT plasmid carrying Pit1-Tag transgene and the GHFT1 cell line, the University of Pennsylvania Transgenic and Chimeric Mouse Facility for generation of the transgene mice, and Dr. Richard Carroll and the University of Pennsylvania Cell Culture Core for valuable advice in the generation of primary cell lines in the initial phases of this study.
Footnotes
This work was supported by National Institutes of Health Grants R01 HD25147 and R01 HD046737 (to N.E.C. and S.A.L.).
Disclosure Summary: The authors have nothing to disclose.
First Published Online September 9, 2010
Abbreviations: BAC, Bacterial artificial chromosome; DNase, deoxyribonuclease; e, embryonic day; ER, estrogen receptor; FBS, fetal bovine serum; αGSU, glycoprotein hormone α-subunit; hGH, human GH; HSI, hypersensitive site I; LCR, locus control region; mGH, mouse GH; ORF, open reading frame; Pit, pituitary-specific transcription factor; Prl, prolactin; Prop-1, prophet of Pit-1; siRNA, small interfering RNA; SSC, sodium saline citrate; Tag, T-antigen.
References
- Zhu X, Gleiberman AS, Rosenfeld MG 2007 Molecular physiology of pituitary development: signaling and transcriptional networks. Physiol Rev 87:933–963 [DOI] [PubMed] [Google Scholar]
- Ingraham HA, Chen RP, Mangalam HJ, Elsholtz HP, Flynn SE, Lin CR, Simmons DM, Swanson L, Rosenfeld MG 1988 A tissue-specific transcription factor containing a homeodomain specifies a pituitary phenotype. Cell 55:519–529 [DOI] [PubMed] [Google Scholar]
- Chen RP, Ingraham HA, Treacy MN, Albert VR, Wilson L, Rosenfeld MG 1990 Autoregulation of pit-1 gene expression mediated by two cis-active promoter elements. Nature 346:583–586 [DOI] [PubMed] [Google Scholar]
- Nelson C, Albert VR, Elsholtz HP, Lu LI, Rosenfeld MG 1988 Activation of cell-specific expression of rat growth hormone and prolactin genes by a common transcription factor. Science 239:1400–1405 [DOI] [PubMed] [Google Scholar]
- Steinfelder HJ, Hauser P, Nakayama Y, Radovick S, McClaskey JH, Taylor T, Weintraub BD, Wondisford FE 1991 Thyrotropin-releasing hormone regulation of human TSHB expression: role of a pituitary-specific transcription factor (Pit-1/GHF-1) and potential interaction with a thyroid hormone-inhibitory element. Proc Natl Acad Sci USA 88:3130–3134 [DOI] [PMC free article] [PubMed] [Google Scholar]
- Jones BK, Monks BR, Liebhaber SA, Cooke NE 1995 The human growth hormone gene is regulated by a multicomponent locus control region. Mol Cell Biol 15:7010–7021 [DOI] [PMC free article] [PubMed] [Google Scholar]
- Shewchuk BM, Asa SL, Cooke NE, Liebhaber SA 1999 Pit-1 binding sites at the somatotrope-specific DNase I hypersensitive sites I, II of the human growth hormone locus control region are essential for in vivo hGH-N gene activation. J Biol Chem 274:35725–35733 [DOI] [PubMed] [Google Scholar]
- Li S, Crenshaw 3rd EB, Rawson EJ, Simmons DM, Swanson LW, Rosenfeld MG 1990 Dwarf locus mutants lacking three pituitary cell types result from mutations in the POU-domain gene pit-1. Nature 347:528–533 [DOI] [PubMed] [Google Scholar]
- Cohen L, Radovick S 2002 Molecular basis of combined pituitary hormone deficiencies. Endocrinol Rev 23:431–442 [DOI] [PubMed] [Google Scholar]
- Lew D, Brady H, Klausing K, Yaginuma K, Theill LE, Stauber C, Karin M, Mellon PL 1993 GHF-1-promoter-targeted immortalization of a somatotropic progenitor cell results in dwarfism in transgenic mice. Genes Dev 7:683–693 [DOI] [PubMed] [Google Scholar]
- Su Y, Liebhaber SA, Cooke NE 2000 The human growth hormone gene cluster locus control region supports position-independent pituitary- and placenta-specific expression in the transgenic mouse. J Biol Chem 275:7902–7909 [DOI] [PubMed] [Google Scholar]
- Elefant F, Su Y, Liebhaber SA, Cooke NE 2000 Patterns of histone acetylation suggest dual pathways for gene activation by a bifunctional locus control region. EMBO J 19:6814–6822 [DOI] [PMC free article] [PubMed] [Google Scholar]
- Kimura AP, Sizova D, Handwerger S, Cooke NE, Liebhaber SA 2007 Epigenetic activation of the human growth hormone gene cluster during placental cytotrophoblast differentiation. Mol Cell Biol 27:6555–6568 [DOI] [PMC free article] [PubMed] [Google Scholar]
- Efrat S, Linde S, Kofod H, Spector D, Delannoy M, Grant S, Hanahan D, Baekkeskov S 1988 β-Cell lines derived from transgenic mice expressing a hybrid insulin gene oncogene. Proc Natl Acad Sci USA 85:9037–9041 [DOI] [PMC free article] [PubMed] [Google Scholar]
- Tashjian Jr AH, Yasumura Y, Levine L, Sato GH, Parker ML 1968 Establishment of clonal strains of rat pituitary tumor cells that secrete growth hormone. Endocrinology 82:342–352 [DOI] [PubMed] [Google Scholar]
- Nakamura M, Nakanishi S, Sueoka S, Imura H, Numa S 1978 Effects of steroid hormones on level of corticotropin messenger RNA activity in cultured mouse pituitary tumor cells. Eur J Biochem 86:61–66 [DOI] [PubMed] [Google Scholar]
- Windle JJ, Weiner RI, Mellon PL 1990 Cell lines of the pituitary gonadotrope lineage derived by targeted oncogenesis in transgenic mice. Mol Endocrinol 4:597–603 [DOI] [PubMed] [Google Scholar]
- Thapar K, Kovaks K, Laws ER 1995 The classification and molecular biology of pituitary adenomas. Adv Tech Stand Neurosurg 22:3–53 [DOI] [PubMed] [Google Scholar]
- Sanno N, Teramoto A, Matsuno A, Inada K, Itoh J, Osamura RY 1994 Clinical and immunohistochemical studies on TSH-secreting pituitary adenoma: its multihormonality and expression of Pit-1. Mol Pathol 7:893–899 [PubMed] [Google Scholar]
- Horvath E, Lloyd RV, Kovacs K 1990 Propylthiouracyl-induced hypothyroidism results in reversible transdifferentiation of somatotrophs into thyroidectomy cells. A morphologic study of the rat pituitary including immunoelectron microscopy. Lab Invest 63:511–520 [PubMed] [Google Scholar]
- Fauquier T, Karine Rizzoti K, Dattani M, Lovell-Badge R, Robinson IC 2008 SOX2-expressing progenitor cells generate all of the major cell types in the adult mouse pituitary gland. Proc Natl Acad Sci USA 105:2907–2912 [DOI] [PMC free article] [PubMed] [Google Scholar]
- Gleiberman AS, Michurina T, Encinas JM, Roig JL, Krasnov P, Balordi F, Fishell G, Rosenfeld MG, Enikolopov G 2008 Genetic approaches identify adult pituitary stem cells. Proc Natl Acad Sci USA 105:6332–6337 [DOI] [PMC free article] [PubMed] [Google Scholar]
- Dasen JS, O'Connell SM, Flynn SE, Treier M, Gleiberman AS, Szeto DP, Hooshmand F, Aggarwal AK, Rosenfeld MG 1999 Reciprocal interactions of Pit1 and GATA2 mediate signaling gradient-induced determination of pituitary cell types. Cell 97:587–598 [DOI] [PubMed] [Google Scholar]
- Shewchuk BM, Liebhaber SA, Cooke NE 2002 Specification of unique Pit-1 activity in the hGH locus control region. Proc Natl Acad Sci USA 99:11784–11789 [DOI] [PMC free article] [PubMed] [Google Scholar]
- Ji X, Kong J, Liebhaber SA 2003 In vivo association of the stability control protein αCP with actively translating mRNAs. Mol Cell Biol 23:899–907 [DOI] [PMC free article] [PubMed] [Google Scholar]


