Abstract
We examined CD8+ T-cell expansion and function following intramuscular immunization with a recombinant adenovirus. This study has identified a number of properties which may explain the strong immunogenicity of adenovirus vectors: (i) the ability to deliver large amounts of antigen into the lymphoid tissues, (ii) the ability to induce rapid expansion and migration of CD8+ T cells throughout the lymphatics, and (iii) the ability to produce a sustained, high-level CD8+ T-cell response.
Adenovirus (Ad) vectors have proven to be highly efficacious vaccine carriers in both murine and primate models (2, 8, 17-20). Although the ability of Ad vectors to elicit antigen-specific CD8+ and CD4+ T cells is well described, little is known about the kinetics or nature of the immune response following Ad immunization (12, 21, 22). The aim of the present study was to examine the kinetics of the antitransgene CD8+ T-cell response following Ad immunization and characterize the relationship between CD8+ T-cell activation and transgene expression. To this end, mice were immunized with an Ad expressing a model antigen, termed SIINFEKL-Luc, where the SIINFEKL epitope from chicken egg ovalbumin was added to the N terminus of firefly luciferase. This modified version of luciferase provides a sensitive measurement of gene expression in vivo along with a well-described CD8+ T-cell epitope for tracking the CD8+ T-cell response. The SIINFEKL-Luc cDNA was inserted into the E1 region of an Ad with a deletion of E1 and E3 under the control of the murine cytomegalovirus promoter using a recently developed, high-efficiency system for virus rescue (16).
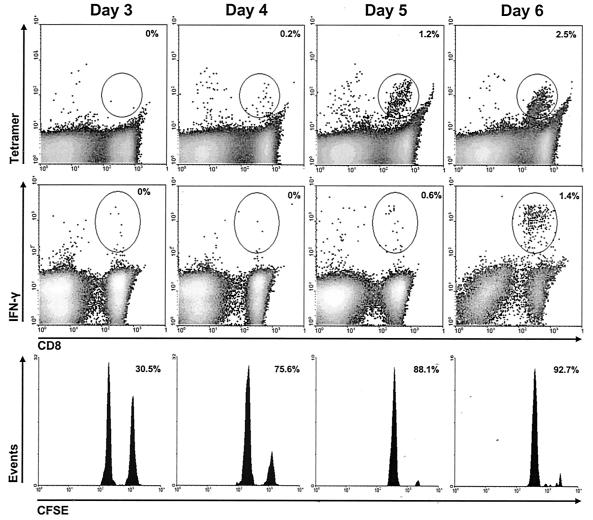
Most reports of CD8+ T-cell-dependent immunity produced by Ad vectors employed 51Cr-release cytotoxicity assays. Unfortunately, these assays do not provide a quantitative measure of the CD8+ T-cell population, and preferential outgrowth during the restimulation period may overestimate differences between two CD8+ T-cell populations. We have employed Kb/SIINFEKL tetramers (prepared at the Trudeau Institute, Sarnac Lake, N.Y.) to directly enumerate peptide-specific T cells as described in reference 7. Additionally, gamma interferon (IFN-γ) production by antigen-specific CD8+ T-cell populations was measured by stimulating lymphocytes directly ex vivo with SIINFEKL followed by intracellular staining for IFN-γ using the Cytofix/Cytoperm kit (BD Pharmingen) as described previously (10). Finally, cytotoxic function was monitored using the in vivo cytotoxic T-lymphocyte (CTL) assay, where naive lymphocytes were coated with either SIINFEKL (specific peptide) or KAVYNFATM (irrelevant peptide) and labeled with 5 and 0.5 uM CFSE (Molecular Probes), respectively, permitting the distinction between antigen-specific and antigen-nonspecific targets by flow cytometry. The two target cell populations were mixed at a 1:1 ratio and injected intravenously into mice. Four hours later, lymphocytes were isolated from lymphoid tissues and the presence of CFSE-labeled target cells was determined by flow cytometry. Specific lysis was determined using the calculation described by Coles et al. (6). An example of the results from these assays is provided in Fig. 1, and the results are summarized in Fig. 2 and 4. This research has complied with all relevant guidelines and institutional policies.
FIG. 1.
Analysis of effector function within ileac lymph nodes at early times postimmunization. Cells were obtained from the regional lymph nodes 3 to 6 days following intramuscular immunization with 108 PFU of AdSIINFEKL-Luc. Upper panels, cells were stained directly with tetramer, and the number in the upper-right corner of each tetramer plot is the frequency of SIINFEKL-reactive CD8+ T cells (determined using the gate shown)/total CD8+ cells in the experimental group minus the frequency of SIINFEKL-reactive CD8+ T cells/total CD8+ cells in naïve controls; Middle panels, cells were immediately restimulated with SIINFEKL or KAVYNFATM peptide for intracellular cytokine staining, and the number in the upper-right corner is the frequency of IFN-γ-producing CD8+ T cells (determined using the gate shown)/total CD8+ following stimulation with SIINFEKL minus the frequency of IFN-γ-producing CD8+ T cells/total CD8+ cells following stimulation with KAVYNFATM; Lower panels, CFSE-labeled target cells were adoptively transferred into immunized recipient for in vivo CTL 4 h prior to harvesting tissues, and the number in the upper-right corner represents the percent specific lysis relative to naive controls. These histograms and density plots are representative of five mice, and the calculated values in all panels represent the means for the five mice.
FIG. 2.
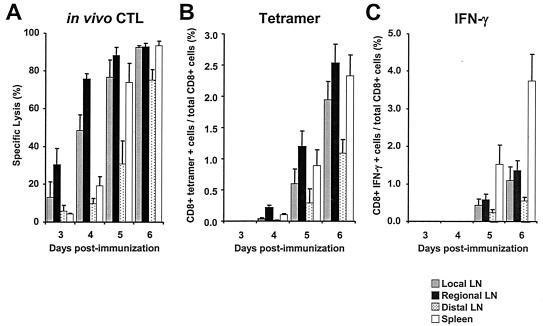
Analysis of effector function within lymph nodes and spleens at early times postimmunization. Cells were obtained from local, regional, and distal lymph nodes and spleens 3 to 6 days following intramuscular immunization with 108 PFU of AdSIINFEKL-Luc. On the day of each harvest, CFSE-labeled target cells were adoptively transferred into mice for the in vivo CTL assay, and tissues were harvested 4 h later. (A) In vivo CTL assay; (B) tetramer analysis with Kb/SIINFEKL; (C) intracellular cytokine stain analysis for IFN-γ after 5 h of peptide stimulation ex vivo. Each histogram represents the mean ± standard error of the mean for five mice.
FIG. 4.
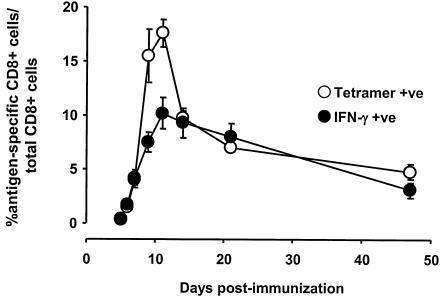
Expansion of SIINFEKL-specific CD8+ T cells following immunization with AdSIINFEKL-Luc. Cells were obtained from spleens 3 to 47 days following intramuscular immunization with 108 PFU of AdSIINFEKL-Luc and stained directly with Kb/SIINFEKL tetramer and anti-CD8 (tetramer +ve) or restimulated with SIINFEKL peptide for intracellular cytokine staining (IFN-γ +ve). Each point represents the mean ± standard error of the mean for five to eight mice from two to three experiments.
In the following experiments, C57Bl/6 mice (Charles River Breeding Laboratories) were immunized with 108 PFU of AdSIINFEKL-Luc by intramuscular injection. Immune reactivity was measured within both the lymph nodes (LNs) and the spleen. The LNs were separated into the following groups based on their relative distance from the injection site: (i) local (popliteal and inguinal), (ii) regional (ileac), and (iii) distal (axial and brachial).
The earliest evidence of CD8+ T-cell activation came from the in vivo cytotoxicity assays. A 4-h assay period was chosen to minimize the migration of the effectors and target cells within the lymphatic system. Antigen-specific cytotoxicity was observed within all LNs that we investigated as early as 3 days following immunization (Fig. 2A). The greatest cytolytic activity was measured in the regional LN (30.5% ± 8.7%), followed by the local LN (13.3% ± 8.1%), distal LN (5.8% ± 3.0%), and spleen (4.2% ± 0.5%). Cytotoxic activity continued to increase in all sites over the course of the experiment, but the activity in the regional LN was always greatest. By day 6, the cytotoxic activity in the regional LN, local LN, and spleen was almost 100%, but the lytic activity in the distal LN at day 6 was only 75%. These results suggest that CTL develop initially within the local and distal LN, since the lytic activity in those sites at days 3 and 4 was two- to threefold greater than the lytic activity in the spleen and distal LN. However, we cannot exclude the possibility that differential migration of the target cells to these sites may influence the observed CTL activity.
By 4 days following immunization, tetramer-positive CD8+ cells were measurable in the regional LN and spleen (0.2% and 0.1%, respectively) (Fig. 2B). These results are somewhat discordant with the findings of the in vivo cytotoxicity assay, since the specific lysis in the local LN was 48.4% ± 8.2% at day 4 compared to 19.2% ± 4.9% in the spleen, yet greater numbers of tetramer-positive cells were found in the spleen than in the local LN (Fig. 2A and B). While these results cannot be explained at this time, they may reflect a limitation in the tetramer-staining method when measuring low frequencies. By day 5, tetramer-positive cells were measurable in all sites, and the frequencies of tetramer-positive cells in the local LN and spleen (0.6% ± 0.2% and 0.9% ± 0.3%, respectively) were consistent with the levels of cytolytic activity (76.6% ± 9.2% and 73.3% ± 10.2%, respectively). The frequencies of tetramer-positive CD8+ T cells within the local LN, regional LN, and spleen were comparable on days 5 and 6; however, as in the case of cytotoxic activity, the presence of tetramer-positive cells within the distal LN lagged behind that in the other nodes. The discrepancy between cytotoxicity and tetramer analyses likely reflects the difference in sensitivity between the two assays, where the in vivo cytotoxicity assay provides greater sensitivity. We interpret these data to suggest that antigen-specific CD8+ T cells are first activated in the draining LNs and then migrate to other LNs and the spleen. These observations are consistent with those from previous studies of herpes simplex virus (HSV) infection, where the frequency of tetramer-positive cells within the draining LN and spleen expanded at similar rates but cytotoxicity was apparent in the LN before the spleen (6). Interestingly, antigen-specific CD8+ T cells were not measurable in the distal LN by either assay following HSV infection, suggesting that the migration of CD8+ T-cell effectors elicited by HSV may be different from the effectors elicited by Ad. Another notable difference between HSV and Ad is that the HSV doesn't appear to express antigen in the draining lymph nodes (11), whereas the Ad vectors do (5).
IFN-γ-producing CD8+ T cells were not found in any lymph nodes until 5 days after immunization, 24 h following the appearance of tetramer-positive CD8 T cells (Fig. 2C). This 24-hour delay likely reflects the time required for newly activated T cells to prepare their intracellular machinery for cytokine production. At day 6 following immunization, the fractions of IFN-γ-producing CD8+ T cells within regional, local, and distal LN were 1.4% ± 0.3%, 1.1% ± 0.4%, and 0.6% ± 0.1%, respectively, comparable to the frequencies of tetramer-positive cells in the same sites on day 5 (1.2% ± 0.2%, 0.6% ± 0.2%, and 0.3% ± 0.2%, respectively) (Fig. 2B and C). By contrast, the frequency of IFN-γ-secreting CD8+ T cells matched closely to the frequency of tetramer-positive CD8+ T cells in the spleen at both days 5 and 6. At day 5, 0.9% ± 0.3% of CD8+ T cells in the spleen were tetramer positive, and 1.5% ± 0.5% secreted IFN-γ in response to ex vivo stimulation. Likewise, at day 6, 2.3% ± 0.3% of the CD8+ T cells in the spleen were tetramer positive, and 3.7% ± 0.7% secreted IFN-γ in response to ex vivo stimulation. These results suggest that the CD8+ T-cell population in the spleen represents fully differentiated effectors, while the population in the lymph nodes represents CD8+ T cells at earlier stages of differentiation.
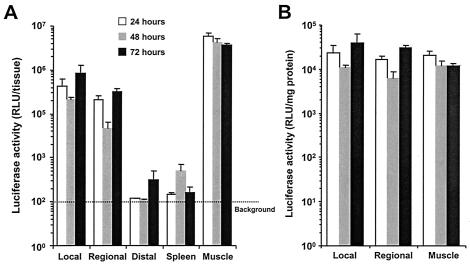
To determine the relationship between antigen expression and T-cell activation, muscle tissue, lymph nodes, and spleen were collected 24, 48, and 72 h following immunization and homogenized in cell culture lysis reagent (Promega). Luciferase activity was measured in cleared homogenates using the luciferase assay kit (Promega). As expected, the highest levels of total luciferase activity were found in the muscle tissue throughout the examination period (Fig. 3A). High levels of gene expression also were measured within the local and regional LN, although these levels were 10- to 50-fold lower than the levels in the muscle. When the luciferase activity in the local and regional LNs was normalized to the amount of protein in the homogenates (determined using the Bio-Rad DC protein assay) to account for differences in tissue size, the luciferase activity in the LN, in relation to the amount of tissue, was identical to that in the muscle (Fig. 3B). Little gene expression (less than 10-fold above background levels) was detectable in the distal nodes and the spleen. A recent publication demonstrated that the efficacy of plasmid DNA vaccines was increased by 100-fold over that of intramuscular injection when they were injected directly into the LN (14). Thus, the robust activity of the Ad vaccine may be related to the ability of this vector to directly deliver its payload into the LNs.
FIG. 3.
Gene expression in vivo following intramuscular injection of AdSIINFEKL-Luc. Muscles, lymph nodes, and spleens were harvested 24 (open bars), 48 (grey bars), and 72 h (closed bars) following intramuscular injection with 108 PFU of AdSIINFEKL-Luc. Three groups of lymph nodes were harvested: local lymph nodes, regional lymph nodes, and distal lymph nodes. Luciferase activity was measured in tissue homogenates. (A) Luciferase activity per tissue. (B) Luciferase activity per tissue normalized to the amount of protein in the homogenate. Each histogram represents the mean [plusmn] standard error the mean for three to six samples.
To assess the durability of the CD8+ T-cell response following Ad immunization, the frequency of antigen-specific CD8+ T cells in the spleen was assessed over a period of 47 days. Tetramer-positive CD8+ T cells accumulated rapidly in the spleen, reaching a maximum around 11 days postimmunization, where ∼20% of all CD8+ T cells in the spleen were tetramer positive (Fig. 4). By day 14, only half of the peak number of tetramer-positive CD8+ T cells remained in the spleen, consistent with the rapid contraction of the CD8+ T-cell response observed in other models. The rapid contraction phase was followed by a slower loss of cells, where 4.69% ± 0.65% of the CD8+ T-cell population was tetramer positive at day 47 compared to 9.3% ± 1.4% at day 14.
When IFN-γ production was employed to measure the frequency of SIINFEKL-reactive CD8+ T cells in the spleen, the picture was slightly different. Similar to tetramer results, the frequency of IFN-γ-producing CD8+ T cells in the spleen peaked around day 11. Unlike the tetramer-positive population, the IFN-γ-secreting population only contracted marginally from day 11 to day 14 (from 10.1% ± 1.4% to 9.3% ± 1.3%) and continued to wane slowly, leaving 3.4% ± 0.8% IFN-γ-secreting CD8+ T cells at day 47 (Fig. 4). Additionally, while the frequency of IFN-γ-secreting CD8+ T cells was consistent with the frequency of tetramer-positive CD8+ T cells throughout most of the analyses, at the peak of the response (days 9 and 11), the IFN-γ-secreting population was half of the tetramer-positive population (Fig. 4). The apparent discordance between IFN-γ and tetramer analyses at the peak time point may reflect either the presence of an antigen-specific, IFN-γ-negative population or an artifact of the tetramer staining. We are currently addressing this issue by investigating the expression of other cytokines (interleukin 2, interleukin 4, and tumor necrosis factor alpha) and combining intracellular cytokine staining techniques with tetramer staining.
The kinetics of CD8+ T-cell expansion and contraction observed following Ad immunization is somewhat distinct from observations using other infectious agents. Previous studies investigating a variety of agents (lymphocytic choriomeningitis virus, influenza, and Listeria monocytogenes) demonstrated that the CD8+ T-cell response in the spleen peaked sharply around day 7 followed by a dramatic contraction that reduced the population size by 80 to 90% at day 21 (3, 4, 6, 9, 15). While the tetramer-positive population did exhibit an abrupt contraction phase, where 50% of the cells were lost between days 11 and 14, the IFN-γ-secreting population was much more stable and exhibited little change between days 11 (10.1%) and 21 (8.4%). Similar stability of the CD8+ T-cell population measured by IFN-γ staining has been observed following HSV infection in the footpad (1, 13). Thus, the difference in contraction may simply reflect the impact of the immunization route, since the studies with lymphocytic choriomeningitis virus, influenza, and L. monocytogenes all employed the intraperitoneal route of delivery. We are currently investigating the impact of immunization route on the contraction of the CD8+ T-cell response.
These studies revealed a number of novel insights into the CD8+ T-cell response following the introduction of recombinant Ad vectors and should provide a useful benchmark for individuals studying antitransgene immunity elicited following Ad injection.
Acknowledgments
We thank Carole Evelegh for preparing the virus used in these experiments.
This work was funded by the Canadian Institutes of Health Research (MOP-42433 to J.B.) and, in part, by grants from the Hamilton Health Sciences Corporation and St. Joseph's Hospital. J.B. is supported by an Rx & D Health Research Foundation/CIHR Career Award in Health Research. Y.H.W. is a CIHR New Investigator. T.C.Y. is the recipient of an Ontario Graduate Studentship.
REFERENCES
- 1.Andersen, H., D. Dempsey, R. Chervenak, and S. R. Jennings. 2000. Expression of intracellular IFN-gamma in HSV-1-specific CD8+ T cells identifies distinct responding subpopulations during the primary response to infection. J. Immunol. 165:2101-2107. [DOI] [PubMed] [Google Scholar]
- 2.Babiuk, L. A., and S. K. Tikoo. 2000. Adenoviruses as vectors for delivering vaccines to mucosal surfaces. J. Biotechnol. 83:105-113. [DOI] [PMC free article] [PubMed] [Google Scholar]
- 3.Badovinac, V. P., B. B. Porter, and J. T. Harty. 2002. Programmed contraction of CD8(+) T cells after infection. Nat. Immunol. 3:619-626. [DOI] [PubMed] [Google Scholar]
- 4.Bertram, E. M., A. Tafuri, A. Shahinian, V. S. Chan, L. Hunziker, M. Recher, P. S. Ohashi, T. W. Mak, and T. H. Watts. 2002. Role of ICOS versus CD28 in antiviral immunity. Eur. J. Immunol. 32:3376-3385. [DOI] [PubMed] [Google Scholar]
- 5.Chan, S. Y., K. Li, J. R. Piccotti, M. C. Louie, T. A. Judge, L. A. Turka, E. J. Eichwald, and D. K. Bishop. 1999. Tissue-specific consequences of the anti-adenoviral immune response: implications for cardiac transplants. Nat. Med. 5:1143-1149. [DOI] [PubMed] [Google Scholar]
- 6.Coles, R. M., S. N. Mueller, W. R. Heath, F. R. Carbone, and A. G. Brooks. 2002. Progression of armed CTL from draining lymph node to spleen shortly after localized infection with herpes simplex virus 1. J. Immunol. 168:834-838. [DOI] [PubMed] [Google Scholar]
- 7.Dobrzanski, M. J., J. B. Reome, and R. W. Dutton. 2001. Role of effector cell-derived IL-4, IL-5, and perforin in early and late stages of type 2 CD8 effector cell-mediated tumor rejection. J. Immunol. 167:424-434. [DOI] [PubMed] [Google Scholar]
- 8.Gallichan, W. S., D. C. Johnson, F. L. Graham, and K. L. Rosenthal. 1993. Mucosal immunity and protection after intranasal immunization with recombinant adenovirus expressing herpes simplex virus glycoprotein B. J. Infect. Dis. 168:622-629. [DOI] [PubMed] [Google Scholar]
- 9.Harrington, L. E., R. Most Rv, J. L. Whitton, and R. Ahmed. 2002. Recombinant vaccinia virus-induced T-cell immunity: quantitation of the response to the virus vector and the foreign epitope. J. Virol. 76:3329-3337. [DOI] [PMC free article] [PubMed] [Google Scholar]
- 10.Hassett, D. E., M. K. Slifka, J. Zhang, and J. L. Whitton. 2000. Direct ex vivo kinetic and phenotypic analyses of CD8+ T-cell responses induced by DNA immunization. J. Virol. 74:8286-8291. [DOI] [PMC free article] [PubMed] [Google Scholar]
- 11.Jones, C. M., S. C. Cose, R. M. Coles, A. C. Winterhalter, A. G. Brooks, W. R. Heath, and F. R. Carbone. 2000. Herpes simplex virus type 1-specific cytotoxic T-lymphocyte arming occurs within lymph nodes draining the site of cutaneous infection. J. Virol. 74:2414-2419. [DOI] [PMC free article] [PubMed] [Google Scholar]
- 12.Jooss, K., H. C. Ertl, and J. M. Wilson. 1998. Cytotoxic T-lymphocyte target proteins and their major histocompatibility complex class I restriction in response to adenovirus vectors delivered to mouse liver. J. Virol. 72:2945-2954. [DOI] [PMC free article] [PubMed] [Google Scholar]
- 13.Kumaraguru, U., and B. T. Rouse. 2000. Application of the intracellular gamma interferon assay to recalculate the potency of CD8+ T-cell responses to herpes simplex virus. J. Virol. 74:5709-5711. [DOI] [PMC free article] [PubMed] [Google Scholar]
- 14.Maloy, K. J., I. Erdmann, V. Basch, S. Sierro, T. A. Kramps, R. M. Zinkernagel, S. Oehen, and T. M. Kundig. 2001. Intralymphatic immunization enhances DNA vaccination. Proc. Natl. Acad. Sci. USA 98:3299-3303. [DOI] [PMC free article] [PubMed] [Google Scholar]
- 15.Murali-Krishna, K., J. D. Altman, M. Suresh, D. J. Sourdive, A. J. Zajac, J. D. Miller, J. Slansky, and R. Ahmed. 1998. Counting antigen-specific CD8 T cells: a reevaluation of bystander activation during viral infection. Immunity 8:177-187. [DOI] [PubMed] [Google Scholar]
- 16.Ng, P., R. J. Parks, D. T. Cummings, C. M. Evelegh, and F. L. Graham. 2000. An enhanced system for construction of adenoviral vectors by the two-plasmid rescue method. Hum. Gene Ther. 11:693-699. [DOI] [PubMed] [Google Scholar]
- 17.Shi, Z., M. Zeng, G. Yang, F. Siegel, L. J. Cain, K. R. van Kampen, C. A. Elmets, and D. C. Tang. 2001. Protection against tetanus by needle-free inoculation of adenovirus-vectored nasal and epicutaneous vaccines. J. Virol. 75:11474-11482. [DOI] [PMC free article] [PubMed] [Google Scholar]
- 18.Shiver, J. W., T. M. Fu, L. Chen, D. R. Casimiro, M. E. Davies, R. K. Evans, Z. Q. Zhang, A. J. Simon, W. L. Trigona, S. A. Dubey, L. Huang, V. A. Harris, R. S. Long, X. Liang, L. Handt, W. A. Schleif, L. Zhu, D. C. Freed, N. V. Persaud, L. Guan, K. S. Punt, A. Tang, M. Chen, K. A. Wilson, K. B. Collins, G. J. Heidecker, V. R. Fernandez, H. C. Perry, J. G. Joyce, K. M. Grimm, J. C. Cook, P. M. Keller, D. S. Kresock, H. Mach, R. D. Troutman, L. A. Isopi, D. M. Williams, Z. Xu, K. E. Bohannon, D. B. Volkin, D. C. Montefiori, A. Miura, G. R. Krivulka, M. A. Lifton, M. J. Kuroda, J. E. Schmitz, N. L. Letvin, M. J. Caulfield, A. J. Bett, R. Youil, D. C. Kaslow, and E. A. Emini. 2002. Replication-incompetent adenoviral vaccine vector elicits effective anti-immunodeficiency-virus immunity. Nature 415:331-335. [DOI] [PubMed] [Google Scholar]
- 19.Sullivan, N. J., T. W. Geisbert, J. B. Geisbert, L. Xu, Z. Y. Yang, M. Roederer, R. A. Koup, P. B. Jahrling, and G. J. Nabel. 2003. Accelerated vaccination for Ebola virus haemorrhagic fever in non-human primates. Nature 424:681-684. [DOI] [PMC free article] [PubMed] [Google Scholar]
- 20.Sullivan, N. J., A. Sanchez, P. E. Rollin, Z. Y. Yang, and G. J. Nabel. 2000. Development of a preventive vaccine for Ebola virus infection in primates. Nature 408:605-609. [DOI] [PubMed] [Google Scholar]
- 21.Tripathy, S. K., H. B. Black, E. Goldwasser, and J. M. Leiden. 1996. Immune responses to transgene-encoded proteins limit the stability of gene expression after injection of replication-defective adenovirus vectors. Nat Med. 2:545-550. [DOI] [PubMed] [Google Scholar]
- 22.Yang, Y., Q. Su, and J. M. Wilson. 1996. Role of viral antigens in destructive cellular immune responses to adenovirus vector-transduced cells in mouse lungs. J. Virol. 70:7209-7212. [DOI] [PMC free article] [PubMed] [Google Scholar]


