Abstract
Two-dimensional homonuclear NMR was used to characterize synthetic DNA minor groove-binding ligands in complexes with oligonucleotides containing three different A-T binding sites. The three ligands studied have a C2 axis of symmetry and have the same general structural motif of a central para-substituted benzene ring flanked by two meta-substituted rings, giving the molecules a crescent shape. As with other ligands of this shape, specificity seems to arise from a tight fit in the narrow minor groove of the preferred A-T-rich sequences. We found that these ligands slide between binding subsites, behavior attributed to the fact that all of the amide protons in the ligand backbone cannot hydrogen bond to the minor groove simultaneously.
INTRODUCTION
Small ligands, both natural and synthetic, that bind the minor groove of DNA have been studied extensively. Structural characterizations of complexes, including those with distamycin (1,2), netropsin (3,4), berenil (5,6) and Hoechst 33258 (7,8), have revealed several features these ligands share and that seem necessary for them to bind effectively. These molecules are composed of linked aromatic rings and are thus basically planar, though some twist can be accommodated at the linkers. They also have a crescent shape with potential hydrogen bonding groups on the concave edge. The ligands bind in the minor groove parallel to the phosphate backbones with the concave side of the crescent facing towards the bottom of the groove. Their crescent shape is complementary to the natural curvature of the minor groove of B-DNA. This class of molecules has been shown to be generally selective for A-T-rich sites, with highest affinity for those that lack TpA steps. This selectivity is understood to be a result of the better van der Waals contact between the planar molecules and the walls of the groove in A-T sites, which tend to have more favorable, narrower minor grooves and a higher propeller twist adopted by the A-T pairs (9,10). In addition, the groove at A-T sites is deeper due to the absence of the G NH2, which protrudes into the minor groove at G-C base pairs. Ligand hydrogen bond donors, such as amide protons in linkers, increase affinity and specificity by forming hydrogen bonds with the O2 of thymines and N3 of adenines accessible within the minor groove. Ligands that have been designed with these structural features in mind have increased the affinity and selectivity of binding and allowed for recognition of G-C base pairs (11–14). These rationally designed ligands have consisted predominantly of imidazole and pyrrole polyamides and to date there has not been a systematic study of the use of other moieties in the design of DNA-binding ligands. Recently the task of designing a library of potential ligands with varying functional groups was undertaken by initially synthesizing benzene ring-containing molecules from readily available building blocks (15,16).
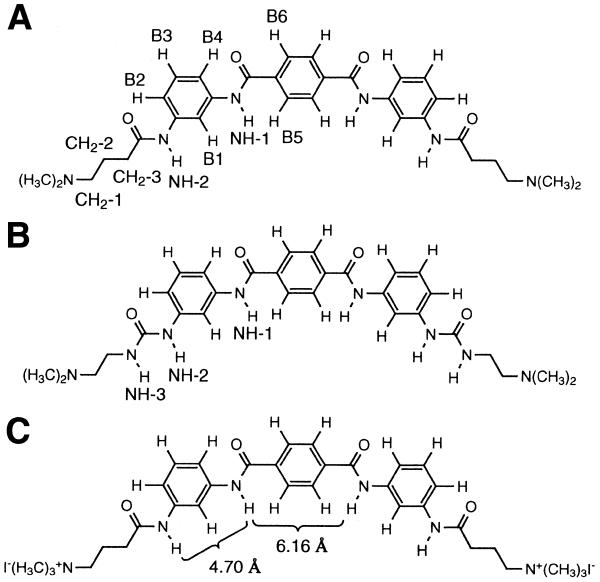
A series of symmetrical ligands containing three benzene rings was synthesized in which the central and flanking benzene rings were meta- or para-disubstituted (16). The flanking rings were substituted with either a dimethylaminopropyl group, attached by an amide bond, or with a dimethylaminoethyl group, attached via a urea bond. These moieties are henceforth referred to as the ligand ‘tails’. Two molecules from this prior study, shown in Figure 1A and B, had affinities for poly(dA•dT), as determined by ethidium displacement assays, that rivaled those of distamycin and Hoechst 33258. Both molecules have a para-disubstituted central ring and meta-disubstituted outer benzene rings (MPM motif), giving them a crescent shape. The ligands that either lacked the crescent shape or had to orient their carbonyl groups to the concave side of the molecule to adopt the proper crescent configuration had substantially lower affinities. Since there are no hydrogen bond donors in the minor groove at A-T sites, the carbonyl would be less favorable than an amide proton facing the floor of the groove. A DNase I and hydroxyl radical footprinting study of the MPM motif ligands was performed to determine their preferred length and sequence of A-T binding sites (17), demonstrating that these ligands prefer sites with six A-T pairs over those with four and that affinity is lower for sites containing alternating A and T residues. Such sequences probably have less narrowing of the minor groove, in part due to steric clashes that prevent a high propeller twist which correlates with narrow groove width.
Figure 1.
The three ring substituted benzene ligands studied; note the crescent shape of the molecules. Numbering of the proton groups is shown in (A) and (B). (C) Distances between amide protons around the meta- and para-disubstituted rings are given.
In the present work the two substituted benzene ligands shown above, along with a related molecule (Fig. 1C) that contains quaternary ammonium groups at the two tails rather than tertiary amines, were chosen for structural study. The ligands were complexed with short DNA oligonucleotides that contain A-T tracts and studied by 2-dimensional homonuclear NMR. This study revealed additional features important to the design of effective DNA-binding molecules.
MATERIALS AND METHODS
The ligands studied were synthesized as previously described (16). The ligands were weighed to prepare solutions of known concentrations. Synthetic oligonucleotides were purified by reverse phase HPLC and desalted using Water’s Sep Pak Cartridges. Concentrations of the single strands were measured by UV absorbance using the extinction coefficient provided with the oligonucleotides by Operon Technologies. The single strands were combined in 1:1 ratios to create duplex DNA, the formation of which was confirmed by NMR. Duplex DNA concentrations used in the various experiments ranged from 1.5 to 2.5 mM with a total volume of 0.2 ml in Shigemi NMR tubes. The solutions were also 25 mM K2HPO4 pH 7.0 and 0.25 mM EDTA, with 99.96% D2O (Cambridge Isotopes) or 90% H2O/10% D2O as solvent.
Spectra were recorded on General Electric GN-Omega, Bruker DRX 500 MHz or Bruker AMX 600 MHz spectrometers. The duplex DNA samples were titrated with ligand to form 1:1 complexes and followed by 1D experiments. The 1D spectra were 4096 complex points with 64 scans averaged. The NOESY and TOCSY spectra in D2O were acquired with 64 scans, 1024 complex points in t2 and 512 t1 experiments. The experiments used a spectral width of 5000 Hz on the 500 MHz spectrometers and 6024 Hz on the AMX 600. Presaturation pulses were used for water suppression for D2O samples. NOESY experiments in 90% H2O/10% D2O were acquired with 64 scans with 2048 complex points in t2 and 512 t1 experiments. A spectral width of 10 000 Hz was used on the 500 MHz spectrometers and 13 514 Hz on the AMX 600. A 1–1 jump and return sequence was used for water suppression except on the DRX 500, which used both jump and return and a gradient pulse of 2.5 G/cm for 1 ms during the mixing time for solvent suppression. NOESY experiments had a mixing time of 200 ms and the TOCSY experiments had mixing times of 40–100 ms. All experiments were acquired with TPPI, except the DRX 500 90% H2O/10% D2O NOESY, which was States-TPPI, and all were taken at 25°C unless specified otherwise. The data was processed using Felix 95.0 from Biosym. Facelift 2.1 was used for baseline correction following processing with Felix. Molecular modeling of complexes was performed with InsightII by Biosym/MSI. Due to exchange in the NMR data, the models do not contain any NOE-derived distance restraints.
RESULTS
A3T3 complexes
In the initial design of DNA oligonucleotides to form complexes with the ligands it was necessary to determine the optimal length of the A-T site as well as the sequence. A model built in InsightII suggested that in order to accommodate the rings and both tails of the ligands a 6 bp A-T site would be appropriate. Previous footprinting studies of synthetic analogs of distamycin showed that dimethylaminopropyl tails have a preference for proximity to A-T base pairs (18,19). The sequence d(G1C2G3A4A5A6T7T8T9C10G11C12)2, referred to as A3T3, was chosen because crystallographic studies have shown that this sequence has an especially narrow minor groove (1). A subsequent footprinting study has shown that the length and sequence were appropriate choices for these MPM ligands (17).
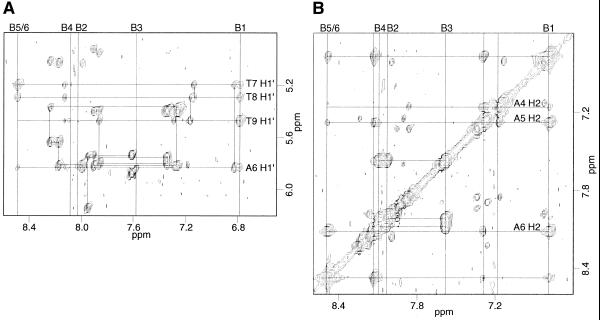
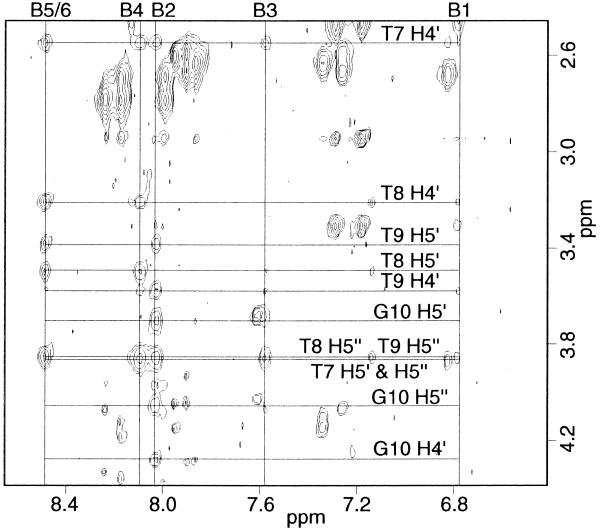
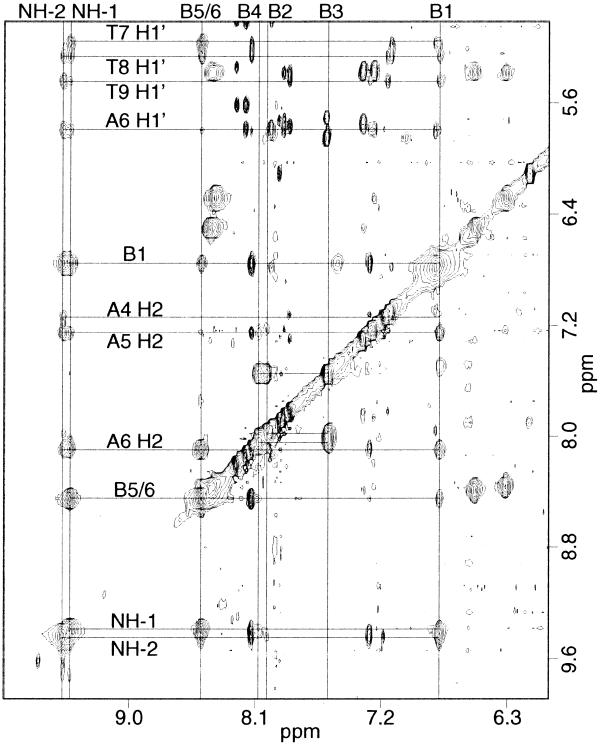
Ligand A was titrated into a solution of the DNA oligomer A3T3 up to a 1:1 DNA:ligand stoichiometry. In the titration a new set of resonances appeared as the free DNA peaks disappeared, indicating slow exchange between the complex and free DNA on the NMR time scale. No evidence was found for a 1:2 DNA:ligand complex, probably because the positively charged tails at both ends of the ligands would repel one another. At 1:1 stoichiometry a NOESY spectrum was collected to characterize the complex. This complex is symmetrical, giving only one set of resonances for the two strands of the DNA and the two halves of the ligand. In addition, the B5 and B6 protons of the ligand (Fig. 1A) have identical chemical shifts, suggesting that the center benzene ring can flip rapidly, interchanging the two protons. Due to this degeneracy, cross-peaks to proton B5 versus those to B6 were distinguished by their relation to minor groove protons, with proton B5 facing towards the floor of the groove and proton B6 facing out of the groove. NOESY data collected in D2O showed ligand to DNA cross-peaks between the B1 and B5 protons of the ligand benzene rings and the H1′ protons of the three thymidines (Fig. 2A) and also to the adenine H2 protons (Fig. 2B). This verifies that the ligand binds to the minor groove of the oligonucleotide and that the protons B1 and B5 of the benzene rings face down toward the floor of the groove. Protons B2, B3, B4 and B6 of the ligand face out of the groove and therefore only have intermolecular cross-peaks to the DNA H4′, H5′ and H5′′ protons, predominantly those of the three thymidines (Fig. 3). The ligand amide protons NH-1 and NH-2 were assigned from NOESY data collected in 90% H2O/10% D2O (Fig. 4). NH-1 and NH-2 face toward the floor of the groove in a similar fashion to the B1 and B5 protons, having cross-peaks to DNA H1′ and adenine H2 protons.
Figure 2.
Regions of the D2O NOESY spectrum showing NOEs from benzene protons facing into the groove to DNA protons of the ligand A/A3T3 complex, 200 ms mixing time. (A) Ligand protons B1 and B5 to DNA H1′ contacts; note that nearly all of the NOEs are to thymidines. (B) Ligand to adenine H2 contacts. Both B1 and B5 have NOEs to more than one nucleotide in both regions.
Figure 3.
Benzene protons B2, B3, B4 and B6, which face out of the groove, show NOEs to DNA H4′, H5′ and H5′′ protons of the deoxyribose sugars. Note that all of the DNA nucleotides contacted are thymidines and each benzene proton contacts several bases. The spectrum shown is the same as in Figure 2.
Figure 4.
90% H2O/10% D2O NOESY of the ligand A/A3T3 complex taken with a 200 ms mixing time. Ligand amide protons NH-1 and NH-2 face into the groove, as do B1 and B5 of the rings, and therefore have NOEs to H1′ and adenine H2 protons. The amides contact several nucleotides, with H1′ contacts predominantly to the thymidines.
Ligand B was also studied in complex with the A3T3 oligomer, with many contacts observed analogous to the complex of ligand A. The complex is again symmetrical and the chemical shifts and observed cross-peaks were similar with minor exceptions, due to the different chemical environment near the urea moiety. The additional NH in the urea group is shifted far upfield in comparison to the two other NH protons in the molecule and does not show any NOEs to the DNA. The complex of ligand C with A3T3 is almost identical to the complex of ligand A, with only minor differences in the chemical shifts among the methylene groups of the tails.
A listing of the ligand C/A3T3 ligand to DNA cross-peaks is given in Table 1. As mentioned previously, most of the DNA protons contacted are of the thymidines; the only H1′ that has any NOEs to the ligand is A6. Each ligand proton has NOE cross-peaks to the protons of several nucleotides. This was unexpected since the amide protons were expected to hydrogen bond to the O2 of the thymines or N3 of the adenines in a single binding site. Each ligand proton should thus have NOE contact to one or two adenine H2 protons and/or deoxyribose sugars. The extra cross-peaks indicate that the ligand must be binding multiple, but closely spaced, sites or ‘sliding’ along the A-T binding site. NOESY data in both D2O and 90% H2O/10% D2O were collected with 100 ms mixing times for integration of cross-peaks to determine distances for a model. After energy/restraint minimization many distance restraints remained violated due to the ligand’s sliding behavior, further indicating that the distances obtained were averages over multiple binding sites. When the model was minimized without distance restraints none of the amide groups was within hydrogen bonding distance of the acceptor groups in the binding site. The minimized model seemed to average the two halves of the ligand within the binding site. When distance restraints were added that forced the amide groups from one half of the ligand to hydrogen bond, the ligand was minimized to a position where most of the NOEs from the spectra could be accounted for but the amides from the other half of the molecule were not within hydrogen bonding distance of acceptors.
Table 1. Intermolecular NOEs between ligand C and A3T3 DNA.
| |
H1′ |
H4′ |
H5′ and
H5″ |
Adenine H2 |
| Benzene | ||||
| B1 | A6, T7, T8, T9 | A4a, A5, A6 | ||
| B2 | T9, G10 | T9, G10 | ||
| B3 | T7 | T7 | ||
| B4 | T7, T8 | T7, T8 | ||
| B5 | A6a,T7, T8 | A5, A6 | ||
| B6 | T7, T8, T9 | T7, T8, T9 | ||
| Amide | ||||
| NH1 | A6a, T7, T8, T9a | A5, A6 | ||
| NH2 | A6, T8, T9 | A4, A5, A6 | ||
| Tail | ||||
| CH2-1 | A4, T9, G10 | A5, T9, G10 | A4, G10 | A4, A5 |
| CH2-2 | T9, G10 | A5, T9, G10 | T9, G10 | A4, A5 |
| CH2-3 | T9, G10 | A5a, T9, G10a | T9 | A4, A5, A6 |
| N(CH3)3 | A4, T9, G10, C11 | A4, A5, G10, C11 | A4, A5, G10 | A4, A5 |
aNOE is weak.
Additional complexes of ligand C
Ligand C was also studied in complex with d(C1G2C3A4A5A6A7A8A9G10C11G12)·d(C13G14C15T16T17T18T19T20T21G22-C23G24) (A6) to further study the observation that the ligands predominantly contacted thymidines in the A3T3 complexes. In the A6 complex one end of the ligand has NOE contacts to the 3′ adenosine H1′ protons, while the other end of the ligand contacts the 3′ thymidine H1′ protons (Table 2). Since the ligand is symmetrical but the binding site is not, exchange cross-peaks are observed between the identical protons on the two halves of the ligand (Fig. 5). As with the A3T3 complexes, the ligand protons contact several nucleotides in the sequence, indicating that the ligand is sliding. Taking spectra at 5°C eliminated the exchange cross-peaks but many ligand peaks broadened and intermolecular cross-peaks weakened. The ligand binds preferentially at the 3′-end of the adenine-rich strand, evidenced by the fact that the intermolecular cross-peaks at the 3′-end of the adenine-rich strand are much stronger and more numerous than the cross-peaks to the bases near the 3′-end of the thymine-rich strand.
Table 2. Intermolecular NOEs between ligand C and A6 DNA.
| |
H1′ |
H4′ |
H5′ and
H5″ |
Adenine H2 |
| Benzene | ||||
| B1 | A6a, A7, T20 and/or T21 | A5a, A6, A8a | ||
| B2 | b | b | ||
| B3 | b | b | ||
| B4 | b | b | ||
| B5 | A8, T19 | A7, A8a | ||
| B6 | b | b | ||
| B1′ | A8a, A9, T18a | A6a, A7a, A8, A9a | ||
| B2′ | b | b | ||
| B3′ | Degenerate w/B3 | Degenerate w/B3 | ||
| B4′ | b | b | ||
| B5′ | A8, T19 | A7, A8a | ||
| B6′ | b | b | ||
| Amide | ||||
| NH1 | A7, T20 and/or T21 | A6 and/or A7, A8a | ||
| NH2 | A6, T20 and/or T21 | A5, A6 and/or A7 | ||
| NH1′ | A9a, T18 | A6 and/or A7, A8 | ||
| NH2′ | A9 | A7a, A8, A9 | ||
| Tail | ||||
| CH2-1 | c | b | b | A5 |
| CH2-2 | c | b | b | A5 |
| CH2-3 | c | b | b | A5 |
| N(CH3)3 | A4 and/or T21, A5, G22 | b | b | A4, A5 |
| CH2-1′ | c | b | b | A9 |
| CH2-2′ | c | b | b | A9 |
| CH2-3′ | c | b | b | A8a, A9 |
| N(CH3)3′ | C11, T16, T17 | b | b | A9 |
aNOE is weak.
bNOEs in the 4′, 5′ and 5″ regions that are difficult to unambigiously assign.
cNOEs are weak and there is spectral overlap with other cross-peaks.
And/or indicates that due to chemical shift degeneracy we cannot distinguish which base has an NOE to the ligand proton.
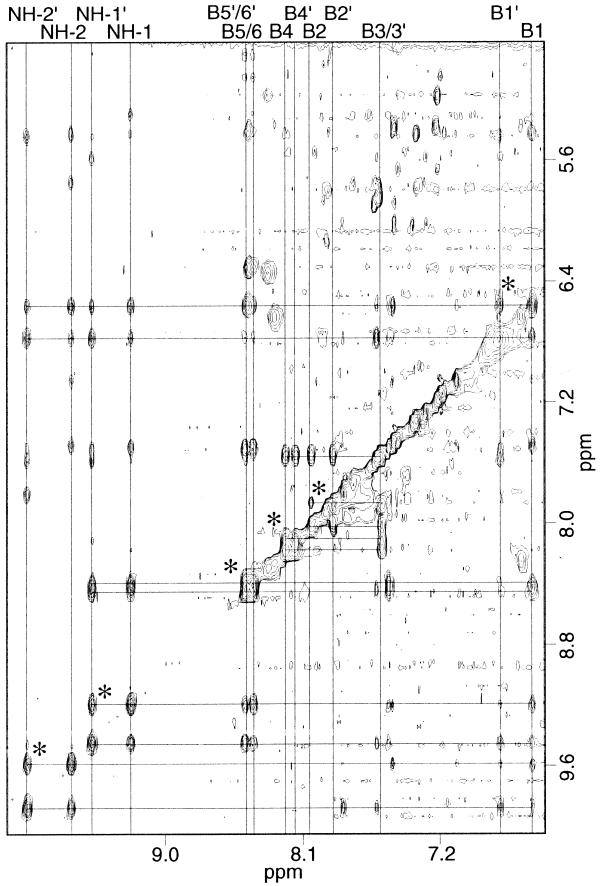
Figure 5.
Ligand C/A6 complex 90% H2O/10% D2O NOESY with 200 ms mixing time. Cross-peaks indicating exchange between the halves of the ligand in the non-symmetrical binding site are indicated by the asterisks.
Ligand C was also studied in complex with the DNA oligomer d(CGCAAATTGCG)·d(CGCAATTTGCG) (A3T2) in an attempt to find an oligomer with just one binding site and remove the sliding behavior. The resonances of the complex were broad, apparently due to an exchange process, and hence many were not assignable. Most of the H1′ to aromatic cross-peaks of the thymines were missing and the adenine H1′ to aromatic cross-peaks were very weak. Furthermore, most of the ligand benzene to DNA cross-peaks found in the A3T3 and A6 complexes were absent, except for NOEs to the adenine H2 protons. One-dimensional spectra at both higher and lower temperatures of this complex were collected but the broadening due to exchange remained.
DISCUSSION
Multiple sites bound, ‘sliding’ behavior
In all of the complexes studied the ligand was found to bind more than one site, as indicated by the fact that each ligand proton had NOEs to multiple nucleotides that could not arise from a single bound form. Since each ligand and DNA proton had a single resonance and no broadening, the exchange rate between these multiple sites must be fast on the NMR time scale. Distamycin, which has a minimal binding site of 4 bp, also binds multiple sites when in complex with the sequences A3T2 and A3T3 (20,21). Other ligands that have exhibited dynamic sliding include SN 6999 and a netropsin analog, but this is likely due to the binding sites studied being too long such that the ligands, like distamycin, are shifting between multiple possible binding sites (22,23). The attempt to prevent ligand C from binding multiple sites by shortening the length of the site to A3T2 was unsuccessful; the H1′ protons in the A3T2 tract were unassignable due to broadening. Since resonances of the free DNA were in slow exchange at intermediate points in the titration, the exchange process leading to this broadening must be within the complex. Footprinting studies (17) of these ligands found that a 6 bp site was preferred to a 4 bp site and modeling showed that a 6 bp site would best accommodate the tails as well as the rings. It is possible that some conformational change is required if binding must occur partially in the G-C region, but the line broadening precludes its characterization.
A possible explanation for the sliding behavior on 6 bp sites is that the distance between the amides flanking the central benzene (Fig. 1C) appears to be too long for the ligand to hydrogen bond to the DNA with all of the amide groups simultaneously. The distance between the amides on the outer meta-substituted benzene rings is similar to the distances between amides linking the pyrrole and imidazoles in distamycin analogs, suggesting that the amide meta-substituents are capable of effective sequential hydrogen bonding. Due to the distance mismatch around the central benzene, the two halves cannot hydrogen bond simultaneously. Since it appears that only one half of the molecule can hydrogen bond at a time, the molecule slides between equivalent subsites, alternating the end which is hydrogen bonded. In the model of ligand C/A3T3 in which one half of the ligand was restrained to hydrogen bond to the O2 protons of thymines the amides from the other half of the ligand were not within hydrogen bond distance of the acceptor groups on the bases. Thus sliding appears to occur due to a mismatch in length of the ligand and in the spacing of hydrogen bond donors relative to the target DNA.
Ligand predominantly contacts 3′ bases of binding sites
The observation that the ligands have NOEs predominantly to the thymidine H1′ protons in A3T3 and the 3′ adenosine and thymidine H1′ protons of A6 on their respective strands initially suggested that the ligands bind at an angle in the minor groove. However, the model of ligand C with A3T3, in which the observed NOEs are accounted for (Fig. 6), revealed that the closer proximity to the 3′-ends of the binding site is due to specific positioning of the ligand relative to the helix. The ligand is in fact well entered in the groove, as has been seen in other complexes of this type (3).
Figure 6.

Model of the ligand C/A3T3 complex. Hydrogens have been removed from the DNA for clarity.
Preference for narrow groove sites
Ligand C in its complex with A6 was observed to bind preferentially toward the 3′-end of the adenine-rich strand. Previous NMR characterizations of DNA oligonucleotides containing sites with five or six adenines in a row have shown that the cross-peaks between the adenine H2 protons and the H1′ of the 3′-neighboring residue on the complementary strand in a NOESY spectra become stronger as the number of adenines increases, particularly for the 3′-most adenine residues (24–26). It has been proposed that this is due to shorter distances as the minor groove narrows from 5′ to 3′ along the oligo(dA)·oligo(dT) site. X-ray crystallographic structures of similar oligonucleotides have not found such a systematic narrowing in the minor groove, but these structures have been affected by crystal packing forces (10,27,28), making it difficult to discern the true intrinsic characteristics of the DNA. Nonetheless, it remains plausible that the ligand is binding further towards the 3′-end of the adenine-rich strand because the site does narrow and therefore the van der Waals forces are more favorable at the narrower end. Further structural characterization of adenine-rich sites will be necessary to prove this point conclusively.
Future design of ligands
It is clear that it is important to maintain the overall crescent shape of minor groove ligands to maintain a good interface with the minor groove. The results described here indicate that it is also important that the distance between hydrogen bonding groups is close to the distance between base pairs so that all are able to hydrogen bond simultaneously for optimum affinity. Although the para-substituted benzenes are synthetically attractive, the amide spacing which then occurs seems to be an intrinsic limitation. Ligands containing both five and six member aromatic rings, as have been investigated by others (29,30), may be easier to match to both the overall crescent shape and the correct spacing of hydrogen bonding groups than ligands with six member rings alone.
References
- 1.Coll M., Frederick,C.A., Wang,A.H.J. and Rich,A. (1987) A bifurcated hydrogen-bonded conformation in the d(AT) base pairs of the DNA dodecamer d(CGCAAATTTGCG) and its complex with distamycin. Proc. Natl Acad. Sci. USA, 84, 8385–8389. [DOI] [PMC free article] [PubMed] [Google Scholar]
- 2.Klevit R.E., Wemmer,D.E. and Reid,B.R. (1986) 1H NMR studies on the interaction between distamycin A and a symmetrical DNA dodecamer. Biochemistry, 25, 3296–3303. [DOI] [PubMed] [Google Scholar]
- 3.Patel D.J. and Shapiro,L. (1985) Molecular recognition in noncovalent antitumor agent-DNA complexes: NMR studies of the base and sequence dependent recognition of the DNA minor groove by netropsin. Biochimie, 67, 887–915. [DOI] [PubMed] [Google Scholar]
- 4.Kopka M.L., Yoon,C., Goodsell,D., Pjura,P. and Dickerson,R.E. (1985) Binding of an antitumor drug to DNA, Netropsin and C-G-C-G-A-A-T-T-BrC-G-C-G. J. Mol. Biol., 183, 553–563. [DOI] [PubMed] [Google Scholar]
- 5.Brown D.G., Sanderson,M.R., Garman,E. and Neidle,S. (1992) Crystal structure of a berenil-d(CGCAAATTTGCG) complex. An example of drug–DNA recognition based on sequence-dependent structural features. J. Mol. Biol., 226, 481–490. [DOI] [PubMed] [Google Scholar]
- 6.Lane A.N., Jenkins,T.C., Brown,T. and Neidle,S. (1991) Interaction of berenil with the EcoRI dodecamer d(CGCGAATTCGCG)2 in solution studied by NMR. Biochemistry, 30, 1372–1385. [DOI] [PubMed] [Google Scholar]
- 7.Pjura P.E., Grzeskowiak,K. and Dickerson,R.E. (1987) Binding of Hoechst 33258 to the minor groove of B-DNA. J. Mol. Biol., 197, 257–271. [DOI] [PubMed] [Google Scholar]
- 8.Spink N., Brown,D.G., Shelly J.V. and Neidle,S. (1994) Sequence-dependent effects in drug–DNA interaction: the crystal structure of Hoechst 33258 bound to the d(CGCAAATTTGCG)2 duplex. Nucleic Acids Res., 22, 1607–1612. [DOI] [PMC free article] [PubMed] [Google Scholar]
- 9.Dickerson R.E., Drew,H.R., Conner,B.N., Wing,R.M., Fratini,A.V. and Kopka,M.L. (1982) The anatomy of A-, B- and Z-DNA. Science, 216, 475–485. [DOI] [PubMed] [Google Scholar]
- 10.Nelson H.C.M., Finch,J.T., Bonaventura,F.L. and Klug,A. (1987) The structure of an oligo(dA)·oligo(dT) tract and its biological implications. Nature, 330, 221–226. [DOI] [PubMed] [Google Scholar]
- 11.Kopka M.L., Yoon,C., Goodsell,D., Pjura,P. and Dickerson,R.E. (1985) The molecular origin of DNA–drug specificity in netropsin and distamycin. Proc. Natl Acad. Sci. USA, 82, 1376–1380. [DOI] [PMC free article] [PubMed] [Google Scholar]
- 12.Dwyer T.J., Geierstanger,B.H., Bathini,Y., Lown,J.W. and Wemmer,D.E. (1992) Design and binding of a distamycin-A analog to d(CGCAAGTTGGC)·d(GCCAACTTGCG)—synthesis, NMR studies and implications for the design of sequence-specific minor groove binding oligopeptides. J. Am. Chem. Soc., 114, 5911–5919. [Google Scholar]
- 13.Wade W.S., Mrksich,M. and Dervan,P.B. (1992) Design of peptides that bind in the minor groove of DNA at 5′-(A,T)G(A,T)C(A,T)-3′ sequences by a dimeric side-by-side motif. J. Am. Chem. Soc., 114, 8783–8794. [Google Scholar]
- 14.White S., Szewczyk,J.W., Turner,J.M., Baird,E.E. and Dervan,P.B. (1998) Recognition of the four Watson–Crick base pairs in the DNA minor groove by synthetic ligands. Nature, 391, 468–471. [DOI] [PubMed] [Google Scholar]
- 15.Yan Y.F., Liu,M. and Gong,B. (1997) Two-ring DNA minor-groove binders consisting of readily available, di-substituted benzene derivatives. Bioorg. Med. Chem. Lett., 7, 1469–1474 [Google Scholar]
- 16.Gong B. and Yan,Y. (1997) New DNA minor-groove binding molecules with high sequence-selectivities and binding affinities. Biochem. Biophys. Res. Commun., 240, 557–560. [DOI] [PubMed] [Google Scholar]
- 17.Fox K.R., Yan,Y. and Gong,B. (1999) DNA sequence recognition by a novel series of minor groove-binding ligands. Anticancer Drug Des., 14, 219–230 [PubMed] [Google Scholar]
- 18.Mrksich M. and Dervan,P.B. (1993) Antiparallel side-by-side heterodimer for sequence-specific recognition in the minor groove of DNA by a distamycin 1-methylimidazole-2-carboxamide-netropsin pair. J. Am. Chem. Soc., 115, 2572–2576. [Google Scholar]
- 19.Swalley S.E., Baird,E.E. and Dervan,P.B. (1999) Effects of gamma-turn and beta-tail amino acids on sequence-specific recognition of DNA by hairpin polyamides. J. Am. Chem. Soc., 121, 1113–1120. [Google Scholar]
- 20.Pelton J.G. and Wemmer,D.E. (1990) Structure and dynamics of distamycin-A with d(CGCAAATTGGC)-d(GCCAATTTGCG) at low drug–DNA ratios. J. Biomol. Struct. Dyn., 8, 81–97. [DOI] [PubMed] [Google Scholar]
- 21.Pelton J.G. and Wemmer,D.E. (1990) Binding modes of distamycin-A with d(CGCAAATTTGCG)2 determined by 2-dimensional NMR. J. Am. Chem. Soc., 112, 1393–1399. [Google Scholar]
- 22.Leupin W., Chazin,W.J., Hyberts,S., Denny,W.A. and Wüthrich,K. (1986) NMR studies of the complex between the decadeoxynucleotide d-(GCATTAATGC)2 and a minor-groove-binding drug. Biochemistry, 25, 5902–5910. [DOI] [PubMed] [Google Scholar]
- 23.Lee M., Chang,D., Hartley,J.A., Pon,R.T., Krowicki,K. and Lown,J.W. (1988) Structural and dynamic aspects of binding of a prototype lexitropsin to the decadeoxyribonucleotide d(CGCAATTGCG)2 deduced from high-resolution 1H NMR Studies. Biochemistry, 27, 445–455. [DOI] [PubMed] [Google Scholar]
- 24.Katahira M., Sugeta,H., Kyogoku,Y., Fujii, S, Fujisawa,R. and Tomita,K.-I. (1988) One- and two-dimensional NMR studies on the conformation of DNA containing the oligo(dA)·oligo(dT) tract. Nucleic Acids Res., 16, 8619–8632. [DOI] [PMC free article] [PubMed] [Google Scholar]
- 25.Katahira M., Sugeto,H. and Kyogoku,Y. (1990) A new model for the bending of DNAs containing the oligo(DA) tracts based on NMR observations. Nucleic Acids Res., 18, 613–618. [DOI] [PMC free article] [PubMed] [Google Scholar]
- 26.Chuprina V.P., Lipanov,A.A., Fedoroff,O.Y., Kim,S.-G., Kintanar,A. and Reid,B.R. (1991) Sequence effects on local DNA topology. Proc. Natl Acad. Sci. USA, 88, 9087–9091. [DOI] [PMC free article] [PubMed] [Google Scholar]
- 27.DiGabriele A.D. and Steitz,T.A. (1989) Crystal lattice packing is important in determining the bend of a DNA dodecamer containing an adenine tract. Proc. Natl Acad. Sci. USA, 86, 1816–1820. [DOI] [PMC free article] [PubMed] [Google Scholar]
- 28.DiGabriele A.D. and Steitz,T.A. (1993) A DNA dodecamer containing an adenine tract crystallizes in a unique lattice and exhibits a new bend. J. Mol. Biol., 231, 1024–1039. [DOI] [PubMed] [Google Scholar]
- 29.Neamati N., Mazamder,A., Sunder,S., Owen,J.M., Tandon,M., Lown,J.W. and Pommier,Y. (1998) Highly potent synthetic polyamides, bis-distamycins and lexitropsins as inhibitors of human immunodeficiency virus type 1 integrase. Mol. Pharmacol., 54, 280–290. [DOI] [PubMed] [Google Scholar]
- 30.Gmeiner W.H., Cui,W., Konerding,D.E., Keifer,P.A., Sharma,S.K., Soto,A.M., Marky,L.A. and Lown,J.A. (1999) Shape-selective recognition of a model Okazaki fragment by geometrically constrained bis-distamycins. J. Biol. Struct. Dyn., 17, 507–518. [DOI] [PubMed] [Google Scholar]


