

Abstract
The responses of Escherichia coli central carbon metabolism to knockout mutations in phosphoglucose isomerase and glucose-6-phosphate (G6P) dehydrogenase genes were investigated by using glucose- and ammonia-limited chemostats. The metabolic network structures and intracellular carbon fluxes in the wild type and in the knockout mutants were characterized by using the complementary methods of flux ratio analysis and metabolic flux analysis based on [U-13C]glucose labeling and two-dimensional nuclear magnetic resonance (NMR) spectroscopy of cellular amino acids, glycerol, and glucose. Disruption of phosphoglucose isomerase resulted in use of the pentose phosphate pathway as the primary route of glucose catabolism, while flux rerouting via the Embden-Meyerhof-Parnas pathway and the nonoxidative branch of the pentose phosphate pathway compensated for the G6P dehydrogenase deficiency. Furthermore, additional, unexpected flux responses to the knockout mutations were observed. Most prominently, the glyoxylate shunt was found to be active in phosphoglucose isomerase-deficient E. coli. The Entner-Doudoroff pathway also contributed to a minor fraction of the glucose catabolism in this mutant strain. Moreover, although knockout of G6P dehydrogenase had no significant influence on the central metabolism under glucose-limited conditions, this mutation resulted in extensive overflow metabolism and extremely low tricarboxylic acid cycle fluxes under ammonia limitation conditions.
The central carbon pathways constitute the backbone of cell metabolism by providing energy, building blocks, and reducing power for biomass synthesis. Due to the extensive redundancy and the presence of isozymes, most single-gene knockout mutations in central metabolism do not block cell growth on glucose (13, 18). To reveal gene-phenotype relationships, it is important to gain insight into the complex responses of the metabolic network in its entirety to these mutations. The most important properties of biochemical networks are the per se nonmeasurable in vivo reaction rates, which may be estimated by metabolic flux analysis (41).
The most common approach is based on flux balancing of extracellular uptake and secretion rates within a stoichiometric reaction model (26, 45). This approach usually requires assumptions about redox or energy balances, and the validity of these assumptions strongly affects the flux estimates. To increase the reliability and resolution of such flux balance analyses, additional information may be obtained from 13C labeling experiments (43, 48). In this approach, the isotope labeling patterns of intracellular metabolites are analyzed by either nuclear magnetic resonance (NMR) or mass spectrometry. The data are then used for identification of the metabolic network structure or for quantification of the intracellular carbon fluxes.
Direct analytical interpretation of 13C labeling patterns may provide direct evidence for a particular flux or reaction (24, 34). Recently, a more general method of flux ratio analysis has been developed based on biosynthetically directed fractional 13C labeling by cofeeding of unlabeled glucose and [U-13C]glucose (30, 44). The resulting 13C labeling patterns of metabolic intermediates are analyzed by two-dimensional NMR spectroscopy of the anabolic products (e.g., amino acids) synthesized from these intermediates. The observed 13C-13C scalar coupling multiplet intensities are then transformed into the relative abundance of intact carbon fragments originating from a single glucose source molecule. Since alternative pathways leading to the same metabolites yield different intact fragments, flux ratio analysis enables identification of active pathways in a bioreaction network and the ratios of some intracellular fluxes.
The 13C labeling data in combination with biomass composition and extracellular flux data may also be used to quantify the intracellular fluxes in a metabolic network (7, 35, 39). Based on the balances of metabolites and isotopomers, a mathematical framework relating the metabolic fluxes to the 13C labeling data is constructed. The intracellular flux distribution is then estimated by finding a best fit for all the available data in an iterative fitting procedure. Since the flux distribution represents the mathematically best estimate for the given biochemical reaction network, the validity of the network itself may affect the flux result. To avoid this, the bioreaction network identified by flux ratio analysis may be used for flux quantification. Consequently, the flux ratio analysis and metabolic flux analysis methods are highly complementary. Flux ratio analysis provides insight into which enzymes are active and which enzymes are not active and if there is an unknown reaction taking place in cells. This method can identify the metabolic network structure for metabolic flux analysis. The intracellular flux distribution estimated by metabolic flux analysis provides a holistic view of cellular metabolism. The result can be used for quantitative comparison of cells grown under different environmental conditions or for comparison of different mutant strains (9, 21, 37, 47). Moreover, as these two methods are very different, flux ratio analysis may provide an independent verification of the flux estimates (14).
In this study, we used a combination of flux ratio analysis and metabolic flux analysis to quantitatively investigate how Escherichia coli metabolism responds to knockout of phosphoglucose isomerase or glucose-6-phosphate (G6P) dehydrogenase in glucose- and ammonia-limited chemostat cultures. Phosphoglucose isomerase and G6P dehydrogenase are located at the first juncture of the two important routes of central carbon metabolism, the Embden-Meyerhof-Parnas (EMP) and pentose phosphate (PP) pathways (Fig. 1). Estimation of the relative contributions of the EMP and PP pathways to glucose catabolic flux has received considerable attention (4, 12) due to the variability with environmental conditions and the relevance for NADPH metabolism. Glucose limitation and ammonia limitation represent bioenergetically very different regimens that have profound effects on cellular physiology and carbon fluxes, including the PP pathway flux (10, 33). The PP pathway is used for production of NADPH, which is mainly used in anabolic reactions and may also play an important role in the antioxidant system (3).
FIG. 1.

Bioreaction network of E. coli central carbon metabolism. The arrows indicate the physiological directions of reactions. Fluxes to biomass building blocks are indicated by gray arrows. Abbreviations: F6P, fructose 6-phosphate; T3P, triose 3-phosphate; 3PG, 3-phosphoglycerate; PYR, pyruvate; ACoA, acetyl coenzyme A; 6PG, 6-phosphogluconate; S7P, seduheptulose 7-phosphate; OAA, oxaloacetate; ICT, isocitrate; AKG, α-ketoglutarate; SUC, succinate; FUM, fumarate; MAL, malate; GOX, glyoxylate; EPS, extracellular polysaccharide; ETH, ethanol; ACE, acetate; ex, extracellular.
MATERIALS AND METHODS
Strains, media, and growth conditions.
The strains used throughout this study were E. coli wild-type strain W3110 [F− λ− IN(rrnD-rrnE)1 rph-1], K-12 strain BW25113 (F− λ− rph-1 ΔaraBADAH33 lacIq ΔlacZWJ16 rrnBT14 ΔrhaBADLD78 hsdR514) (6), phosphoglucose isomerase knockout mutant JWK3985, and G6P dehydrogenase knockout mutant JWK1841. Mutant strains JWK3985 and JWK1841 were constructed by deleting the pgi and zwf genes from BW25113, respectively, by using an established protocol (6). Briefly, primers for deletion (Table 1) were used to amplify the kanamycin resistance gene from pKD13 (6). Strains harboring pKD46 (6) were grown in SOB medium containing 50 mg of ampicillin per liter and 1 mM l-arabinose and were transformed with the PCR products by using an electroporator (Bio-Rad, Hercules, Calif.). Kanamycin-resistant strains were selected on agar plates, and the mutations were confirmed by PCR performed with confirmation primers (Table 1).
TABLE 1.
Primer sequences used for gene deletion and confirmation
| Use | Gene | Sequence (5′ to 3′) |
|---|---|---|
| Deletion | pgi | TACAATCTTCCAAAGTCACAATTCTCAAAATCAGAAGAGTATTGCTAATGATTCCGGGGATCCGTCGACC |
| GCCTTATCCGGCCTACATATCGACGATGATTAACCGCGCCACGCTTTATATGTAGGCTGGAGCTGCTTCG | ||
| zwf | GTATACCCTGGCTTAAGTACCGGGTTAGTTAACTTAAGGAGAATGACATGATTCCGGGGATCCGTCGACC | |
| AAAATAACCATAAAGGATAAGCGCAGATATTACTCAAACTCATTCCAGGATGTAGGCTGGAGCTGCTTCG | ||
| Confirmation | pgi | CCTTCAAACAAATTACTATGCAG |
| CCTTGGGTACTGGTGGTCGTGGT | ||
| zwf | CCAAGCTTAGCGCCTTCTACAGC | |
| CCGCGATCGTCACTTAAATTAAG |
All E. coli strains were precultured in a minimal medium that contained (per liter) 5.0 g of glucose, 1.0 g of NH4Cl, 2.7 g of (NH4)2SO4, 6.8 g of Na2HPO4, 3.0 g of KH2PO4, 0.6 g of NaCl, 0.2 g of MgSO4 · 7H2O, 1.0 μg of thiamine HCl, 2.0 μl of polypropylene glycol 2000 as an antifoaming agent, and 10 ml of a trace element solution containing (per liter) 0.55 g of CaCl2 · 2H2O, 1.67 g of FeCl3 · 6H2O, 0.10 g of MnCl4 · 4H2O, 0.17 g of ZnCl2, 0.04 g of CuCl2 · 2H2O, 0.06 g of CoCl2 · 6H2O, and 0.06 g of Na2MoO4 · 4H2O. Exponentially growing cells were harvested and used for reactor inoculation. The glucose-limited chemostat medium had the same composition as the preculture medium. For ammonia-limited chemostats, the concentrations of the nitrogen sources, NH4Cl and (NH4)2SO4, were reduced to 0.20 and 0.24 g/liter, respectively, and all other components were kept at the same concentrations as those used in the glucose-limited experiments. The chemostat media were sterilized by passage through a filter with a pore size of 0.2 μm, and the trace element solution was added after filtration.
Chemostat cultivation was performed at 37°C in a 2-liter bioreactor (BMJ-02PI; Able Co.,Tokyo, Japan) with a working volume of 1 liter. The culture medium was continuously fed to the bioreactor at a dilution rate of 0.1 h−1, and the working volume was kept constant by withdrawing culture broth through a continuously operating pump. The pH of the culture was maintained at 7.0 by addition of 2.0 M NaOH. Agitation at 450 rpm and a constant airflow of 1.0 liter/min ensured that the dissolved oxygen concentration was above 60% saturation. The oxygen and carbon dioxide concentrations in the bioreactor effluent gas were monitored with an exhaust gas analyzer (Off-Gas Jr. DEX-2562; Able Co.).
Labeling experiments were started after the cultures reached the steady state; we assumed that the steady state was reached when the optical density at 600 nm and the exhaust gas analysis results remained constant for at least three volume changes. The unlabeled feed was replaced by an identical medium containing 4.5 g of unlabeled glucose per liter and 0.5 g of [U-13C]glucose (>98% 13C; Isotech, Miamisburg, Ohio) per liter. Biomass samples for NMR analysis were taken after two volume changes, so that 86% of the biomass was 13C labeled, which was calculated based on the first-order washout kinetics.
Analytical methods.
Cell growth during cultivation was monitored by measuring the optical density at 600 nm. Cell dry weight was determined from cell pellets of 100-ml culture aliquots that were centrifuged for 10 min at 4°C and 8,000 × g, washed once with distilled water, and dried at 85°C until the weight was constant.
For extracellular metabolite analysis, culture samples were centrifuged for 5 min at 4°C and 20,000 × g to remove the cells. Glucose, ammonia, and ethanol concentrations were determined with enzymatic test kits (Roche Molecular Biochemicals, Mannheim, Germany). Organic acids were detected by high-pressure liquid chromatography with a model 2695 instrument (Waters, Milford, Mass.) equipped with an Inertsil ODS-3V column (4.6 by 250 mm; GL Sciences Inc., Tokyo, Japan) and a Waters 2487 UV detector. A mobile phase consisting of 50 mM NH4H2PO4 at a flow rate of 1.0 ml/min was used, and the column was operated at 40°C. Acetate, formate, pyruvate, d-lactate, α-ketoglutarate, succinate, and fumarate concentrations were also determined enzymatically with Roche test kits or by using standard protocols (49). The extracellular polysaccharide concentration was determined by the phenol-sulfuric acid method by using glucose for calibration (23). The relative contributions of protein, RNA, and glycogen to the macromolecular biomass composition were determined as described previously (51).
In vitro enzyme activities were determined in crude cell extracts from 10-ml culture aliquots that were centrifuged at 4°C and 8,000 × g for 10 min. The cell pellets were then washed and resuspended in disruption buffer, which contained 200 mM Tris-HCl (pH 7.6), 4 mM MgCl2, and 2 mM dithiothreitol. Cell disruption was achieved by sonication with an ultrasonic disruptor (UD-201; Tomy, Tokyo, Japan), and the cell debris was removed by centrifugation for 15 min at 4°C and 20,000 × g. The supernatant was used for determination of enzyme activities and the protein concentration (29). Phosphoglucose isomerase activity was measured by monitoring the increase in the NADPH concentration by using G6P dehydrogenase as a coupling enzyme (19). The activities of NADP+-dependent G6P dehydrogenase (11), 6-phosphogluconate dehydrogenase (19), and isocitrate dehydrogenase (20) were determined by monitoring the increase in the amount of NADPH. The change in the amount of NADPH was monitored fluorimetrically by using an excitation wavelength of 355, an emission wavelength of 460 nm, and a dual-scanning microplate spectrofluorometer (SPECTRAmax GEMINI XS; Molecular Devices Co., Sunnyvale, Calif.). Isocitrate lyase activity was assayed by the phenylhydrazine method (31).
NMR spectroscopy.
At the end of the labeling experiment, 400-ml portions of culture samples were harvested by centrifugation for 10 min at 4°C and 8,000 × g. The cell pellets were washed three times with 20 mM Tris-HCl (pH 7.6) and resuspended in 24 ml of 6 M HCl. Each mixture was then separated into two fractions. The first fraction was 6 ml for the glucose-limited chemostat and 12 ml for the ammonia-limited chemostat, and the second fraction was 18 ml for the glucose-limited chemostat and 12 ml for the ammonia-limited chemostat. The first fraction was hydrolyzed for 12 h at 105°C and used to determine the labeling patterns of amino acids and glycerol. In the resulting hydrolysate there were 16 proteinogenic amino acids, since cysteine and tryptophan were oxidized and asparagine and glutamine were deaminated during the acid hydrolysis. The second fraction was hydrolyzed for only 30 min at 105°C and used to determine the labeling state of glucose. The hydrolysates from both fractions were filtered through a 0.2-μm-pore-size filter and evaporated to dryness. The dried material was then dissolved in 650 μl of 20 mM 2HCl in 2H2O, filtered, and used for the NMR measurements.
The labeling patterns of amino acids, glycerol, and glucose in the hydrolysates were determined by NMR spectroscopy. The measurements were obtained at 30°C and 400 MHz with a Bruker Avance 400 spectrometer (Bruker, Karlsruhe, Germany). Two-dimensional proton-detected heteronuclear 13C-1H correlation ([13C, 1H]-COSY) spectra were recorded. For each labeling experiment, the following three spectra were measured: one spectrum for the aliphatic carbons of amino acids and glycerol with the 13C carrier concentration set to 45 ppm, one spectrum for the aromatic rings of amino acids with the 13C carrier concentration set to 125 ppm, and one spectrum for the carbons of glucose with the 13C carrier concentration set to 65 ppm. For NMR analyses in each labeling experiment, the measurement times were 15.5 h (data size, 3,072 × 1,024 complex points; t1max = 249 ms; t2max = 128 ms; scan number, 8) for aliphatic spectra, 10.5 h (data size, 2,048 × 1,024 complex points; t1max = 360 ms; t2max = 128 ms; scan number, 8) for aromatic spectra, and 15.5 h (data size, 1,536 × 1,024 complex points; t1max = 124 ms; t2max = 128 ms; scan number, 16) for glucose spectra. Before Fourier transformation, the time domain data were multiplied in t1 and t2 with sine-bell windows shifted by π/2. The digital resolutions along ω1 after linear prediction and zero filling were 0.86 Hz/point for aliphatic spectra, 1.47 Hz/point for aromatic spectra, and 1.72 Hz/point for glucose spectra.
The overall degree of 13C labeling in the sample (P1) was determined from the satellites of well-separated peaks in one-dimensional 1H-NMR spectra (acquisition time, 1.024 s; interscan delay, 8 s) and was confirmed by analysis of the scalar coupling fine structure of leucine Cβ. P1 was 0.096 in all cases.
All NMR data processing was performed by using the Bruker XWINNMR software. The 13C-13C scalar coupling fine structures were extracted from the cross sections taken along the 13C axis in a two-dimensional NMR spectrum. After manual baseline correction, the individual multiplet components of the scalar coupling fine structures were integrated to quantify the relative contributions of singlet, doublet, and doublet-of-doublets signals. This evaluation procedure is valid only if strong 13C-13C scalar coupling effects are negligible. Thus, in glucose spectra, only C-4 of β-glucose was evaluated, because there was strong coupling for the other carbons of glucose. For C-4 of β-glucose, the scalar coupling constant for the adjacent carbons was much smaller than the corresponding chemical shift difference, so the strong coupling could be neglected.
Flux ratio analysis.
Forty-eight 13C-13C scalar coupling fine structures for the 16 amino acids, glycerol, and glucose present in the hydrolysates were determined from the two-dimensional NMR spectra. The observed relative multiplet intensities (I values) were used to calculate the relative abundances of intact carbon fragments (f values) with equations A1 and A2 (see Appendix). The denotations of f are shown in the Appendix (see Table A1). The f values for the following carbon atom positions provided information on the metabolic origins of their precursors: β-glucose C-4 for G6P; His-α, His-β, and His-δ2 for pentose 5-phosphate (P5P); Tyr-δx and Tyr-ɛx for erythrose 4-phosphate (E4P); glycerol C-1/C-3 and glycerol C-2 for triose 3-phosphate; Ser-α, Ser-β, and Gly-α for 3-phosphoglycerate; Phe-α, Phe-β, Tyr-α, and Tyr-β for phosphoenolpyruvate (PEP); Ala-α, Ala-β, Val-α, Val-γ1, Val-γ2, Leu-β, Leu-δ1, Leu-δ2, and Ile-γ2 for pyruvate; Leu-α for acetyl-coenzyme A; Lys-β, Lys-γ, Lys-δ, and Lys-ɛ for pyruvate and oxaloacetate; Asp-α, Asp-β, Met-α, Thr-α, Thr-β, Thr-γ, Ile-α, Ile-γ1, and Ile-δ for oxaloacetate; and Glu-α, Glu-β, Glu-γ, Pro-α, Pro-β, Pro-γ, Pro-δ, Arg-β, Arg-γ, and Arg-δ for α-ketoglutarate.
TABLE A1.
Denotations of f used in flux ratio analysisa
 |
According to the description of Szyperski (42). The arrows indicate the observed carbon positions. The carbon-carbon bonds that remain intact from a single glucose source molecule are indicated by boldface lines.
The carbon indicated by the asterisk exhibits greater coupling with the observed carbon. When the observed carbon has scalar coupling constants identical to those of the adjacent carbons, f(2) is the sum of f(2a) and f(2b).
Flux ratios for several key pathways in central metabolism of wild-type E. coli were derived by Szyperski (42). In order to cope with the unpredicted changes in metabolic network structure due to genetic manipulations, the formalism derived to analyze wild-type metabolism needs to be extended. Here we developed equations that are required to assess the activities of the glyoxylate shunt, the Entner-Doudoroff (ED) pathway, and the nonoxidative part of the PP pathway. The ratios of other metabolic fluxes were calculated as described previously (42, 50). The detailed derivation for the fraction of oxaloacetate formed via the glyoxylate shunt has been described previously (50). All results for flux ratios in this paper contained the standard error introduced by the experiment error, which was estimated from analysis of redundant scalar coupling fine structures and the signal-to-noise ratio of the [13C, 1H]-COSY spectra.
(i) Oxaloacetate formed via the glyoxylate shunt.
If the glyoxylate shunt is inactive, the intact C-1-C-2 and C-3-C-4 fragments in the oxaloacetate (OAA) pool originate from α-ketoglutarate and PEP, yielding equations 1.
 |
(1) |
 |
In equations 1, Xexch, which is the fraction of oxaloacetate molecules that were reversibly interconverted to fumarate at least once, can be calculated from 2f(3)(Asp-β)/[f(3)(Asp-α) + f(3)(Asp-β)]. Xppc, the fraction of oxaloacetate stemming from anaplerotic carboxylation of PEP, can be calculated with equation 2.
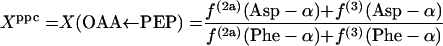 |
(2) |
Equations 1 are used to identify the activity of the glyoxylate shunt. If the glyoxylate shunt is inactive, equations 1 are satisfied within experimental error, while the active glyoxylate shunt results in obviously higher values of f(2b)(Asp-α) and f(2b)(Asp-β) than the values calculated with equations 1.
If the glyoxylate shunt is active under the conditions investigated, excess intact C-1-C-2 and C-3-C-4 connectivities in oxaloacetate are introduced via the glyoxylate shunt. Thus, the fraction of oxaloacetate molecules formed via the glyoxylate shunt, Xglo, can be obtained by using equations 3.
 |
(3) |
or
 |
 |
 |
 |
 |
(ii) Pyruvate formed via the ED pathway.
If the ED pathway is active, excess intact C-1-C-2-C-3 fragments may be introduced into the pyruvate pool via the ED pathway, yielding equation 4.
 |
(4) |
In equation 4, XME, the fraction of pyruvate derived from malate via the malic enzyme, can be calculated with equations 5.
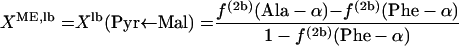 |
(5) |
 |
where lb and ub indicate the lower and upper boundaries, respectively. Since the interconversion of oxaloacetate to malate leads to the introduction of intact C-1-C-2-C-3 fragments into the malate pool, f(3)(Asp-β) ≤ f(3)(malate C-2) ≤ f(3)(Asp-α) is obtained. Thus, the lower and upper boundaries for the fraction of pyruvate molecules formed via the ED pathway, XED,lb and XED,ub, can be assessed by using equations 6 and 7, respectively.
 |
(6) |
 |
(7) |
The G6P pool is assessable via glucose; i.e., f(i)(G6P C-2) = f(i)(glucose C-2). Equations 6 and 7 are used to identify the activity of the ED pathway when f(3)(G6P C-2) is larger than f(3)(Phe-α).
(iii) P5P and E4P synthesized via the nonoxidative PP pathway.
If P5P and E4P are synthesized from triose 3-phosphate and fructose 6-phosphate via the nonoxidative part of the PP pathway, equations 8 are obtained.
 |
(8) |
 |
 |
 |
 |
 |
Metabolic flux analysis.
For quantification of carbon fluxes in the central metabolism of E. coli, a bioreaction network was constructed, as shown in Fig. 1. This network includes the reactions of the EMP, PP, and ED pathways, as well as the tricarboxylic acid (TCA) cycle and the glyoxylate shunt. The reactions catalyzed by PEP carboxylase (v19), PEP carboxykinase (v20), and malic enzyme (v21) were also included. The networks of active pathways identified by flux ratio analysis were used for flux quantification (see Results). The following enzyme reactions were considered reversible: phosphoglucose isomerase (v2), transketolase (v10 and v12), transaldolase (v11), the sequence of glycolytic reactions leading from triose 3-phosphate to PEP (v4 and v5), succinate dehydrogenase (v16), fumarase (v17), and malate dehydrogenase (v18).
The reversible transfer of reducing equivalents between NAD(H) and NADP(H) was included in the bioreaction network, because the pyridine nucleotide transhydrogenase has been shown to be active in E. coli (2). The malic enzyme in E. coli may be NAD+ or NADP+ dependent (32). While our analysis could not distinguish between fluxes through the two isoenzymes, the only influence of the enzyme was its influence on the flux of reducing equivalents via transhydrogenase. The flux distribution was calculated by assuming that the NAD+- and NADP+-dependent malic enzymes were equally active, and the influence of this assumption on the transhydrogenase flux was investigated.
Metabolic flux analysis was based on three different data sets: (i) substrate uptake and product formation rates; (ii) macromolecular biomass composition; and (iii) relative intensities of the 13C multiplet components of the aforementioned 48 carbon positions in amino acids, glycerol, and glucose determined by two-dimensional [13C, 1H]-COSY. The precursor requirements for biomass formation were derived from the biochemical information concerning biosynthetic pathways in E. coli (36) and the experimentally determined macromolecular composition.
The carbon flux distribution in the bioreaction network was then determined as a best fit to the three data sets by using a least-squares parameter-fitting approach in the mathematical framework, as described previously (52). Exchanges fluxes via reversible reactions were quantitatively considered in the flux calculation. Initially, the isotopomer balances of all metabolites in the bioreaction network were calculated from a randomly chosen flux distribution. Relative 13C multiplet intensities were then simulated from this isotopomer distribution and compared to the experimentally determined values. The quality of the fit was judged by the χ2 (error) value. Through an iterative process of data fitting, a flux solution corresponding to the minimal χ2 value was sought. To verify the global error minimum of the flux solution, multiple calculations were performed from different random starting points, and the best solution that was reproducibly attained was presented as the estimated result of flux distribution. A statistical error analysis of the estimated fluxes was included in the calculations. Moreover, the flux estimates were compared with the independently calculated flux ratios from flux ratio analysis to verify the reliability of flux estimates.
RESULTS
Growth parameters.
To investigate quantitatively the effects of pgi or zwf gene deletion on E. coli physiology, we grew E. coli wild-type strain W3110, strain BW25113, the phosphoglucose isomerase knockout (Pgi) mutant JWK3985, and the G6P dehydrogenase knockout (Zwf) mutant JWK1841 in aerobic chemostats at a dilution rate of 0.1 h−1 under glucose- or ammonia-limited conditions. The experimentally determined growth parameters are summarized in Table 2. The parent strain for the knockout mutants, BW25113, exhibited almost the same growth parameters as W3110 (data not shown). Under glucose-limited conditions, all the strains converted glucose completely to biomass and CO2 without any by-product formation, and the biomass yields on glucose were similar.
TABLE 2.
Growth parameters of glucose (C)- and ammonia (N)-limited chemostat cultures of E. coli wild-type strain W3110, the Pgi mutant, and the Zwf mutanta
| Chemostat conditions | Strain | YX/S (g g−1) | Glucose concn (mM) | Ammonium concn (mM) | qglucose (mmol g−1 h−1) | qO2 (mmol g−1 h−1) | qCO2 (mmol g−1 h−1) | qacetate (mmol g−1 h−1) | qpyruvate (mmol g−1 h−1) | qethanol (mmol g−1 h−1) | qα-ketoglutarate (mmol g−1 h−1) | qsuccinate (mmol g−1 h−1) | qfumarate (mmol g−1 h−1) | qEPS (mmol g−1 h−1) | C balance (%) |
|---|---|---|---|---|---|---|---|---|---|---|---|---|---|---|---|
| C limited | W3110 | 0.40 ± 0.03 | <0.1 | 38.0 ± 3.4 | 1.4 ± 0.1 | 4.0 ± 0.7 | 4.2 ± 0.4 | 0 | 0 | 0 | 0 | 0 | 0 | 0 | 99 ± 7 |
| Pgi mutant | 0.43 ± 0.03 | <0.1 | 37.1 ± 3.3 | 1.3 ± 0.1 | 3.9 ± 0.7 | 3.7 ± 0.4 | 0 | 0 | 0 | 0 | 0 | 0 | 0 | 97 ± 7 | |
| Zwf mutant | 0.42 ± 0.03 | <0.1 | 37.4 ± 3.3 | 1.4 ± 0.1 | 3.7 ± 0.6 | 4.2 ± 0.4 | 0 | 0 | 0 | 0 | 0 | 0 | 0 | 103 ± 8 | |
| N limited | W3110 | 0.23 ± 0.02 | 8.3 ± 0.6 | <0.1 | 2.9 ± 0.3 | 7.1 ± 1.4 | 7.2 ± 0.9 | 1.60 ± 0.14 | 0.01 ± 0 | 0.02 ± 0 | 0.01 ± 0 | 0 | 0.03 ± 0 | 0.04 ± 0 | 93 ± 9 |
| Pgi mutant | 0.39 ± 0.03 | 15.4 ± 1.3 | <0.1 | 1.6 ± 0.2 | 3.8 ± 0.7 | 4.0 ± 0.4 | 0.31 ± 0 | 0 | 0 | 0 | 0 | 0 | 0 | 97 ± 7 | |
| Zwf mutant | 0.20 ± 0.02 | 7.1 ± 0.5 | <0.1 | 2.8 ± 0.3 | 3.0 ± 0.6 | 3.1 ± 0.4 | 2.71 ± 0.23 | 0.71 ± 0 | 0.03 ± 0 | 0 | 0.01 ± 0 | 0.01 ± 0 | 0.16 ± 0 | 95 ± 7 |
Chemostat cultures were operated at a dilution rate of 0.1 h−1. YX/S, biomass yield on glucose; q, specific substrate uptake rate or product formation rate; EPS, extracellular polysaccharide. The levels of formate and d-lactate were below the detection levels in all experiments.
When ammonia- and glucose-limited cultures were compared, a significant increase in the specific glucose uptake rate and a drastically reduced biomass yield were observed for both wild-type E. coli and the Zwf mutant, while only a slight reduction in biomass yield was observed for the Pgi mutant. The specific oxygen uptake rate and the carbon dioxide evolution rate of wild-type E. coli were higher under ammonia-limited conditions than under glucose-limited conditions. This indicated that increased respiration was one response to ammonia limitation, a phenomenon which has been described for other organisms (10, 28). Formation of by-products by so-called overflow metabolism was observed for the ammonia-limited cultures of all the strains. The primary by-product was acetate, but various amounts of pyruvate, fumarate, ethanol, α-ketoglutarate, succinate, and extracellular polysaccharide were also found. The specific rates of production of acetate and pyruvate were lowest in the Pgi mutant and highest in the Zwf mutant.
To obtain accurate information on the specific precursor requirements for subsequent flux analysis, we determined the relative fractions of the major biomass components of E. coli: protein, RNA, and glycogen (Table 3). As expected, the reserve carbohydrate glycogen content was markedly increased under ammonia-limited conditions. The remaining fraction of biomass was assigned to minor macromolecules, such as DNA, lipids, or peptidoglycan (8).
TABLE 3.
Protein, RNA, and glycogen contents of glucose (C)- and ammonia (N)-limited chemostat cultures of E. coli wild-type strain W3110, the Pgi mutant, and the Zwf mutant
| Chemostat conditions | Strain | % of total
|
||
|---|---|---|---|---|
| Protein | RNA | Glycogen | ||
| C limited | W3110 | 70 ± 7 | 7 ± 1 | 1.4 ± 0.1 |
| Pgi mutant | 69 ± 8 | 8 ± 1 | 2.1 ± 0.2 | |
| Zwf mutant | 67 ± 7 | 8 ± 1 | 1.8 ± 0.2 | |
| N limited | W3110 | 58 ± 6 | 9 ± 1 | 11 ± 1 |
| Pgi mutant | 56 ± 7 | 7 ± 1 | 15 ± 1 | |
| Zwf mutant | 63 ± 8 | 10 ± 1 | 4.8 ± 0.5 | |
Identification of network structure in E. coli W3110.
The cells from [U-13C]glucose labeling experiments were harvested and subjected to hydrolysis, and the relative intensities of 13C-13C scalar coupling multiplet components of amino acids, glycerol, and glucose in hydrolysates were analyzed by two-dimensional [13C, 1H]-COSY (Fig. 2). The data were first interpreted by using flux ratio analysis, which yielded information on the origins of key metabolites in the central metabolism (Table 4). The results of flux ratio analysis allowed us to identify the network of active reactions and to determine the ratios of some carbon fluxes.
FIG. 2.

13C-13C scalar coupling multiplets observed for aspartate from glucose-limited chemostat cultures of E. coli W3110 (left) and the Pgi mutant (right). The signals were extracted from the ω1(13C) cross sections in the [13C,1H]-COSY spectra. (A) Asp-α; (B) Asp-β. As indicated in panel A, the multiplets consist of a singlet (s), a doublet with a small coupling constant (Da), a doublet split by a larger coupling constant (db), and a doublet of doublets (dd). Aspartate corresponds directly to its metabolic precursor, oxaloacetate (OAA).
TABLE 4.
Origins of metabolic intermediates in glucose (C)- and ammonia (N)-limited chemostat cultures of E. coli wild-type strain W3110, the Pgi mutant, and the Zwf mutant as determined by flux ratio analysis
| Chemostat conditions | Strain | % of total poola
|
|||||||||||
|---|---|---|---|---|---|---|---|---|---|---|---|---|---|
| G6P from F6P | P5P from G6P (lower boundary) | P5P via nonoxidative PP pathway | PEP from OAA | Pyruvate via ED pathway | Pyruvate from malate (lower boundary) | Pyruvate from malate (upper boundary) | Acetyl coenzyme A from pyruvate | AKG from OAA plus acetyl coenzyme A | OAA from PEP | OAA exchanged to fumarate | OAA via glyoxylate shunt | ||
| C limited | W3110 | >58 | 9 ± 2 | ND | 28 ± 3 | ND | 2 ± 2 | 8 ± 4 | >98 | >97 | 55 ± 2 | 76 ± 10 | —b |
| Pgi mutant | 0 ± 2 | 47 ± 9 | ND | 24 ± 3 | 6 ± 4 | 0 ± 2 | 0 ± 2 | >98 | >99 | 29 ± 2 | 86 ± 14 | 57 ± 16 | |
| Zwf mutant | >35 | 0 ± 2 | >94 | 23 ± 3 | ND | 4 ± 2 | 15 ± 4 | >98 | >98 | 43 ± 2 | 81 ± 12 | —b | |
| N limited | W3110 | >56 | 4 ± 2 | ND | 10 ± 3 | ND | 4 ± 2 | 14 ± 4 | >98 | >97 | 53 ± 2 | 81 ± 10 | —b |
| Pgi mutant | 0 ± 2 | 37 ± 8 | ND | 8 ± 2 | 11 ± 7 | 0 ± 2 | 0 ± 2 | >99 | >98 | 18 ± 2 | 50 ± 15 | 20 ± 12 | |
| Zwf mutant | >38 | 0 ± 2 | >95 | 0 ± 2 | ND | 4 ± 2 | 27 ± 8 | >98 | >98 | 85 ± 2 | 60 ± 6 | —b | |
F6P, fructose 6-phosphate; OAA, oxaloacetate; AKG, α-ketoglutarate; ND, not determined.
The glyoxylate shunt was found to be inactive in W3110 and the Zwf mutant, because equations 1 were satisfied within experimental error. In these cases the ratios calculated with equations 3 have very large errors due to division by a very small number.
In agreement with previous results (50), the flux ratio analysis of W3110 showed the activities of two enzymes that are generally considered to be inactive in E. coli grown on glucose, PEP carboxykinase and malic enzyme. These enzymes catalyze the gluconeogenic conversion of oxaloacetate to PEP and the conversion of malate to pyruvate, respectively (Fig. 1). The anaplerotic PEP carboxylase replenished the TCA cycle in wild-type E. coli, and more than one-half of the oxaloacetate molecules were found to originate from PEP (Table 4).
The glyoxylate shunt consisting of isocitrate lyase and malate synthase was found to be inactive in W3110. This result was obtained based on analysis of the intact carbon fragments for Asp-α, Asp-β, Phe-α, Glu-β, and Glu-γ (f values are shown in Table 5), which were derived from C-2 and C-3 of oxaloacetate, C-2 of PEP, and C-3 and C-4 of α-ketoglutarate, respectively. The f values for these carbon positions were found to satisfy the relationship shown in equations 1 within experimental error, demonstrating that oxaloacetate was synthesized exclusively from the TCA cycle and the anaplerotic carboxylation of PEP. Identification of the ED pathway activity by using equations 6 and 7 required the labeling data for G6P C-2 that could be assessed by using glucose C-2. Unfortunately, the 13C multiplet pattern of glucose C-2 could not be evaluated because of strong 13C-13C scalar coupling effects. Thus, in this analysis we could not exclude the possibility that the ED pathway makes a minor contribution to glucose catabolism in W3110. Because the ED pathway has been shown to be inactive in wild-type E. coli grown with glucose in many studies (17, 19), it was not considered in the metabolic network used for W3110.
TABLE 5.
Relative abundances of intact carbon fragments at the carbon positions used for identification of the glyoxylate shunt activity in E. coli wild-type strain W3110 and the Pgi mutant with equations 1 and 3a
| Carbon atom | Relative abundance
|
|||||||
|---|---|---|---|---|---|---|---|---|
| W3110b
|
Pgi mutantb
|
|||||||
| f(1) | f(2a) | f(2b) | f(3) | f(1) | f(2a) | f(2b) | f(3) | |
| Asp-α | 0.24 | 0.23 | 0.32 | 0.21 | 0.28 | 0.14 | 0.50 | 0.08 |
| Asp-β | 0.25 | 0.33 | 0.29 | 0.13 | 0.28 | 0.20 | 0.46 | 0.06 |
| Phe-α | 0.11 | 0.18 | 0.09 | 0.62 | 0.11 | 0.31 | 0.12 | 0.46 |
| Glu-βc | 0.54 | 0.46 | 0.00 | 0.75 | 0.25 | 0.00 | ||
| Glu-γ | 0.22 | 0.00 | 0.78 | 0.00 | 0.20 | 0.00 | 0.80 | 0.00 |
| Leu-α | 0.22 | 0.00 | 0.78 | 0.00 | 0.19 | 0.00 | 0.81 | 0.00 |
The denotations of f are explained in Table A1. The f values were calculated from I values with equations A1 and A2.
Glucose-limited cultures of both strains were used.
Glu-β has scalar coupling constants identical to those of the adjacent carbons.
When ammonia- and glucose-limited cultures were compared, ammonia limitation was found to induce the following metabolic responses in wild-type E. coli: (i) a decrease in the amount of PEP molecules originating from oxaloacetate, indicating decreased in vivo activity of the PEP carboxykinase; and (ii) a decrease in the amount of P5P molecules derived from G6P, which suggested low activity of the oxidative PP pathway assuming that the exchanges via transketolase and transaldolase did not differ significantly (Table 4). The flux ratios obtained for W3110 were almost identical to those of parent strain BW25113 used for knockout mutations (data not shown), demonstrating that there were few interstrain differences in central carbon metabolism. The only exception was the fraction of oxaloacetate molecules originating from PEP, which was 47% in glucose-limited strain BW25113. This difference was very small compared to the changes arising from knockout mutations.
Identification of network structure in the Pgi mutant.
The flux ratio analysis of the Pgi mutant revealed the absence of G6P molecules derived from fructose 6-phosphate through the phosphoglucose isomerase reaction (Table 4). This information was obtained from direct interpretation of the 13C-13C scalar coupling fine structure of glucose C-4 in the [13C, 1H]-COSY spectra. As Fig. 3 shows, the scalar coupling multiplets of glucose C-4, which was used to assess the labeling pattern of G6P, showed that the doubletwas not present in the Pgi mutant, demonstrating the lack of C-3-C-4 and C-4-C-5 carbon bond cleavage in G6P. However, in wild-type E. coli, a significant fraction of the C-3-C-4 carbon bonds in fructose 6-phosphate were cleaved due to the action of the PP pathway, and this carbon bond cleavage was introduced into the G6P pool by the phosphoglucose isomerase reaction. Hence, a significant contribution of the doublet to the multiplets of glucose C-4 was observed for W3110 (Fig. 3), reflecting the cleavage of C-3-C-4 bonds in G6P introduced by the active phosphoglucose isomerase reaction. This result indicated that in the Pgi mutant, the phosphoglucose isomerase was inactive in vivo, and the labeled substrate, glucose, was the sole source of G6P. The in vitro enzyme activity measurements also confirmed that no phosphoglucose isomerase could be detected in the crude extract of the Pgi mutant.
FIG. 3.

13C-13C scalar coupling multiplets observed for C-4 of glucose from ammonia-limited chemostat cultures of E. coli W3110 (left) and the Pgi mutant (right). The signals were extracted from the ω1(13C) cross sections in the [13C,1H]-COSY spectra. As glucose C-4 exhibits scalar coupling constants identical to those of the adjacent carbons, the multiplets consist of a singlet (s), a doublet (d), and a triplet (t). The labeling data for glucose represent the labeling patterns of G6P.
A decrease in the fraction of oxaloacetate molecules originating from PEP was observed for the Pgi mutant compared to the fraction for the wild-type strain (Table 4). This could be qualitatively assessed from direct inspection of the 13C-13C scalar coupling fine structure of Asp-α (Fig. 2). The abundances of the doublet with a small coupling constant and the doublet of doublets in the multiplets of Asp-α were related to the oxaloacetate molecules (the direct precursors of Asp) that possessed intact C-2-C-3 connectivities. Since the intact C-2-C-3 fragments in oxaloacetate can be introduced only by the anaplerotic reaction of PEP carboxylation, the abundances of the doublet with a small coupling constant and the doublet of doublets reflected the in vivo activity of the PEP carboxylase. The abundances of the doublet with a small coupling constant and the doublet of doublets were significantly lower for the Pgi mutant than for the wild-type E. coli strain (Fig. 2), showing that a smaller fraction of oxaloacetate molecules was synthesized from the anaplerotic reaction of PEP carboxylation in this mutant.
The glyoxylate shunt was found to be active in the Pgi mutant by flux ratio analysis (Table 4). Visual inspection of the scalar coupling fine structures of Asp-α and Asp-β revealed a surprisingly high abundance of the doublet split by a larger coupling constant for the Pgi mutant (Fig. 2). The analysis of the intact carbon fragments from Asp-α, Asp-β, Phe-α, Glu-β, and Glu-γ (f values are shown in Table 5) showed that the f(2b)(Asp-α) and f(2b)(Asp-β) values were significantly higher than the values calculated for f(2b)(Phe-α), f(2)(Glu-β), and f(2b)(Glu-γ) with equations 1. This indicated that the intact C-1-C-2 and C-3-C-4 fragments in the oxaloacetate pool could not be derived entirely from the TCA cycle and PEP carboxylation and that excess intact C-1-C-2 and C-3-C-4 connectivities were introduced via the glyoxylate shunt. Therefore, the flux ratio analysis provided evidence of the in vivo activity of the glyoxylate shunt, which is normally required for growth on carbon sources, such as acetate or fatty acids, and is generally considered to be repressed in E. coli grown on glucose (5). Consistently, in vitro enzyme activity analysis also confirmed that no isocitrate lyase could be detected in wild-type E. coli, while the Pgi mutant exhibited an isocitrate lyase activity of 197 nmol mg of protein−1 min−1. By calculating with equations 3 and the f values of Asp-α, Asp-β, Phe-α, Glu-β, Glu-γ, and Leu-α (Table 5), we found that more than one-half of the oxaloacetate molecules were formed via the glyoxylate shunt in the glucose-limited culture of the Pgi mutant (Table 4).
The flux ratios in the Pgi mutant also showed that the ED pathway made a minor contribution to glucose catabolism (Table 4). Three carbon positions carry the information necessary to identify the activity of the ED pathway (Table 6): Phe-α is derived from C-2 of PEP, and Ala-α and Val-α are derived from C-2 of pyruvate. The f values of Ala-α and Val-α fulfill the following relationship: f(2b)(Val-α) = f(2b)(Ala-α) + f(3)(Ala-α). Using equations 6 and 7 for identification of the ED pathway activity required the f values for G6P C-2 and the flux via the malic enzyme. As described above, the G6P molecules in the Pgi mutant originated solely from the labeled substrate, glucose, so that f(3)(G6P C-2) = 1. The flux through the malic enzyme was negligible in the Pgi mutant (Table 4). Thus, according to equations 6 and 7, the ED pathway was found to account for about 6 and 11% of the pyruvate molecules synthesized in the glucose- and ammonia-limited Pgi mutant, respectively (Table 4).
TABLE 6.
Relative abundances of intact carbon fragments at the carbon positions used for identification of the ED pathway activity in glucose (C)- and ammonia (N)-limited cultures of the Pgi mutant with equations 6 and 7a
| Carbon atom | Relative abundance
|
|||||||
|---|---|---|---|---|---|---|---|---|
| C-limited culture
|
N-limited culture
|
|||||||
| f(1) | f(2a) | f(2b) | f(3) | f(1) | f(2a) | f(2b) | f(3) | |
| Phe-α | 0.11 | 0.31 | 0.12 | 0.46 | 0.08 | 0.28 | 0.04 | 0.60 |
| Ala-α | 0.10 | 0.29 | 0.12 | 0.49 | 0.08 | 0.24 | 0.04 | 0.64 |
| Val-α | 0.39 | 0.00 | 0.61 | 0.00 | 0.30 | 0.00 | 0.70 | 0.00 |
The denotations of f are explained in Table A1. The f values were calculated from I values with equations A1 and A2.
Identification of network structure in the Zwf mutant.
The flux ratio analysis of the Zwf mutant showed that two biosynthetic precursors, P5P and E4P, were synthesized from triose 3-phosphate and fructose 6-phosphate via the nonoxidative part of the PP pathway (Table 4). The labeling patterns of P5P and E4P were assessed by using the labeling data for histidine and the aromatic ring of tyrosine, respectively. Generally, both the oxidative and nonoxidative branches of the PP pathway may contribute to the synthesis of these two precursor metabolites. Analysis of the intact carbon fragments for His-α, His-β, Tyr-δx, glycerol C-2, and Tyr-β (f values are shown in Table 7) showed that the relationships in equations 8 were satisfied within experimental error for the Zwf mutant. This result indicated that the nonoxidative branch of the PP pathway was used only for synthesis of the precursors and that the oxidative branch consisting of G6P dehydrogenase and 6-phosphogluconate dehydrogenase was inactive. The 6-phosphogluconate dehydrogenase activity was not disrupted in the Zwf mutant and was found to be comparable to that in wild-type E. coli by our in vitro enzyme activity analysis (data not shown). Consequently, the G6P dehydrogenase was inactive in vivo in the Zwf mutant. Also, the possibility that there is an active ED pathway could be ruled out for this mutant strain.
TABLE 7.
Relative abundances of intact carbon fragments at the carbon positions used for identification of the origin of P5P and E4P pools in glucose (C)- and ammonia (N)-limited cultures of the Zwf mutant with equation 8a
| Carbon atom | Relative abundance
|
|||||||
|---|---|---|---|---|---|---|---|---|
| C-limited culture
|
N-limited culture
|
|||||||
| f(1) | f(2a) | f(2b) | f(3) | f(1) | f(2a) | f(2b) | f(3) | |
| His-α | 0.10 | −0.01 | 0.20 | 0.71 | 0.09 | −0.01 | 0.14 | 0.78 |
| His-β | 0.26 | 0.69 | 0.00 | 0.05 | 0.16 | 0.78 | 0.00 | 0.06 |
| Tyr-δxb,c | 0.14 | 0.86 | 0.00 | 0.06 | 0.94 | 0.00 | ||
| Glycerol C-2c | 0.12 | 0.19 | 0.69 | 0.08 | 0.13 | 0.79 | ||
| Tyr-β | 0.22 | 0.78 | 0.00 | 0.00 | 0.08 | 0.92 | 0.00 | 0.00 |
The denotations of f are explained in Table A1. The f values were calculated from I values with equations A1 and A2.
The two carbons of Tyr, δ1 and δ2, give rise to only one 13C fine structure.
Tyr-δx and glycerol C-2 have scalar coupling constants identical to those of the adjacent carbons.
When the Zwf mutant was compared with W3110 in glucose-limited cultures, very similar flux ratio results were obtained (Table 4). The glyoxylate shunt was also found to be inactive in the Zwf mutant. These results suggested that inactivation of G6P dehydrogenase did not have a significant influence on the central carbon metabolism. However, under ammonia-limited conditions, the Zwf mutant exhibited a flux ratio pattern that was very different from that of the wild-type strain (Table 4). (i) A significant increase in the fraction of oxaloacetate molecules originating from PEP was observed, demonstrating that there was an increased contribution from anaplerotic PEP carboxylation and a corresponding decrease in the TCA cycle activity. As described above, this information was obtained from inspection of the scalar coupling multiplets of Asp-α. The levels of the doublet with a small coupling constant and the doublet of doublets in the multiplets of Asp-α were significantly higher in the ammonia-limited culture of the Zwf mutant than in the W3110 culture (Fig. 4). This result suggested that in the ammonia-limited Zwf mutant, the TCA cycle operated predominantly for the generation of biosynthetic precursor metabolites and to a lesser extent for ATP generation via oxidative phosphorylation. (ii) The PEP molecules arising from oxaloacetate were absent, indicating that there was negligible activity of the PEP carboxykinase in vivo. (iii) There was an increase in the amount of pyruvate molecules derived from malate, indicating that there was increased activity of the malic enzyme. (iv) The fraction of oxaloacetate molecules that were reversibly interconverted to fumarate was reduced (Table 4).
FIG. 4.

13C-13C scalar coupling multiplets observed for Asp-α from ammonia-limited chemostat cultures of E. coli W3110 (left) and the Zwf mutant (right). The signals were extracted from the ω1(13C) cross sections in the [13C,1H]-COSY spectra. See the legend to Fig. 2 for definitions of multiplet components. Aspartate corresponds directly to its metabolic precursor, oxaloacetate (OAA).
Quantification of intracellular metabolic fluxes.
To obtain higher resolution of the intracellular fluxes, the extracellular flux data (Table 2), the biomass composition data (Table 3), and the relative intensities of 13C-13C scalar coupling multiplet components (data not shown) were combined for flux quantification by using metabolic flux analysis. Based on the results of flux ratio analysis, the reactions catalyzed by PEP carboxykinase and malic enzyme were included in the bioreaction network for flux analysis. Moreover, the glyoxylate shunt and the ED pathway were considered for quantification of the intracellular fluxes in the Pgi mutant, because flux ratio analysis provided direct evidence for the activity of these pathways. By using isotopomer balances of all metabolites in the bioreaction network, a mathematical framework relating the intracellular fluxes to the available measurement data was constructed. The intracellular carbon flux distribution was then determined as the best fit to all data by using a parameter-fitting approach.
The intracellular fluxes determined represent estimates for in vivo enzyme activities. BW25113 and W3110 exhibited very similar flux distributions (data not shown). The intracellular flux distributions in wild-type E. coli were found to depend strongly on the limiting nutrient (Fig. 5A and B). Changing the limiting nutrient from glucose to ammonia resulted in a reduced flux through the oxidative branch of the PP pathway, so that the contribution of the EMP pathway to glucose catabolism was increased. This result is consistent with the flux ratio analysis results and previous findings (14, 38). Moreover, the gluconeogenic flux from oxaloacetate to PEP via the PEP carboxykinase was significantly lower, whereas the malic enzyme flux from malate to pyruvate was higher under ammonia-limited conditions than under glucose-limited conditions.
FIG. 5.


Metabolic flux distribution in chemostat cultures of E. coli W3110 under glucose-limited conditions (A) and ammonia-limited conditions (B), the Pgi mutant under glucose-limited conditions (C) and ammonia-limited conditions (D), and the Zwf mutant under glucose-limited conditions (E) and ammonia-limited conditions (F). The chemostats were operated at a dilution rate of 0.1 h−1. The numbers in rectangles are the net fluxes determined. The flux values are expressed relative to the specific glucose uptake rate, which is indicated in parentheses (in millimoles per gram [dry weight] per hour). The arrows indicate the directions of the fluxes determined. The numbers in ellipses are the fluxes for withdrawal of precursor metabolites for biomass formation. For abbreviations, see the legend to Fig. 1.
The flux ratio analysis provided qualitative or semiquantitative evidence that knockout of phosphoglucose isomerase in E. coli resulted in activation of the glyoxylate shunt. To quantitatively investigate the metabolic flux responses to the knockout, the intracellular flux distribution in the Pgi mutant was quantified. The constraint on the flux through phosphoglucose isomerase was included in the computation, because this enzyme was determined to be inactive in vivo in the Pgi mutant by the flux ratio analysis.
As Fig. 5C and D show, the glyoxylate shunt was activated, and the flux through the isocitrate dehydrogenase in the TCA cycle was significantly lower in the Pgi mutant than in W3110 under both limiting conditions investigated. In wild-type E. coli, isocitrate was metabolized exclusively in the TCA cycle to generate energy and reducing power (Fig. 5A and B). In the Pgi mutant, however, a significant fraction of isocitrate entered the glyoxylate shunt; 59% of the isocitrate was funneled into the glyoxylate shunt, and 41% was converted to α-ketoglutarate by the isocitrate dehydrogenase under glucose-limited conditions (Fig. 5C). The malate formed by the glyoxylate shunt served to replenish the carbon skeletons withdrawn from the TCA cycle for biosynthesis. The flux through the anaplerotic PEP carboxylase, which served solely to replenish the TCA cycle in wild-type E. coli (Fig. 5A and B), was decreased remarkably in the Pgi mutant (Fig. 5C and D). These results indicated that disruption of the phosphoglucose isomerase in E. coli resulted in alterations in cellular anaplerotic metabolism.
In the Pgi mutant, the ED pathway accounted for 5 and 13% of the glucose catabolic flux under glucose- and ammonia-limited conditions, respectively (Fig. 5C and D). Hence, the ED pathway was used to a limited extent, and the PP pathway was the primary route for glucose catabolism. A similar observation was made with other phosphoglucose isomerase-deficient E. coli strains (2, 16, 19). The transhydrogenase flux converting NADPH to NADH was found to be significantly higher in the Pgi mutant than in W3110 (Fig. 5C and D), suggesting that the transhydrogenase played an important role in redox metabolism in this mutant.
The flux distributions in the glucose- and ammonia-limited Zwf mutant are shown in Fig. 5E and F. The constraint on the flux through G6P dehydrogenase was included in the flux calculations, because the flux ratio analysis provided direct evidence of the inactivation of this enzyme in vivo in the Zwf mutant. Under both limiting conditions investigated, G6P dehydrogenase deficiency resulted in exclusive glucose catabolism through the EMP pathway, synthesis of P5P and E4P via the nonoxidative PP pathway, and the transhydrogenase flux converting NADH to NADPH. The fluxes through other parts of metabolism were remarkably similar in the glucose-limited cultures of the Zwf mutant and W3110 (Fig. 5E). However, under ammonia-limited conditions, the inactivation of G6P dehydrogenase drastically altered the flux distribution (Fig. 5F). Most strikingly, the TCA cycle flux was reduced to an extremely low level, and a reverse flux through the malate dehydrogenase converted oxaloacetate to malate. Moreover, the ammonia-limited Zwf mutant exhibited surprisingly high fluxes of secretion of acetate and pyruvate. In addition, the flux through the PEP carboxykinase was negligible, while the malic enzyme flux was increased in the ammonia-limited Zwf mutant.
The flux estimates in Fig. 5 were obtained from at least 10 independent flux calculations, which were initiated from different random starting points. The independently calculated flux solutions turned out to be very similar, and the flux solutions with the lowest χ2 values are shown in Fig. 5; under glucose- and ammonia-limited conditions, these χ2 values were 62 and 136, respectively, for W3110, 76 and 185, respectively, for the Pgi mutant, 132 and 89, respectively, for the Zwf mutant. Since the 95% confidence level of the χ2 value in this type of experiments is around 120 (7), these χ2 values are remarkably good for analysis of a biological system. Therefore, the flux distributions determined can provide a reliable description of the behavior of the E. coli metabolic network.
The flux solutions were also subjected to statistical error analysis based on Monte Carlo simulations (40, 52). For most fluxes we obtained 90% confidence intervals that were less than 8% of the estimated flux, but the 90% confidence intervals for the oxidative PP and ED pathway fluxes were less than 25%. The transhydrogenase flux was obtained by assuming that the NAD+- and NADP+-dependent malic enzymes were equally active. For an entirely NAD+-dependent malic enzyme, the transhydrogenase flux would be decreased. However, when the transhydrogenase reaction was omitted from the network, the χ2 values of the corresponding flux solution increased remarkably, indicating that the transhydrogenase flux was indeed present in E. coli metabolism. Finally, the flux estimates were verified with the flux ratios that were independently calculated in the flux ratio analysis. For example, from the estimated flux distribution in the glucose-limited Pgi mutant (Fig. 5C), the fraction of oxaloacetate originating from PEP and the fraction of oxaloacetate formed via the glyoxylate shunt were calculated to be 29 and 58%, respectively. These values were in very good agreement with the flux ratio results shown in Table 4, providing further evidence of the reliability of our flux estimates.
DISCUSSION
The primary objective of this study was to quantitatively elucidate metabolic flux responses of E. coli to knockout mutations in the entrance to the EMP or PP pathway, phosphoglucose isomerase or G6P dehydrogenase. To do this, complementary methods, flux ratio analysis and metabolic flux analysis, based on [U-13C]glucose labeling experiments and two-dimensional NMR spectroscopy were used. The results showed that the split ratio of the PP pathway to the EMP pathway was about 29% in glucose-limited wild-type E. coli, and ammonia limitation induced a significant reduction in this split ratio (Fig. 5A and B). Disruption of phosphoglucose isomerase led to use of the PP pathway as the primary route of glucose catabolism (Fig. 5C and D). On the other hand, G6P dehydrogenase-deficient E. coli catabolized glucose exclusively through the EMP pathway and synthesized the two biosynthetic precursors, P5P and E4P, via the nonoxidative PP pathway (Fig. 5E and F). However, additional, unexpected flux responses to the knockout mutations were also found, which provided new insights into the behavior of the metabolic network in its entirety.
The glyoxylate shunt was unexpectedly activated upon knockout of phosphoglucose isomerase (Table 4; Fig. 5C and D). In the glucose-limited Pgi mutant, only a minor fraction of isocitrate was converted to α-ketoglutarate by isocitrate dehydrogenase in the TCA cycle, while the majority was metabolized via the glyoxylate shunt (Fig. 5C). This result is surprising because the glyoxylate shunt is generally considered to be inactive in E. coli grown on glucose. The activation of the glyoxylate shunt in the Pgi mutant can be explained based on the analysis of intracellular redox metabolism.
The flux results presented above provide a holistic perspective on intracellular metabolism and thus provide unique insight into the generation and consumption of the anabolic reducing power, NADPH (Fig. 6). In wild-type E. coli, the isocitrate dehydrogenase reaction was the major producer of NADPH, accounting for more than 60% of the NADPH production. In the Pgi mutant, the PP pathway, which was used as the primary glucose catabolic pathway, generated a large amount of NADPH. Overproduction of NADPH is deleterious, as a limited capacity for reoxidation of NADPH is one reason for the low growth rate of phosphoglucose isomerase-deficient E. coli (2). The Pgi mutant bypassed the isocitrate dehydrogenase reaction by redirecting carbon flow through the glyoxylate shunt, so that the amount of NADPH produced by the isocitrate dehydrogenase reaction was markedly decreased (Fig. 6). This reaction contributed to less than 20% of the NADPH production in the Pgi mutant. Therefore, activation of the glyoxylate shunt could reduce significantly the production of excess NADPH in the Pgi mutant that was limited in reoxidizing NADPH. NADPH and NADP+ have been identified as effectors that regulate the reversible phosphorylation or inactivation of isocitrate dehydrogenase in E. coli (25).
FIG. 6.

Specific rates of NADPH production and consumption in glucose (C)- and ammonia (N)-limited chemostat cultures of E. coli W3110, the Pgi mutant, and the Zwf mutant. NADPH production was contributed to by the oxidative PP pathway (solid bars), isocitrate dehydrogenase (cross-hatched bars), transhydrogenase (hatched bars), and malic enzyme (stippled bars). NADPH was consumed via biomass formation(stippled bars) and the transhydrogenase reaction (hatched bars).
The in vivo activity of the ED pathway was found to be low but not absent in the Pgi mutant (Table 4; Fig. 5C and D). Up to 13% of the glucose catabolism was catalyzed via the ED pathway (Fig. 5D). This result may also be explained by the limited capacity of the Pgi mutant for NADPH reoxidation. The flux through the ED pathway reduces concomitant excess NADPH formation from exclusive glucose catabolism via the PP pathway, which generates two NADPH molecules, compared to one NADPH molecule in the ED pathway per molecule of glucose catabolized.
The strong increase or decrease in the PP pathway flux in the Pgi and Zwf mutants apparently disturbed the balance of NADPH (Fig. 6). Hence, high transhydrogenase fluxes are needed to balance the reducing equivalents NADPH and NADH. In the Pgi mutant, a significant fraction of NADPH was converted to NADH by the transhydrogenase reaction. Thus, it appears that the transhydrogenase reaction plays an important role in maintaining the NADPH balance in phosphoglucose isomerase-deficient E. coli. Consistently, phosphoglucose isomerase knockout mutants of Saccharomyces cerevisiae, in which the transhydrogenase is absent, are blocked for growth on glucose (15). The reaction converting NADPH to NADH may be catalyzed by the soluble transhydrogenase UdhA, since a physiological role of this enzyme is the reoxidation of NADPH (1, 2). In the Zwf mutant, NADPH could not be supplied by the oxidative PP pathway (Fig. 6). The transhydrogenase reaction thus converted NADH to NADPH to satisfy the NADPH requirement for biomass formation. This reaction may be catalyzed by the membrane-bound energy-coupled transhydrogenase PntAB, as one of its metabolic functions is to provide NADPH for biosynthesis (46).
Disruption of G6P dehydrogenase was counteracted by local flux rerouting via the EMP and nonoxidative PP pathways under glucose-limited conditions (Fig. 5E). However, additional, significant flux changes in response to this knockout mutation were observed under ammonia-limited conditions (Fig. 5F). The ammonia-limited Zwf mutant exhibited extensive overflow metabolism and extremely low TCA cycle fluxes. The flux through the malate dehydrogenase was even reversed, which was usually encountered in anaerobic cultures. This flux response could have resulted from the cellular response to oxidative stress. For wild-type E. coli, the specific oxygen uptake rate was higher under ammonia-limited conditions than under glucose-limited conditions (Table 2), indicating that ammonia limitation induced the increased respiration activity. Because the respiration activity is linearly related to the rate of production of hydrogen peroxide (H2O2) in E. coli (22), the cells in an ammonia-limited culture are likely to encounter oxidative stress. In the Zwf mutant, the oxidative PP pathway could not produce NADPH, an essential reducing equivalent for the antioxidant system. Thus, the Zwf mutant was probably sensitive to oxidative stress, a phenomenon that has also been described for isocitrate dehydrogenase-deficient E. coli and G6P dehydrogenase-deficient S. cerevisiae (3, 27). The activities of the TCA cycle and respiration were reduced to extremely low levels, which could have decreased significantly the production of reactive by-products of oxygen in the ammonia-limited Zwf mutant.
Acknowledgments
Q. Hua and C. Yang contributed equally to this work.
We thank the reviewers for their helpful suggestions concerning the manuscript.
This work was supported by a grant from the New Energy and Industrial Technology Development Organization (NEDO) of the Ministry of Economy, Trade and Industry of Japan (Development of a Technological Infrastructure for Industrial Bioprocess Project).
APPENDIX
The abundances of intact carbon fragments originating from a single glucose source molecule (f values) were calculated from the observed relative 13C multiplet intensities (I values). Equation A1 was used for a terminal carbon atom, and equation A2 was used for the central carbon in a C3 fragment.
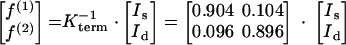 |
(A1) |
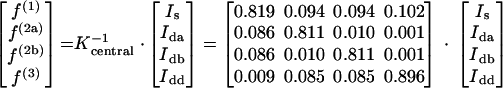 |
(A2) |
The components in the Kterm and Kcentral matrices were calculated with the probabilistic expressions described by Szyperski (42). The denotations of f are shown in Table A1.
Footnotes
For a commentary on this article, see page 7031 in this issue.
REFERENCES
- 1.Boonstra, B., C. E. French, I. Wainwright, and N. C. Bruce. 1999. The udhA gene of Escherichia coli encodes a soluble pyridine nucleotide transhydrogenase. J. Bacteriol. 181:1030-1034. [DOI] [PMC free article] [PubMed] [Google Scholar]
- 2.Canonaco, F., T. A. Hess, S. Heri, T. Wang, T. Szyperski, and U. Sauer. 2001. Metabolic flux response to phosphoglucose isomerase knock-out Escherichia coli and impact of overexpression of the soluble transhydrogenase UdhA. FEMS Microbiol. Lett. 204:247-252. [DOI] [PubMed] [Google Scholar]
- 3.Choi, I. Y., K. I. Sup, H. J. Kim, and J. W. Park. 2003. Thermosensitive phenotype of Escherichia coli mutant lacking NADP+-dependent isocitrate dehydrogenase. Redox Rep. 8:51-56. [DOI] [PubMed] [Google Scholar]
- 4.Christensen, B., A. K. Gombert, and J. Nielsen. 2002. Analysis of flux estimates based on 13C-labelling experiments. Eur. J. Biochem. 269:2795-2800. [DOI] [PubMed] [Google Scholar]
- 5.Cronan, J. E., Jr., and D. LaPorte. 1996. Tricarboxylic acid cycle and glyoxylate bypass, p. 206-216. In F. C. Neidhardt, R. Curtiss, J. L. Ingraham, E. C. C. Lin, K. B. Low, B. Magasanik, W. S. Reznikoff, M. Riley, M. Schaechter, and H. E. Umbarger (ed.), Escherichia coli and Salmonella: cellular and molecular biology, 2nd ed. ASM Press, Washington, D.C.
- 6.Datsenko, K. A., and B. L. Wanner. 2000. One-step inactivation of chromosomal genes in Escherichia coli K-12 using PCR products. Proc. Natl. Acad. Sci. USA 97:6640-6645. [DOI] [PMC free article] [PubMed] [Google Scholar]
- 7.Dauner, M., J. E. Bailey, and U. Sauer. 2001. Metabolic flux analysis with a comprehensive isotopomer model in Bacillus subtilis. Biotechnol. Bioeng. 76:144-156. [DOI] [PubMed] [Google Scholar]
- 8.Dauner, M., and U. Sauer. 2001. Stoichiometric growth model for riboflavin-producing Bacillus subtilis. Biotechnol. Bioeng. 76:132-143. [DOI] [PubMed] [Google Scholar]
- 9.Dauner, M., M. Sonderegger, M. Hochuli, T. Szyperski, K. Wüthrich, H. P. Hohmann, U. Sauer, and J. E. Bailey. 2002. Intracellular carbon fluxes in riboflavin-producing Bacillus subtilis during growth on two-carbon substrate mixtures. Appl. Environ. Microbiol. 68:1760-1771. [DOI] [PMC free article] [PubMed] [Google Scholar]
- 10.Dauner, M., T. Storni, and U. Sauer. 2001. Bacillus subtilis metabolism and energetics in carbon-limited and excess-carbon chemostat culture. J. Bacteriol. 183:7308-7317. [DOI] [PMC free article] [PubMed] [Google Scholar]
- 11.Deutsch, J. 1983. Glucose-6-phosphate dehydrogenase, p. 190-197. In J. Bergmeyer and M. Grassl (ed.), Methods of enzymatic analysis. 3rd ed., vol. 3. VCH, Weinheim, Germany.
- 12.Dieuaide-Noubhani, M., G. Raffard, P. Canioni, A. Pradet, and P. Raymond. 1995. Quantification of compartmented metabolic fluxes in maize root tips using isotope distribution from 13C- or 14C-labeled glucose. J. Biol. Chem. 270:13147-13159. [DOI] [PubMed] [Google Scholar]
- 13.Edwards, J. S., and B. O. Palsson. 2000. The Escherichia coli MG1655 in silico metabolic phenotype: its definition, characteristics, and capabilities. Proc. Natl. Acad. Sci. USA 97:5528-5533. [DOI] [PMC free article] [PubMed] [Google Scholar]
- 14.Emmerling, M., M. Dauner, A. Ponti, J. Fiaux, M. Hochuli, T. Szyperski, K. Wüthrich, J. E. Bailey, and U. Sauer. 2002. Metabolic flux responses to pyruvate kinase knockout in Escherichia coli. J. Bacteriol. 184:152-164. [DOI] [PMC free article] [PubMed] [Google Scholar]
- 15.Fiaux, J., Z. P. Cakar, M. Sonderegger, K. Wüthrich, T. Szyperski, and U. Sauer. 2003. Metabolic-flux profiling of the yeasts Saccharomyces cerevisiae and Pichia stipitis. Eukaryot. Cell 2:170-180. [DOI] [PMC free article] [PubMed] [Google Scholar]
- 16.Fischer, E., and U. Sauer. 2003. Metabolic flux profiling of Escherichia coli mutants in central carbon metabolism using GC-MS. Eur. J. Biochem. 270:880-891. [DOI] [PubMed] [Google Scholar]
- 17.Flores, S., G. Gosset, N. Flores, A. A. de Graaf, and F. Bolivar. 2002. Analysis of carbon metabolism in Escherichia coli strains with an inactive phosphotransferase system by 13C labeling and NMR spectroscopy. Metab. Eng. 4:124-137. [DOI] [PubMed] [Google Scholar]
- 18.Fraenkel, D. G. 1996. Glycolysis, p. 189-198. In F. C. Neidhardt, R. Curtiss III, J. L. Ingraham, E. C. C. Lin, K. B. Low, B. Magasanik, W. S. Reznikoff, M. Riley, M. Schaechter, and H. E. Umbarger (ed.), Escherichia coli and Salmonella: cellular and molecular biology 2nd ed. ASM Press, Washington, D.C.
- 19.Fraenkel, D. G., and S. R. Levisohn. 1967. Glucose and gluconate metabolism in an Escherichia coli mutant lacking phosphoglucose isomerase. J. Bacteriol. 93:1571-1578. [DOI] [PMC free article] [PubMed] [Google Scholar]
- 20.Goldberg, D. M., and G. Ellis. 1983. Isocitrate dehydrogenase, p. 183-190. In J. Bergmeyer and M. Grassl (ed.), Methods of enzymatic analysis, 3rd ed., vol. 3. VCH, Weinheim, Germany.
- 21.Gombert, A. K., M. M. dos Santos, B. Christensen, and J. Nielsen. 2001. Network identification and flux quantification in the central metabolism of Saccharomyces cerevisiae under different conditions of glucose repression. J. Bacteriol. 183:1441-1451. [DOI] [PMC free article] [PubMed] [Google Scholar]
- 22.González-Flecha, B., and B. Demple. Metabolic sources of hydrogen peroxide in aerobically growing Escherichia coli. J. Biol. Chem. 270:13681-13687. [DOI] [PubMed]
- 23.Herbert, D., P. J. Phipps, and R. E. Strange. 1971. Chemical analysis of microbial cells, p. 210-344. In J. R. Norris and D. W. Ribbons (ed.), Methods in microbiology. Academic Press, London, UK.
- 24.Hochuli, M., H. Patzelt, D. Oesterhelt, K. Wüthrich, and T. Szyperski. 1999. Amino acid biosynthesis in the halophilic archaeon Haloarcula hispanica. J. Baceteriol. 181:3226-3237. [DOI] [PMC free article] [PubMed] [Google Scholar]
- 25.Holm, W. H. 1986. The central metabolic pathways of Escherichia coli: relationship between flux and control at a branch point, efficiency of conversion to biomass, and excretion of acetate. Curr. Top. Cell. Regul. 28:69-105. [DOI] [PubMed] [Google Scholar]
- 26.Hua, Q., M. Araki, Y. Koide, and K. Shimizu. 2001. Effects of glucose, vitamins, and DO concentrations on pyruvate fermentation using Torulopsis glabrata IFO 0005 with metabolic flux analysis. Biotechnol. Prog. 17:62-68. [DOI] [PubMed] [Google Scholar]
- 27.Juhnke, H., B. Krems, P. Kotter, and K. D. Entian. 1996. Mutants that show increased sensitivity to hydrogen peroxide reveal an important role for the pentose phosphate pathway in protection of yeast against oxidative stress. Mol. Gen. Genet. 252:456-464. [DOI] [PubMed] [Google Scholar]
- 28.Larsson, C., U. von Stockar, I. Marrison, and L. Gustafsson. 1993. Growth and metabolism of Saccharomyces cerevisiae in chemostat cultures under carbon-, nitrogen-, or carbon- and nitrogen-limiting conditions. J. Bacteriol. 175:4809-4816. [DOI] [PMC free article] [PubMed] [Google Scholar]
- 29.Lowry, O. H., N. J. Rosebrough, A. J. Farr, and R. J. Randall. 1951. Protein measurement with the Folin phenol reagent. J. Biol. Chem. 193:265-275. [PubMed] [Google Scholar]
- 30.Maaheimo, H., J. Fiaux, Z. P. Cakar, J. E. Bailey, U. Sauer, and T. Szyperski. 2001. Central carbon metabolism of Saccharomyces cerevisiae explored by biosynthetic fractional 13C labeling of common amino acids. Eur. J. Biochem. 268:2464-2479. [DOI] [PubMed] [Google Scholar]
- 31.McFadden, B. A. 1969. Isocitrate lyase. Methods Enzymol. 13:163-170. [Google Scholar]
- 32.Murai, T., M. Tokushige, J. Nagai, and H. Katsuki. 1971. Physiological functions of NAD- and NADP-linked malic enzymes in Escherichia coli. Biochem. Biophys. Res. Commun. 43:875-881. [DOI] [PubMed] [Google Scholar]
- 33.Neijssel, O. M., M. J. Teixeira de Mattos, and D. W. Tempest. 1996. Growth yield and energy distribution, p. 1683-1692. In F. C. Neidhardt, R. Curtiss III, J. L. Ingraham, E. C. C. Lin, K. B. Low, B. Magasanik, W. S. Reznikoff, M. Riley, M. Schaechter, and H. E. Umbarger (ed.), Escherichia coli and Salmonella: cellular and molecular biology, 2nd ed. ASM Press, Washington, D.C.
- 34.Noronha, S. B., H. J. C. Yeh, T. F. Spande, and J. Shiloach. 2000. Investigation of the TCA cycle and the glyoxylate shunt in Escherichia coli BL21 and JM109 using 13C-NMR/MS. Biotechnol. Bioeng. 68:316-327. [PubMed] [Google Scholar]
- 35.Petersen, S., A. A. de Graaf, L. Eggeling, M. Mollney, W. Wiechert, and H. Sahm. 2000. In vivo quantification of parallel and bidirectional fluxes in the anaplerosis of Corynebacterium glutamicum. J. Biol. Chem. 275:35932-35941. [DOI] [PubMed] [Google Scholar]
- 36.Pramanik, J., and J. D. Keasling. 1997. Stoichiometric model of Escherichia coli metabolism: incorporation of growth-rate dependent biomass composition and mechanistic energy requirements. Biotechnol. Bioeng. 56:398-421. [DOI] [PubMed] [Google Scholar]
- 37.Sauer, U., V. Hatzimanikatis, J. E. Bailey, M. Hochuli, T. Szyperski, and K. Wüthrich. 1997. Metabolic fluxes in riboflavin-producing Bacillus subtilis. Nat. Biotechnol. 15:448-452. [DOI] [PubMed] [Google Scholar]
- 38.Sauer, U., D. R. Lasko, J. Fiaux, M. Hochuli, R. Glaser, T. Szyperski, K. Wüthrich, and J. E. Bailey. 1999. Metabolic flux ratio analysis of genetic and environmental modulations of Escherichia coli central carbon metabolism. J. Bacteriol. 181:6679-6688. [DOI] [PMC free article] [PubMed] [Google Scholar]
- 39.Schmidt, K., M. Carlsen, J. Nielsen, and J. Villadsen. 1997. Modeling isotopomer distributions biochemical networks using isotopomer mapping matrices. Biotechnol. Bioeng. 55:831-840. [DOI] [PubMed] [Google Scholar]
- 40.Schmidt, K., L. C. Norregaard, B. Pedersen, A. Meissner, J. O. Duus, J. Nielsen, and J. Villadsen. 1999. Quantification of intracellular metabolic fluxes from fractional enrichment and 13C-13C coupling constraints on the isotopomer distribution in labeled biomass components. Metab. Eng. 1:166-179. [DOI] [PubMed] [Google Scholar]
- 41.Stephanopoulos, G. 1999. Metabolic fluxes and metabolic engineering. Metab. Eng. 1:1-11. [DOI] [PubMed] [Google Scholar]
- 42.Szyperski, T. 1995. Biosynthetically directed fractional 13C-labeling of proteinogenic amino acids. An efficient analytical tool to investigate intermediary metabolism. Eur. J. Biochem. 232:433-448. [DOI] [PubMed] [Google Scholar]
- 43.Szyperski, T. 1998. 13C-NMR, MS and metabolic flux balancing in biotechnological research. Q. Rev. Biophys. 31:41-106. [DOI] [PubMed] [Google Scholar]
- 44.Szyperski, T., J. E. Bailey, and K. Wüthrich. 1996. Detecting and dissecting metabolic fluxes using biosynthetic fractional 13C labeling and two-dimensional NMR spectroscopy. Trends Biotechnol. 14:453-459. [Google Scholar]
- 45.Varma, A., and B. O. Palsson. 1994. Metabolic flux balancing: basic concepts, scientific, and practical use. Bio/Technology 12:994-998. [Google Scholar]
- 46.Voordouw, G., S. M. van der Vies, and A. P. N. Themmen. 1983. Why are two different types of pyridine nucleotide transhydrogenase found in living organisms? Eur. J. Biochem. 131:527-533. [DOI] [PubMed] [Google Scholar]
- 47.Wendisch, V. F., A. A. de Graaf, H. Sahm, and B. J. Eikmanns. 2000. Quantitative determination of metabolic fluxes during coutilization of two carbon sources: comparative analyses with Corynebacterium glutamicum during growth on acetate and/or glucose. J. Bacteriol. 182:3088-3096. [DOI] [PMC free article] [PubMed] [Google Scholar]
- 48.Wiechert, W. 2001. 13C metabolic flux analysis. Metab. Eng. 3:195-206. [DOI] [PubMed] [Google Scholar]
- 49.Williamson, J. R., and B. E. Corkey. 1969. Assays of intermediates of the citric acid cycle and related compounds of fluorometric enzyme methods. Methods Enzymol. 13:434-513. [Google Scholar]
- 50.Yang, C., Q. Hua, T. Baba, H. Mori, and K. Shimizu. 2003. Analysis of Escherichia coli anaplerotic metabolism and its regulation mechanisms from the metabolic responses to altered dilution rates and phosphoenolpyruvate carboxykinase knockout. Biotechnol. Bioeng. 84:129-144. [DOI] [PubMed]
- 51.Yang, C., Q. Hua, and K. Shimizu. 2000. Energetics and carbon metabolism during growth of microalgal cells under photoautotrophic, mixotrophic and cyclic light-autotrophic/dark-heterotrophic conditions. Biochem. Eng. J. 6:87-102. [DOI] [PubMed] [Google Scholar]
- 52.Yang, C., Q. Hua, and K. Shimizu. 2002. Quantitative analysis of intracellular metabolic fluxes using GC-MS and two-dimensional NMR spectroscopy. J. Biosci. Bioeng. 93:78-87. [PubMed] [Google Scholar]