Abstract
The antioxidant enzyme manganese superoxide dismutase (SOD2) serves as the primary defense against mitochondrial superoxide. Impaired SOD2 activity in murine hematopoietic cells affects erythroid development, resulting in anemia characterized by intra-mitochondrial iron deposition, reticulocytosis and shortened red cell life span. Gene expression profiling of normal and SOD2 deficient erythroblasts identified the Parkinson’s disease locus DJ-1 (Park7) as a differentially expressed transcript. To investigate the role of DJ-1 in hematopoietic cell development and protection against oxidative stress caused by Sod2 loss, we evaluated red cell parameters, reticulocyte count, red cell turnover and reactive oxygen species production in DJ-1 knockout animals and chimeric animals lacking both SOD2 and DJ-1 in hematopoietic cells generated by fetal liver transplantation. We also investigated DJ-1 protein expression in primary murine erythroid and erythroleukemia cells (MEL). Loss of DJ-1 exacerbates the phenotype of SOD2 deficiency, increasing reticulocyte count and decreasing red cell survival. Using MEL cells, we show that DJ-1 is up-regulated at protein level during erythroid differentiation. These results indicate that DJ-1 plays a physiologic role in protection of erythroid cells from oxidant damage, a function unmasked in the context of oxidative stress.
Keywords: DJ-1, SOD2, erythroblast, oxidative stress, Parkinson’s disease
Introduction
Endogenous reactive oxygen species, including (H2O2, O2−), are produced during many normal physiological process such as aerobic respiration in mitochondria. Excessive ROS cause damage to lipids, proteins, and both nuclear and mitochondrial DNA. ROS scavenging systems have evolved to protect organisms from oxidative damage. Among them, superoxide dismutases (SOD) are important enzymatic antioxidants that catalyze conversion of O2− to hydrogen peroxide and molecular oxygen. Hydrogen peroxide is then eliminated by catalase, glutathione peroxidases or peroxiredoxins. The mammalian SOD family is comprised of intracellular copper–zinc superoxide dismutase (Cu/ZnSOD; encoded by the Sod1 gene), mitochondria localized manganese superoxide dismutase (MnSOD; encoded by the Sod2 gene), and extracellular superoxide dismutase (ECSOD; encoded by the Sod3 gene). Of these 3 proteins/genes, only SOD2 is essential, with knockout mice dying in the late embryonic or early neonatal period with a phenotype consistent with a severe mitochondrial defect.
In order to investigate the function of SOD2 in the hematopoietic system, we have utilized fetal liver cells as a source of blood stem cells to reconstitute lethally irradiated congenic host animals. Loss of SOD2 selectively impairs erythroid lineage development and produces a constellation of pathologic findings similar to what is found in congenital or acquired sideroblastic anemia in humans. There is a profound effect on erythroid iron metabolism with deposition of excess iron within the mitochondria of developing erythroid cells—the characteristic pathologic finding in sideroblastic anemia. Additional abnormalities of erythroid cells include enhanced protein oxidation, reticulocytosis, increased ROS production in both reticulocytes and mature red cells, and reduced red cell life span.
In order to better understand how loss of SOD2 affects erythroid development, we compared the gene expression profiles of the normal and SOD2 deficient erythroblasts isolated from the marrow of recipient mice transplanted with either normal or SOD2 deficient fetal liver stem cells. Among differentially expressed transcripts we identified the Parkinson’s disease related gene DJ-1 (expression reduced 1.7-fold in Sod2−/− cells), also know as Park 7. Mutations in DJ-1 are associated with autosomal recessive early-onset Parkinson’s disease. While the function of DJ-1 protein remains uncertain, there are multiple reports suggesting a role for DJ-1 in protection against oxidative insult. DJ1 has homology to the peroxiredoxin family of thiol peroxidases and can operate as an antioxidant protein by shifting towards more acidic forms upon exposure to oxidative stress. DJ1 has been shown to stabilize the antioxidant transcription master regulator NRF2 and hypoxia-inducible factor-1 HIF1, and promotes cell survival by enhancing Akt phosphorylation and thus inhibiting PTEN function. Finally, at least a fraction of DJ-1 localizes to the mitochondria, where it interacts with and stabilizes components of complex I of the respiratory chain. DJ-1 expression and function in hematopoietic cells has not previously been evaluated. Here, we characterize the expression of DJ-1 protein during erythroid development, and examine the hematologic phenotype of DJ-1 knockout mice alone and in combination with loss of SOD2. While loss of DJ-1 by itself has no obvious hematologic phenotype, loss of DJ-1 exacerbates the erythroid defect in SOD2 deficient mice.
Materials and methods
Cell culture
MEL cells were grown in RPMI 1640 medium supplemented with 10% heat inactivated fetal calf serum. Cell differentiation was induced by addition of 2% DMSO for up to 5 days.
Cell Purification
Erythroblasts were isolated from bone marrow using Ter119 positive selection kit (Stemcell Technologies, Vancouver, BC). Briefly, bone marrow was isolated from femur and tibia, red cells were removed using red cell lysis buffer (Sigma. Cat# R7757), and Ter119 positive cells were enriched by positive selection. Purity was determined by Ter119 staining and FACS analysis. Cells were lysed and protein concentration determined by BCA method (Pierce. Cat# 23225). 50ug of protein was loaded for each lane for SDS-PAGE and western blot.
Packed red blood cells were prepared by dilution of whole blood 1:10 with cold normal saline followed by passage over microcrystalline cellulose to remove leukocytes. Red cells were recovered by centrifugation and washed twice to remove residual plasma proteins and platelets.
Fetal liver transplantation and production of hematopoietic chimeric mice
DJ1−/− / Sod2−/− fetal liver cells were obtained by interbreeding DJ1−/− / Sod2+/− animals. The breeding scheme is as follows: DJ1−/− mice (from V. Dawson lab at Johns Hopkins University) were bred with Sod2+/− mice to generate DJ1+/− / Sod2+/− mice. DJ1+/− / Sod2+/− mice were interbred to generate DJ1−/− / Sod2+/− mice. The DJ1−/− / Sod2+/− mice were used to generate DJ1−/− / Sod2−/− mice. E13.5–15.5 pups were genotyped by PCR screening using separate protocols for the SOD2 and DJ1 alleles as previously described (,). WT, DJ1−/−, Sod2−/−, DJ1−/−Sod2−/−(DKO) fetal liver cells were used for transplantation. (In some experiments, Sod2+/− cells were used as controls. We have previously shown Sod2+/− cells are equivalent to WT in transplantation assays) (). Transplantation was performed as previously described (). Reconstitution was tested by CD45.1 VS CD45.2 staining of white cells in peripheral blood. All recipient animals were B6.CD45.1 congenics, and all fetal liver donors were B6 (CD45.2).
Western blot and protein carbonylation detection by oxyblot
Cells were washed twice in PBS, re-suspended in lysis buffer containing 50mM Tris HCl pH 7.5, 10 mM EDTA, 150 mM NaCl, 1.5% NP-40, plus protease inhibitors. The lysate was sonicated and then centrifuged for 15 min at 10,000 × g. Protein concentration was determined by BCA Protein Assay Reagent (Pierce). For each extract 30 µg of total cellular protein were resolved by 4–12% SDS-PAGE. Separated proteins were transferred to PVDF membranes. Membranes were blocked with 5% non-fat milk in TBS/0.05% Tween 20 (TBST). Membranes were then incubated overnight at 4°C with anti-DJ1 (1:1000, Santa Cruz) in TBST/3%BSA. Subsequently, membranes were incubated with anti-goat (1:5000, Promega) antibody conjugated with horseradish peroxidase (HRP) for 1 h at room temperature. All the steps were followed by 3 washes for 15 min in TBST. The protein bands were detected by ECL protocol (Pierce) using autoradiography film. Carbonyl detection was carried out using the Oxyblot kit according to the instructions of the manufacturer (Chemicon. Cat# S7150).
Fluorescence measurement of intracellular ROS production
To measure intracellular ROS production, 2 µl peripheral blood from the transplanted mice was washed with FACS wash buffer (5% BSA, 2 µM EDTA in PBS), re-suspended in 100 µl pre-warmed RPMI medium (without phenol red), and incubated at 37°C 5% CO2, for 30 minutes to equilibrate. Cells were then incubated with CM-H2DCFDA (2 µM) and Dihydroethidium (10 µM) for an additional 30 minutes at 37°C. Cells were washed with ice cold FACS wash buffer, followed by analysis on a FacsCalibur flow cytometer.
Complete Blood and Reticulocyte Counts
2.5µl of whole-blood were incubated with 500 ul Retic-count reagent (BD-Biosciences, San Jose, CA) or 500 µl PBS at room temperature for 30 min in the dark. After incubation, samples were immediately read on a flow cytometer. Percentage retics was calculated by subtracting the percentage of retic-count positive cells in stained samples from that of unstained samples, using FlowJo analysis software. Complete blood count was performed by using an automated analyzer (Hemavet 950, Drew Scientific, Waterbury, CT). Red blood cell parameters including total RBC, hemoglobin and hematocrit were assessed.
Red cell life span
Red cell survival was measured using an in vivo biotinylation method. Mice were injected with 1mg Sulfo-NHS-Biotin (Pierce) in a volume of 200–250 µl normal saline. Animals were bled at day 1, 4, 7, 10, 14, 17 after injection. Cells were analyzed by FACS after staining with streptavidin R-PE (Southern Biotech, Birmingham, AL) and the percentage of biotin positive cells was determined. Data were analyzed as the mean ± SEM of a minimum of 8 mice per experimental group.
Results
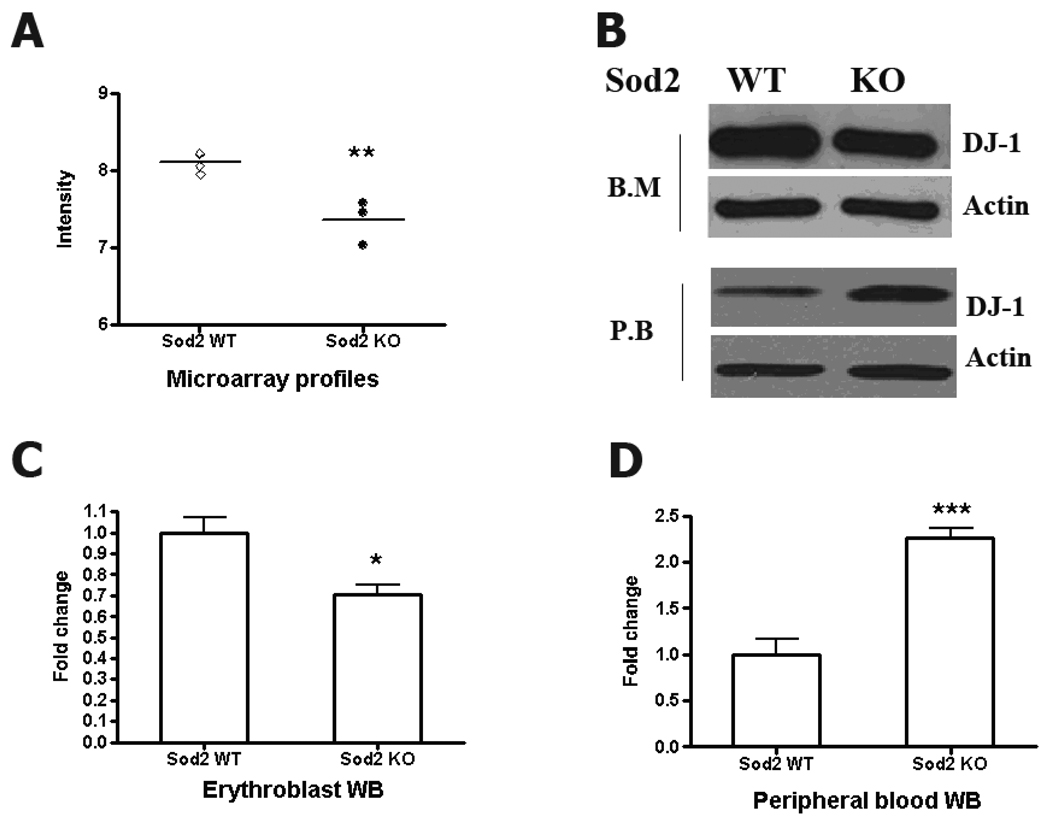
DJ-1 expression was first observed in developing erythroid cells when comparing gene transcription in wild-type and SOD2 deficient murine erythroblasts (defined as transferrin receptor and Ter119 expressing nucleated marrow cells) [Martin et al, in preparation]. As shown in figure 1, knockout of Sod2 results in a downregulation of DJ-1 expression at the transcript level in erythroblasts (Fig1A). Western blot using anti-DJ-1 antibody confirms that DJ-1 protein is present in hematopoietic tissues, and that expression is reduced in Sod2 knockout erythroblast (Fig1B), which is consistent with microarray data. DJ-1 protein is also detected in matured red blood cells from peripheral blood, but a higher DJ-1 protein level is observed in Sod2 KO samples (Fig1B lower panel, with quantification in panels 1C and 1D). The reason for the observed difference in relative DJ-1 protein expression between erythroblasts and mature red cells is not clear, but may reflect differences in DJ-1 protein turnover, post-translational modification or degradation in the context of oxidant stress.
Fig 1. Differential expression of DJ-1 in normal and oxidant stressed erythroid precursors.
(A): mRNA isolated from erythroblasts (Ter119+, CD 71+ bone marrow) from Sod2 WT (n=4) and KO (n=3) mice was evaluated for transcript levels by microarray analysis (Affymetrix GeneChip Mouse Genome 430 2.0 array [Martin et al, in preparation]). DJ1 mRNA is down-regulated in Sod2 deficient erythroblasts (fold change: 1.7, p value<0.01, Sod2 WT n=4, Sod2 KO n=3) (B): DJ1 protein expression is decreased in erythroblasts. However, examination of mature peripheral red blood cells shows higher DJ-1 protein in SOD2 deficient cells. Data are from at least 3 individual experiments. Protein expression fold changes are measured by band density quantified with Image J. Normalized data are shown in panel 1C (p<0.05, WT: 1±0.07, N=3; KO, 0.7±0.05, N=4) and 1D (p <0.001, WT, 1±0.17, N=4; KO, 2.26±0.11, N=4).
To examine the DJ-1’s function in normal and oxidatively stressed blood cell development, we compared the whole blood count of DJ-1 knockout mice and DJ-1/Sod2 double knockout mice. Because SOD2 deficiency is lethal late in gestation, all comparisons between genotypes utilize normal mice that have been lethally irradiated and reconstituted with fetal liver cells of the indicated genotype. We have previously established that this approach results in full hematopoietic chimerism, including erythroid lineage cells. Table 1 presents hematologic data comparing Sod2+/−, DJ-1−/−, Sod2−/− and DJ-1−/− /Sod2−/− double knockout animals. When control animals (Sod2+/−) were compared to DJ-1−/− animals, we detected a small (but significant) difference in cell size (MCV) and hemoglobin concentration (MCHC). Neither group was anemic (Hct, Hgb, red cell number were normal). When Sod2−/− animals were compared to DJ-1−/− /Sod2−/− double knockout animals, a difference in cell size (MCV) and mean corpuscular hemoglobin (MCH) was found. Both Sod2−/− and DJ-1−/− /Sod2−/− double knockout groups are anemic compared to the Sod2+/− and DJ-1−/− controls, with the severity of anemia similar between groups.
Table 1. Erythrocyte parameters.
Results for Sod2+/−(n=4), DJ-1−/−(n=4), Sod2−/−(n=4) and Sod2/DJ-1dKO (n=8) mice are shown as Mean ± SEM. Statistical comparisons between Sod2+/− and DJ-1−/− and between Sod2−/− and Sod2/DJ-1dKO were performed by student t test.
| Parameters | Sod2+/− | DJ1−/− | Sod2−/− | Sod2/DJ1 DKO |
|---|---|---|---|---|
| RBC (10^6/ul) | 9.528 ± 0.04366 | 9.573 ± 0.1944 | 8.073 ± 0.4746 | 7.391 ± 0.2294 |
| Hgb (g/dL) | 12.75 ± 0.1443 | 12.53 ± 0.2097 | 9.375 ± 0.6750 | 9.163 ± 0.2514 |
| Hct (%) | 38.08 ± 0.2780 | 39.58 ± 0.7465 | 30.40 ± 1.897 | 30.20 ± 0.8036 |
| MCH (pg) | 13.38 ± 0.1031 | 13.00 ± 0.2858 | 11.60 ± 0.1780 | 12.44 ± 0.1133 ** |
| MCHC (g/dL) | 33.48 ± 0.3497 | 31.65 ± 0.2062 ** | 30.80 ± 0.3808 | 30.36 ± 0.1700 |
| MCV (fL) | 39.95 ± 0.2398 | 41.35 ± 0.4481 * | 37.63 ± 0.2016 | 40.90 ± 0.3982 *** |
| RDW (%) | 18.93 ± 0.08539 | 19.45 ± 0.4113 | 24.95 ± 0.2986 | 25.03 ± 0.3876 |
RBC, red blood cell count; Hgb, hemoglobin; Hct, hematocrit; MCH, mean corpuscular hemoglobin; MCHC, MCH concentration, MCV, mean corpuscular volume; RDW, red cell distribution width.
P<0.05.
P<0.01.
P<0.001
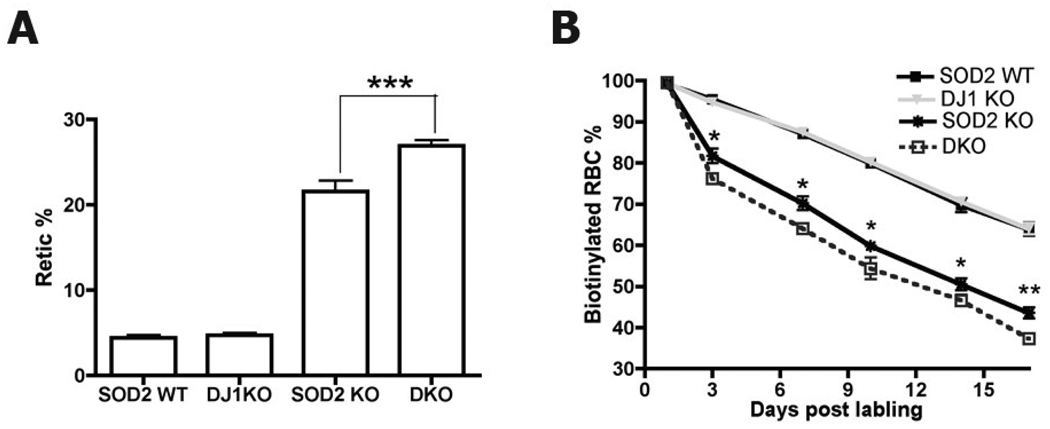
While loss of DJ-1 does not have a dramatic effect on red cell indices, the differential gene expression we observed in erythroblasts raised the possibility of an interaction between DJ-1 and SOD2. Evaluation of red cell indices comparing SOD2 deficient and double knockout hematopoietic chimeras revealed a modest additive effect of loss of DJ-1 with red cell number, hemoglobin and hematocrit all slightly lower in the double knockout group. In order to evaluate whether loss of DJ-1 results in a more subtle effect on red cell production or turnover, we evaluated reticulocyte count and measured red cell survival in hematopoietic chimeras reconstituted with cells of the same four genotypes. Figure 2A shows that red cell production (reticulocyte count) differs significantly between the Sod2−/− and the DJ-1/Sod2−/− double knockout groups, while loss of DJ-1 by itself has no effect. The difference in reticulocyte count observed between Sod2 knockout and Sod2/DJ-1 double knockout groups suggests that red cell turnover may be accelerated in the double knockout group. Figure 2B plots red cell survival following in vivo biotin labeling in cells of each of the 4 genotypes. There is no difference in red cell survival when comparing control and DJ-1 knockout cells. However there is a small but significant decrease in red cell survival in the double knockout group when compared to the Sod2 knockout group.
Fig 2. Increased reticulocyte count and decreased erythroid survival in Sod2/DJ-1 dKO mice.
A. Sod2/DJ-1 DKO mice show higher reticulocyte count than Sod2 KO mice. Reticulocytes were stained with Thiazole Orange, and analyzed by FACS (p < 0.001). Data were measured in control mice (n=10), Sod2 −/− (n=11), DJ-1 −/− (n=12) and Sod2/DJ-1 dKO (n=16). Results presented are mean ± SEM. B. DJ-1 loss accelerates removal of SOD2 deficient red cells: Red cell survival kinetics were measured in control mice (n=12), Sod2−/− (n=11), DJ-1−/− (n=8) and Sod2/DJ-1 dKO (n=12) mice by in vivo biotin labeling. Data were analyzed by t-test. * P<0.05, **P<0.01. ***P<0.001.
Loss of SOD2 increases susceptibility of cells to endogenous and exogenous oxidants. In the context of red cell development, we have previously shown that levels of superoxide and peroxide/mixed reactive oxidants are elevated in cells lacking SOD2 using the indicator dye dihydroethidine (DHE for superoxide) and a dichlorofluorescein derivative (cm-H2DCF-DA for peroxides and mixed ROS). While the exact function of DJ-1 remains unclear, several reports indicate that DJ-1 is involved in oxidant stress resistance either directly as a ROS scavenger or indirectly as a target of damage. Upon oxidative stimulation, DJ-1 is oxidized to a more acidic form.
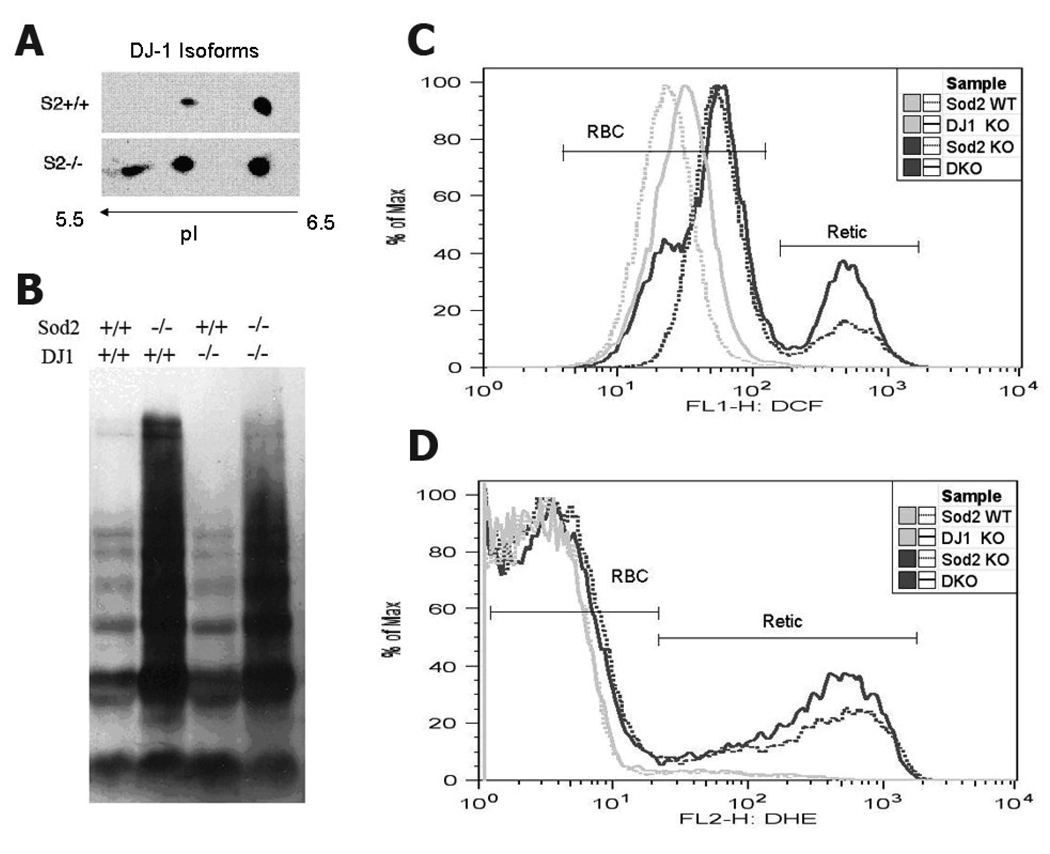
To evaluate the (oxidation) status of DJ-1 in Sod2 deficient and normal RBC, we ran 2D western blots to compare DJ-1 isoforms. Figure 3A shows that while both samples contain the non-oxidized form of DJ-1, acidic isoforms are markedly increased in Sod2 KO red cells including a unique spot that has a more acidic pI. Since DJ-1 is thought to be involved in antioxidant defense, we tested whether loss of DJ-1 affects red cell ROS production or oxidative damage to red cell proteins. Neither DJ-1 knockout nor DJ1/Sod2 double knockout (transplanted) mice showed higher oxidative damage to proteins (carbonyls) in erythroid cells when compared with WT or Sod2 single knockout cells, respectively (Fig 3B). Consistent with our previous results, loss of SOD2 results in a dramatic increase in red cell protein oxidation (). We tested whether loss of DJ-1 alone or in combination with loss of SOD2 affected ROS production by red cells or reticulocytes. ROS production of DJ-1 knockout red cells and reticulocytes did not differ from control cells, while ROS production of double knockout cells (DJ-1/Sod2) did not differ from Sod2 knockout alone (Fig3 C, D). Thus, loss of DJ-1 does not exacerbate the elevated ROS production observed in SOD2 deficient erythroid cells, and does not further increase protein oxidative damage (carbonyls).
Fig 3. DJ-1 is oxidized in SOD2 deficient red cells, but Loss of DJ-1 does not alter ROS levels in normal or SOD2 deficient red cells.
A. Acidic forms of DJ-1 accumulate in Sod2 KO erythroid cells. A representative 2-D western blot against DJ-1 protein compares WT and SOD2 deficient cells. Immunoblot data shown is representative of three independent experiments. B. Oxyblot analysis of protein oxidation in red cell lysates shows loss of DJ-1 does not affect carbonyls, while loss of SOD2 greatly increases carbonyls. C, D. Flow cytometric analysis of intracellular hydrogen peroxide by dichlorofluorescein (DCF) fluorescence (C) and of superoxide by dihydroethidium (DHE) fluorescence (D). We have previously identified the two peaks in the histograms as representing mature RBC and reticulocytes [3]. FACS profiles are representative of 8 mice of each genotype. Comparison of mean fluorescence intensity values for DHE or DCF indicates loss of DJ-1 has no effect on measured ROS levels (data not shown).
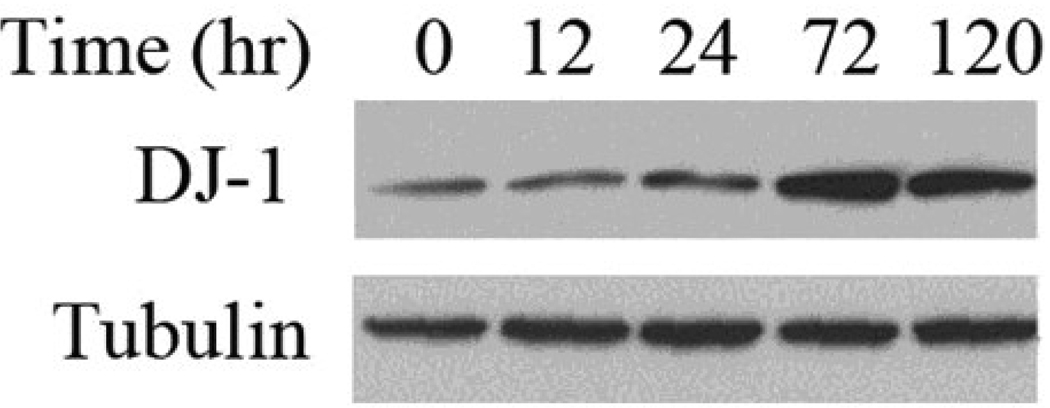
We next evaluated timing and regulation of DJ-1 expression during erythroid development. Murine erythroleukemia cells (MEL) are widely used as an in vitro model to study the erythroid differentiation. Upon exposure to DMSO, MEL cells undergo terminal erythroid differentiation, to recapitulate aspects of normal erythroid development, including induction of hemoglobin synthesis and reduced cell proliferation. The Western blot data in Fig 4 shows that endogenous DJ-1 protein is observed to increase by 24 hours following DMSO induction of MEL cells. Expression of DJ-1 protein continues to increase for up to 3 days. These results demonstrate that DJ-1 expression is regulated during erythroid development.
Fig 4. DJ-1 expression is up-regulated during terminal erythroid differentiation.
Western Blot shows DJ-1 protein expression following induction of differentiation with DMSO. Results presented are representative of a minimum of 3 replicate experiments.
Discussion
DJ-1 (aka Park 7) was first identified as an oncogene based upon co-transforming activity. Subsequent studies linked DJ-1 with autosomal recessive early-onset Parkinsonism. Much of the available DJ-1 functional data has been derived from evaluation of neuronal cell models, with a focus on protective roles against oxidative damage in neurons. This is the first report to document DJ-1 expression and a functional role in the erythroid lineage, including bone marrow derived erythroblasts, peripheral erythrocytes and mouse erythroleukemia cell lines at both the protein and mRNA levels (Fig 1 and Fig 4). We also show that DJ-1 is induced during the course of erythroid development. Evaluation of the promoter region of DJ-1 (not shown) reveals at least two potential GATA-1 biding sites that will be characterized further.
Loss of DJ-1 by itself does not lead to an obvious hematopoietic or erythroid phenotype. However, loss of DJ-1 does affect red cell production and red cell survival in the context of anemia caused by loss of the antioxidant protein SOD2. These results are consistent with initial characterization of the neuronal phenotype of DJ-1 knockout mice—where differences between control and KO animals were revealed upon addition of an exogenous stressor such as the neurotoxin MPTP. This indicates that while DJ-1 function isn’t essential, it plays an important role in secondary responses to cellular stress—in particular oxidants or mitochondrial toxins, although perhaps in response to other triggers as well. DJ-1 KO mice show higher mitochondrial H2O2 production, impaired aconitase activity and compensatory increases in GPx and SOD2 activities in brain, but no differences in protein oxidative damage. In the current study, we don’t observe higher ROS production or protein oxidation in DJ-1 knockout erythroid cells.
The mechanism of cellular protection conferred by DJ-1 remains unclear. Among the possibilities suggested is a direct antioxidant mechanism that involves oxidation of cysteine residues in DJ-1. This hypothesis is based in part upon rough homology between DJ-1 and the peroxide scavenging peroxiredoxin family of proteins, by observed changes in oxidation status of DJ-1 protein, and the effect of mutations that target a critical conserved cysteine residue (Cys106). Our 2-D gel analysis of red cell proteins shows changes in DJ-1 isoforms when comparing normal and SOD2 deficient cells, with an accumulation of more acidic forms in Sod2 KO cells. In other cell systems, acidic isoforms of DJ-1 accumulate in response to oxidative stress, which may play a role in protecting cells from damage.
While DJ-1 transcription is reduced in the context of SOD2 deficiency (fig 1A) and this leads to lower levels of DJ-1 in erythroblasts, we see a paradoxical rise in the level of DJ-1 protein in SOD2 deficient peripheral red cells (fig 1B). This suggests that turnover or degradation of DJ-1 protein is altered in the context of oxidant stress within red cells. Interestingly, a recent publication found evidence for higher levels of oxidized DJ-1 in peripheral blood from a small group of untreated Parkinson’s disease patients — suggesting that this might be a useful biomarker. It will be important to verify this finding and determine whether altered expression or modification of DJ-1 protein in red cells can be used as a marker of oxidant stress in other disease states. As we have shown in the case of SOD2 deficiency, changes in DJ-1 expression or functional activity in red cells has the potential to modify the severity of red cell disorders associated with increased oxidative damage.
Acknowledgements
This work was supported by NIH grant: R21DK075763 from NIDDK. Costs of microarray analysis were covered in part by the Consortium for functional glycomics. We are grateful to Dr. Valina Dawson at Johns Hopkins University for kindly providing the DJ-1 knockout mice.
MIAME-compliant data discussed in this publication has been deposited at the CFG (https://www.functionalglycomics.org/glycomics/publicdata/microarray.jsp; GLYCOv2 arrays), in NCBIs Gene Expression Omnibus (GEO, http://www.ncbi.nlm.nih.gov/geo/) and is accessible through GEO Series accession number GSE8726 (Mouse Genome 430 2.0 arrays).
Footnotes
Publisher's Disclaimer: This is a PDF file of an unedited manuscript that has been accepted for publication. As a service to our customers we are providing this early version of the manuscript. The manuscript will undergo copyediting, typesetting, and review of the resulting proof before it is published in its final citable form. Please note that during the production process errors may be discovered which could affect the content, and all legal disclaimers that apply to the journal pertain.
Conflict of Interest Disclosure
No financial interest/relationships with financial interest relating to topic of this article have been declared.


