

Abstract
Cytidine triphosphate synthetase (CTPS) is the rate-limiting enzyme in de novo CTP synthesis and is required for the formation of RNA, DNA, and phospholipids. This study determined the kinetic properties of the individual human CTPS isozymes (hCTPS1 and hCTPS2) and regulation through substrate concentration, oligomerization, and phosphorylation. Kinetic analysis demonstrated that both hCTPS1 and hCTPS2 were maximally active at physiological concentrations of ATP, GTP, and glutamine, whereas the Km and IC50 values for the substrate UTP and the product CTP, respectively, were close to their physiological concentrations, indicating that the intracellular concentrations of UTP and CTP may precisely regulate hCTPS activity. Low serum treatment increased hCTPS2 phosphorylation, and five probable phosphorylation sites were identified in the hCTPS2 C-terminal domain. Metabolic labeling of hCTPS2 with [32P]H3PO4 demonstrated that Ser568 and Ser571 were two major phosphorylation sites, and additional studies demonstrated that Ser568 was phosphorylated by casein kinase 1 both in vitro and in vivo. Interestingly, mutation of Ser568 (S568A) but not Ser571 significantly increased hCTPS2 activity, demonstrating that Ser568 is a major inhibitory phosphorylation site. The S568A mutation had a greater effect on the glutamine than ammonia-dependent activity, indicating that phosphorylation of this site may influence the glutaminase domain of hCTPS2. Deletion of the C-terminal regulatory domain of hCTPS1 also greatly increased the Vmax of this enzyme. In summary, this is the first study to characterize the kinetic properties of hCTPS1 and hCTPS2 and to identify Ser568 as a major site of CTPS2 regulation by phosphorylation.
Keywords: Enzyme Kinetics, Mass Spectrometry (MS), Nucleoside Nucleotide Metabolism, Protein Phosphorylation, Serine-Threonine Protein Kinase, Casein Kinase 1
Introduction
Cytidine nucleotides are precursors for the synthesis of nucleic acids and phospholipids (1–4) as well as the post-translational modification of proteins by sialylation (1–3) and the regulation of enzymes such as CTP-phosphocholine cytidylyltransferase (2), carbamoyl phosphate synthetase, and phosphatidylserine synthase (5). CTP is the nucleotide with the lowest cellular concentration (1, 6), making it rate-limiting for RNA synthesis and other CTP-dependent events. Hence, understanding the regulation of CTP synthesis is important for many growth-related processes.
CTP synthetase (CTPS, EC 6.3.4.2)4 is the rate-limiting enzyme for the synthesis of cytosine nucleotides from both the de novo and uridine salvage pathways (7). CTPS consists of two enzymatic domains. In the synthase domain, UTP is phosphorylated by the γ-phosphoryl group of ATP to form 4-phospho-UTP via an ATPase reaction (8–11). In the glutaminase domain, the substrate glutamine is hydrolyzed to glutamate and NH3 (8), and the resultant NH3 is then transported to the synthase domain active site through an NH3 tunnel (11, 12). NH3 is then transferred to the phosphorylated UTP to form CTP (8). GTP activates the reaction by accelerating the formation of a covalent glutamyl-enzyme catalytic intermediate (8). CTPS has three functionally distinct sites: the glutaminase site for glutamine hydrolysis, the active site where CTP is formed, and the allosteric site where GTP binds (13). CTPS is also regulated by feedback inhibition, allowing the product CTP to inhibit the activity of the enzyme (14–17).
There are two isoforms of CTPS in humans, CTPS1 and CTPS2, and they share 74% amino acid identity (1, 7). Similarly, there are two isoforms in yeast, URA7 and URA8; human CTPS1 (hCTPS1) and hCTPS2 share just over 50% identity with the yeast isoforms (7, 18, 19). Studies have shown that both URA7 and hCTPS1 are regulated by phosphorylation, although the mechanisms are quite different. URA7 is phosphorylated by cAMP-dependent protein kinase on Ser424 (3) and by protein kinase C on Ser36, Ser330, Ser354, and Ser454 (20). This phosphorylation increases enzyme activity and decreases the ability of CTP to inhibit activity (3, 21–23). In addition, phosphorylation only stimulates activity in the presence of subsaturating concentrations of ATP and UTP (22), and phosphorylation by both kinases is less than additive compared with either kinase alone (21).
In contrast to URA7, hCTPS1 is negatively regulated by phosphorylation. Phosphorylation increases in the presence of low serum compared with high serum, and hCTPS1 is phosphorylated on Ser571, Ser574, and Ser575 (1). Significantly, the C-terminal tail region that contains all the major phosphorylation sites on hCTPS1 is only found in higher eukaryotes and not in yeast or Escherichia coli (1). Ser571 is phosphorylated by glycogen synthase kinase-3β (GSK3β), and Ser575 was shown to be required for priming this phosphorylation (1). However, the kinases responsible for the phosphorylation of Ser574 and Ser575 have not yet been identified. An increase in hCTPS1 phosphorylation is paralleled by a decrease in CTPS activity, and this decrease is reversed by the GSK3β inhibitor indirubin or by dephosphorylation (1). Interestingly, the phosphorylation site at Ser575 is not conserved in hCTPS2 (see Fig. 1), suggesting that hCTPS1 and hCTPS2 may be regulated by different kinases and/or signaling pathways. Other studies indicated that hCTPS1 expressed in yeast cells can be phosphorylated by protein kinase C on Ser462 and Thr455 (24) and by cAMP-dependent protein kinase (14). However, hCTPS1 was not phosphorylated by cAMP-dependent protein kinase or protein kinase C in HEK293 cells (1).
FIGURE 1.

Influence of substrates and allosteric effectors on hCTPS1 and hCTPS2 activity. HEK293 cells expressing hCTPS1-FLAG (solid squares, solid line, black bar) and hCTPS2-FLAG (open triangles, dotted line, gray bar) were lysed, immunoprecipitated with FLAG antibody conjugated to agarose beads, and assayed for CTPS activity. The samples were incubated with the indicated ATP (A), UTP (B), or glutamine (C) concentrations for 1 h (CTPS1) or 15 min (CTPS2) at 37 °C. Alternatively, the samples were incubated with the indicated effectors GTP (D) or CTP (E) concentrations for 1 h (CTPS1) or 15 min (CTPS2) at 37 °C. All of the data are expressed as pmol/min CTP formed and are from three (CTPS1) or four (CTPS2) experiments.
The oligomerization of CTPS also plays an important role in the regulation of the enzyme. Studies with the yeast and E. coli CTPS enzymes have shown that the active form of the enzyme is a tetramer made up of two dimers, and the dimer form is inactive (8). For both yeast and E. coli, CTPS exists as a dimer in the absence of ATP and UTP, but in the presence of saturating concentrations of ATP and UTP, CTPS exists as a tetramer (8, 25, 26). The crystal structure of the hCTPS1 synthase domain shows that it is also a dimer of dimers with a synthase domain very similar to that of E. coli (27). However, the influence of ATP and UTP on tetramerization has not been determined for either human isoform.
Although elegant analysis of the enzymatic properties of the E. coli and yeast enzymes has been performed (4, 8, 12, 15, 16, 25, 28), the individual human isoforms have not been examined in detail. The objective of this study was to explore the regulation of hCTPS1 and hCTPS2 enzyme activity by substrates, modulators, and phosphorylation as well as to determine the requirement for ATP and/or UTP for enzyme tetramerization. The results of this study identify optimal substrate concentrations and determine that phosphorylation of sites within the C terminus is likely to play a role in regulating the activity of these enzymes.
EXPERIMENTAL PROCEDURES
hCTPS Plasmid Construction
The wild-type hCTPS1 construct was made as described previously (1). Full-length cDNA containing hCTPS2 (Image identification code 5268973) was purchased from the American Type Culture Collection (Manassas, VA) (7). Full-length, wild-type hCTPS2 (WT-hCTPS2) was amplified using the sense primer 5′-AGCGTCGGATCCATGAAGTACATCCTGGTCAC-3′ (BamHI site is underlined) and the antisense primer 5′-AGCGTCCTGCAGTCACTTGTCGTCATCGTCTTTGTAATCGCTTATTTCCAACTCAGCTAT-3′ (PstI site is underlined, FLAG sequence is italicized). A FLAG sequence (DYKDDDDK) was introduced at the C terminus of hCTPS2. The products of the PCR (WT-hCTPS2) and the pcDNA4/myc-HisB vector (Invitrogen) were double-digested with BamHI and PstI (New England Biolabs, Ipswich, MA) and then purified from an agarose gel using a gel purification kit according to the manufacturer's instructions (Qiagen). The vector and WT-hCTPS2 were ligated together using T4 DNA ligase (New England Biolabs). The complete WT-hCTPS2 clone was then transformed into competent DH5α cells (Invitrogen) and plated on LB-agar containing 100 μg/ml ampicillin and grown overnight. Selected colonies were grown overnight, and the WT-hCTPS2 DNA was isolated according to the mini-prep protocol (Invitrogen). The WT-CTPS2 clone was sequenced using the T7 sense primer for the N terminus, the bovine growth hormone antisense primer for the C terminus, and the sense primer 5′-AGGCGAAAAGAGAGAATTTC-3′ for the middle. All three sequences confirmed the expected WT-hCTPS2 sequence with a FLAG sequence at the C-terminal end.
Mutation of Phosphorylation Sites
The hCTPS1 point mutations were constructed as described previously (1). Using the WT-hCTPS1 construct, the 613 base pairs before the deleted sequence were amplified using the forward primer 5′-CACGAAGCTTGGCAGAAGC-3′ and the reverse primer 5′-GACTCGAGCGCTTGTCGTCATCGTCTTTGTAATCGAGCCTGCAGCCTTTCTG-3′ (XhoI site is underlined, FLAG sequence is italicized). This primer pair causes a deletion of amino acid residues Ser562–Asp591. The WT-hCTPS1 vector and the product of the PCR were then digested with HindIII and XhoI and purified. This digestion produced three fragments: the pcDNA4 vector, the multiple cloning site region and the first 1137 base pairs of hCTPS1, and the PCR product containing 613 base pairs of hCTPS1 stopping at Leu561 and the FLAG sequence. These three fragments were ligated together using T4 DNA ligase, and the ΔC-hCTPS1 clone was then transformed into competent DH5α cells and selected as above.
The WT-hCTPS2-FLAG construct was used to make mutations at five putative phosphorylation sites identified by mass spectrometry: Ser564, Tyr567, Ser568, Ser571, and Ser574. The forward and reverse primers used to make these mutations are listed in supplemental Table S1. Mutations were made according to the protocol in the QuikChange® site-directed mutagenesis kit (Stratagene, La Jolla, CA) with slight modifications. PCRs contained 20 ng of DNA. XL10-Gold supercompetent cells (Stratagene) were used for transformation. Transformed cells were incubated in Terrific Broth (12 g/liter tryptone, 24 g/liter yeast extract, 0.4% glycerol, 0.17 m KH2PO4, and 0.72 m K2HPO4) for 2 h before plating on LB-agar containing 100 μg/ml ampicillin. The colonies were selected and grown overnight in Terrific Broth containing 100 μg/ml ampicillin, and DNA was purified as above. DNA was sequenced using the bovine growth hormone antisense primer to confirm correct mutations.
Cell Culture
HEK293 cells purchased from the University of North Carolina Tissue Culture Facility were grown in high glucose DMEM supplemented with 10% FBS and 1% penicillin/streptomycin in a humidified 5% CO2 incubator at 37 °C.
Establishment of hCTPS Stable Cell Lines
HEK293 cells were plated in 100-mm dishes and transfected using 45 μg of Lipofectamine (Invitrogen) and 9 μg of DNA for the desired hCTPS construct in DMEM with no additives. On the day after transfection, new DMEM containing 10% FBS and 1% penicillin/streptomycin was added to the cells. The cells expressing the transfected hCTPS construct were selected over 4–6 weeks using 100 μg/ml Zeocin (Invitrogen) as a selection agent. Once selected, hCTPS protein expression was observed to be stable for at least 4 days in the absence of Zeocin (data not shown).
Immunoprecipitation of hCTPS
Stable HEK293 cells expressing hCTPS constructs were plated in 100-mm dishes and grown to confluency. The cells were washed twice with cold PBS and lysed with 0.35 ml of radioimmune precipitation assay (RIPA) buffer (150 mm NaCl, 9.1 mm Na2HPO4, 1.7 mm NaH2PO4, 1% Nonidet P-40 substitute, and 0.5% sodium deoxycholate) containing 1 μg/ml leupeptin, 10 nm microcystin, 1 mm Na3VO4, and 250 μm phenylmethylsulfonyl fluoride. The lysates were centrifuged, and the Coommassie protein assay (Pierce) was performed on the supernatants. The lysates were then aliquoted as desired and rotated with 10 μl of anti-FLAG beads overnight at 4 °C.
CTPS Activity Assay
hCTPS activity assays were performed as described previously (3, 21, 22). The amount of total protein needed for equal CTPS content after immunoprecipitation was determined by Western blotting (supplemental Fig. S1). Following immunoprecipitation of 5 mg of total protein from cells expressing WT-CTPS1, 12 mg of total protein from ΔC-CTPS1 cells, or 1 mg of total protein from HEK293 cells expressing the desired hCTPS2 construct, the lysates were washed three times with RIPA buffer containing 5 μg/ml leupeptin and once with 1× CTPS reaction buffer (50 mm Tricine, pH 8.1, 20 mm MgCl2, and 5 mm KCl). Unless otherwise specified, assay substrates were added to final concentrations of 1 mm ATP, 0.1 mm UTP, 0.1 mm GTP, 1 mm glutamine, and 18.75 nCi of [14C]UTP (Moravek Biochemicals, Brea, CA) in a final volume of 50 μl of 1× CTPS reaction buffer, pH 8.1. The samples were incubated for 1 h (CTPS1) or 15 min (CTPS2) at 37 °C with shaking. Ammonia-dependent CTPS activity was determined as described above except 10 mm ammonium sulfate was substituted for 10 mm glutamine. The reaction was stopped by removing the tubes to ice and adding 10 μl of 200 mm EDTA. The samples were completely dried using a SpeedVac (ThermoScientific, Waltham, MA), the dried pellets were resuspended in 10 μl of ddH2O, and 4 μl of each sample were spotted onto dry polyethylimine cellulose plastic-backed plates (Selecto Scientific) that were prewashed for at least 10 min with ddH2O, 5 min with 0.65 n HCl, and 1 min with methanol. The nucleotides were separated using 0.65 n HCl as the ascending chromatography buffer. The areas corresponding to 14C-labeled UTP and CTP were visualized by exposing the plate to a phosphorimaging screen overnight. The screen was scanned using a STORM or Typhoon imaging system (GE Healthcare).
Gel Filtration
HEK293 cells expressing WT-hCTPS2 were lysed as above. The supernatants were filtered through 0.22-μm cellulose acetate spin filters (Agilent Technologies, Wilmington, DE), and 200 μl of sample was loaded onto a UPC-900 ÄKTA FPLC (Amersham Biosciences) and separated using a Superose 12 column (Amersham Biosciences) at 0.2 ml/min using a low salt buffer (50 mm Tris, pH 8.0, 50 mm NaCl, 1 mm dithiothreitol, 0.1 mm EDTA, 10 mm MgCl2) in the absence or presence of 1 mm ATP and/or 1 mm UTP. The fractions were collected in 0.5-ml aliquots. Gel filtration standards (Bio-Rad) were also separated using buffer without nucleotides (supplemental Fig. S2). Fractions 15–29 were then analyzed for endogenous CTPS1 or hCTPS2-FLAG expression using Western blotting as described below.
Immunoblotting
Cell lysates from immunoprecipitations were washed three times with RIPA buffer containing 5 μg/ml leupeptin and resuspended in 50 μl of Laemmli buffer (final concentrations: 0.25 m Tris, pH 6.8, 2% SDS, 10% glycerol, 5% β-mercaptoethanol, 0.001 g/ml bromphenol blue). Gel filtration fractions 15–29 (25 μl) were diluted in 25 μl of Laemmli buffer. All of the samples were boiled for 5 min before loading them onto a 10% SDS-PAGE gel. The proteins were separated at 120 V and transferred to polyvinylidene fluoride Immobilon-FL membrane (Millipore, Billerica, MA) for 60–90 min at 400 mA at 4 °C. The membranes were blocked for 1 h with a 1:1 mixture of Odyssey blocking buffer (LiCor, Lincoln, NE) and PBS. The membranes were incubated with a mouse anti-FLAG antibody (Sigma-Aldrich) and a rabbit anti-CTPS1 antibody, washed with Tris-buffered saline with Tween 20 (10 mm Tris, 150 mm NaCl, 0.05% Tween 20, pH 8.0), incubated with IRDye 680 goat anti-mouse and IRDye 800CW goat anti-rabbit antibodies (LiCor), and washed again with Tris-buffered saline with Tween 20. The proteins were detected using an Odyssey infrared imaging system (LiCor).
In Vivo Labeling with [32P]Orthophosphate
HEK293 cells expressing hCTPS constructs were treated with 10 or 0.1% FBS overnight. The next day, the medium was replaced with phosphate-free DMEM with 10 or 0.1% FBS and 0.1 mCi/ml [32P]H3PO4 (MP Biomedicals, Irvine, CA) (0.5 mCi total) for 4 h. The cells were then washed with PBS and lysed as described above. Cell lysate from one 100-mm dish was incubated with 10 μl of FLAG antibody conjugated to agarose beads (Sigma-Aldrich) overnight at 4 °C. FLAG beads were washed twice with RIPA buffer, resuspended with 50 μl of Laemmli buffer, and boiled 5 min. Immunoblotting was performed as described above. After scanning on an Odyssey infrared imaging system to detect either hCTPS1-FLAG or hCTPS2-FLAG, the membrane was dried thoroughly and exposed to a phosphorimaging screen (GE Healthcare) overnight to detect phosphorylated hCTPS1 and hCTPS2. The screen was scanned on the STORM imaging system.
Phosphorylation of hCTPS with CK1
HEK293 cells expressing WT-hCTPS2 or hCTPS2-S568A were lysed and immunoprecipitated with FLAG antibody beads as above. FLAG beads were washed twice with RIPA buffer, and the hCTPS proteins were eluted with 1.0 mg/ml FLAG peptide in 10 mm Tris, pH 7.5, plus 100 mm NaCl. WT-hCTPS2 and hCTPS2-S568A were incubated with purified casein kinase 1 (CK1) (CellSignal, NEB) with 50 μm [32P]ATP (12.5 μCi total) in 100 mm Tris, pH 7.5, 10 mm MgCl2, 50 mm β-glycerol phosphate, 1.0 mm sodium orthovanadate, 1.0 mm dithiothreitol, and 0.5 mm EGTA for 60 min at 30 °C. The reaction was terminated with SDS-PAGE sample buffer, and the sample was applied to SDS-PAGE, stained with Coomassie, and destained. The dried gel was then exposed to film.
Phosphorylation Site Identification by Mass Spectrometry
Cell lysates from HEK293 cells expressing WT-hCTPS2 that were treated with 10 or 0.1% FBS were separated by SDS-PAGE and transferred to nitrocellulose (Osmonics, Westborough, MA) for 60 min at 400 mA. The proteins were visualized with MemCode (Pierce). The bands corresponding to WT-hCTPS2 were excised and cut into ∼1-mm pieces before destaining with MemCode Eraser. The pieces were incubated 1 h at 37 °C with 1% polyvinylpyrrolidone in 100 mm glacial acetic acid. The membrane pieces were then washed with ddH2O and incubated with 0.5 μg of trypsin in ammonium bicarbonate overnight at 37 °C. Trypsin was removed to a new tube, the membrane pieces were washed three times with ddH2O, and the ddH2O was added to the trypsin. The samples were dried in a SpeedVac and resuspended in 10 μl of ddH2O.
The samples were then analyzed by online LC-MS/MS using an Eksigent NanoLC system (Dublin, CA) coupled to a Thermo Fisher Scientific LTQ-Orbitrap XL (Waltham, MA) mass spectrometer. Five microliters of the sample was injected onto a New Objectives IntegraFrit C18 trap column (Woburn, MA). The tryptic peptides were eluted by reverse phase HPLC from a 10-cm × 75-μm inner diameter × 360-μm outer diameter PepMap capillary C18 column (Dionex, Sunnyvale, CA). A gradient of 5–45% Buffer B in 50 min was used for the elution with 0.1% formic acid as Buffer A and 95% acetonitrile, 0.1% formic acid (Thermo Fisher Scientific) as Buffer B. The eluent was delivered to the mass spectrometer's source by nano-electrospray using a New Objective PicoView ESI source. The spectral data were acquired throughout the elution as cycles of one Fourier transform mass spectrometry (30,000 resolution) and five subsequent data-dependent ion trap mass-spectrometry/mass spectrometry.
The mass spectra were searched against a custom database containing only hCTPS2 (GenBankTM accession number CAI40086.1). First, the raw mass spectral data were processed by BioWorks Browser v.3.3.1 software (Thermo Fisher Scientific). The resulting centroid peak list was searched against the custom database using an in-house version of the Mascot search engine (Matrix Science, Boston, MA). The criteria for the search are as follows: tryptic cleavage with two potential missed cleavages, peptide mass tolerance ± 0.5 Da, fragment mass tolerance ± 1 Da, and variable modifications: oxidized methionine and S,T,Y phosphorylation.
Data Analysis
All of the data are expressed as the means ± S.E. hCTPS activity assays were quantified using ImageQuant 5.0 (GE Healthcare). Western blots were quantified Odyssey 2.1 software (LiCor). The data were analyzed using GraphPad Prism 4.0 (GraphPad Software, San Diego, CA).
RESULTS
Dependence of hCTPS Activity on pH and Time
The influence of the assay conditions on the activity of the individual human CTPS isozymes was compared. HEK293 cells expressing hCTPS1 or hCTPS2 were lysed and isolated by immunoprecipitation with anti-FLAG antibody. Using 5 mg (hCTPS1) or 1 mg (hCTPS2) of cell lysate resulted in the purification of similar amounts of hCTPS1 and hCTPS2 as determined by anti-FLAG immunoblot. Substrates were added to final concentrations of 1 mm ATP, 0.1 mm UTP, 0.1 mm GTP, 1 mm glutamine, and 18.75 nCi of [14C]UTP (6.8 μm), based on the optimal assay conditions (pH 8.1) determined earlier for hCTPS1 (1). When assayed in the presence of saturating concentrations of ATP, GTP, and glutamine and subsaturating concentrations of UTP, hCTPS1 demonstrated an initial rate value of 36 ± 4 pmol/min, with the reaction rate remaining linear up to 60 min. Under the same conditions, hCTPS2 demonstrated faster initial rate kinetics at 98 ± 2 pmol/min and was linear only to 15 min. Based on the results of these studies, subsequent assays were performed for 1 h (CTPS1) or 15 min (CTPS2). Varying the reaction pH demonstrated that neutral to slightly basic conditions were optimal for both hCTPS1 and hCTPS2 (supplemental Fig. S1).
Dependence of hCTPS Activity on ATP, UTP, and Glutamine Concentrations
CTPS utilizes ATP, UTP, and glutamine to synthesize CTP (29). Assays were performed to determine the individual kinetic parameters for these substrates. hCTPS1 or hCTPS2 protein was isolated and incubated with various concentrations of ATP, UTP, or glutamine at pH 8.1 for 1 h (hCTPS1) or 15 min (hCTPS2) as described above (Fig. 1, A–C).
hCTPS1 displayed the following kinetic parameters. Km values of 170 ± 110, 590 ± 240, and 27 ± 9 μm were determined for ATP, UTP, and glutamine, respectively. In comparison, hCTPS2 displayed Km values for ATP, UTP, and glutamine of 60 ± 20, 190 ± 80, and 100 ± 40 μm, respectively. Increasing the UTP concentration such that it was no longer limiting resulted in Vmax values of 390 ± 50 and 340 ± 40 pmol/min for hCTPS1 and hCTPS2, respectively (Fig. 1 and Table 1). Incubation with higher concentrations of ATP (10 mm) inhibited the activity of both hCTPS1 and hCTPS2 (data not shown).
TABLE 1.
Kinetic parameters of hCTPS1 and hCTPS2 activation
ND, not determined.
| WT-CTPS1 | ΔC-CTPS1 | WT-CTPS2 | CTPS2-S568A | CTPS2-S571A | |
|---|---|---|---|---|---|
| ATP (Km) | 170 ± 110 μm | ND | 60 ± 20 μm | ND | ND |
| UTP (Km) | 590 ± 240 μm | 1900 ± 900 μm | 190 ± 80 μm | 420 ± 60 μm | 800 ± 200 μm |
| UTP (Vmax) | 390 ± 50 pmol/min | 1100- ± 200 pmol/min | 340 ± 40 pmol/min | 970 ± 40 pmol/min | 490 ± 50 pmol/min |
| Gln (Km) | 27 ± 9 μm | ND | 100 ± 40 μm | 72 ± 13 μm | ND |
| GTP (Ka) | 1.6 ± 0.6 μm | ND | 8 ± 3 μm | ND | ND |
| CTP (IC50) | 42 ± 8 μm | 57 ± 9 μm | 40- ± 10 μm | 72 ± 7 μm | 45 ± 6 μm |
Modulation of hCTPS Activity by GTP and CTP
Previous studies have shown that GTP increases the rate of formation of the glutamyl-enzyme intermediate (16, 21, 30–32), whereas CTP acts as a feedback inhibitor (14–16). Therefore, we compared the effects of GTP and CTP concentrations on hCTPS1 and hCTPS2 activity. hCTPS1 or hCTPS2 were incubated with various concentrations of GTP (Fig. 1D) or CTP (Fig. 1E). GTP stimulated CTPS activity with Ka values of 1.6 ± 0.6 and 8 ± 3 μm for WT-hCTPS1 and WT-hCTPS2, respectively (Table 1). Higher concentrations of GTP (10 mm) also inhibited WT-hCTPS1 and WT-hCTPS2 activity (data not shown). Under these assay conditions, GTP was required for hCTPS1 and hCTPS2 activity, because only minimal CTP synthesis was observed in the absence of GTP (Fig. 1D). In contrast to the effects of the other nucleotides, CTP inhibited WT-hCTPS1 and WT-hCTPS2 activity with IC50 values of 42 ± 8 and 40 ± 10 μm, respectively, demonstrating similar CTP feedback inhibition of these enzymes (Fig. 1E).
Requirement of Nucleotides for hCTPS Tetramerization
Previous studies have shown that CTPS is regulated by tetramerization. CTPS can form a dimer of dimers, and the formation of tetramers by ATP and/or UTP activates the enzyme (8, 11, 27, 29). HEK293 cells expressing WT-hCTPS2 were lysed, and the proteins were separated by size exclusion chromatography on a calibrated Superose 12 column in the absence or presence of 1 mm ATP and/or 1 mm UTP plus MgCl2. Based on the elution of protein molecular weight standards and the calculated molecular weight of hCTPS1 and hCTPS2 (7), monomers elute in fraction 24 or higher, dimers elute in fractions 22 and 23, and tetramers elute in fractions 21 or lower. Total protein eluted between fractions 15 and 40 (supplemental Fig. S2). Fractions 15–29 were analyzed for the presence of hCTPS1 and FLAG-tagged hCTPS2 using a CTPS1 antibody to detect endogenous CTPS1 and a FLAG antibody to detect CTPS2-FLAG. In the absence of ATP and UTP, hCTPS1 was found in fractions 22–28 and hCTPS2 was found in fractions 21–25, corresponding to both isoforms being present primarily as monomers and dimers (supplemental Fig. S2, D and E, blue line). In contrast, in the presence of ATP and/or UTP, hCTPS1 was detected in fractions 16–26 and hCTPS2 was detected in fractions 20–23 (supplemental Fig. S2, D and E, red (ATP), green (UTP), and black (ATP/UTP) lines). These data indicated that in the presence of these nucleotides, hCTPS1 was detected as monomers, dimers, and tetramers, whereas hCTPS2 was present primarily as dimers and tetramers.
Regulation of hCTPS by Phosphorylation
Human CTPS1 is negatively regulated by reversible phosphorylation on multiple serines in the C terminus of the enzyme. Under low serum conditions (LS, 0.1% FBS), WT-hCTPS1 is phosphorylated by GSK-3, which is correlated with a decrease in enzyme activity (1). Because hCTPS2 lacks an important phosphorylation site identified in hCTPS1 (Ser575; Fig. 2A), experiments were performed to compare hCTPS2 and hCTPS1 phosphorylation under these conditions. HEK293 cells expressing hCTPS1 or hCTPS2 were metabolically labeled with 100 μCi/ml [32P]H3PO4. Similar to hCTPS1 (Fig. 2B, first two lanes) (1), hCTPS2 was phosphorylated ∼2-fold greater in the presence of LS than in the presence of high serum (HS, 10% FBS) (Fig. 2C, first two lanes). hCTPS2 was also isolated from unlabeled HEK293 cells treated with either HS or LS and trypsin-digested, and the peptides were analyzed for phosphorylation sites by LTQ-OrbiTrap mass spectrometry as described under “Experimental Procedures.”
FIGURE 2.

Phosphorylation of hCTPS1/2 in serum-starved cells; involvement of CK1. A, alignment of C-terminal regulatory domains of hCTPS1 and hCTPS2. The amino acid sequences of hCTPS1 and hCTPS2 starting at residue 561 through the end of the enzyme are shown. Serine 575, which is uniquely phosphorylated in hCTPS1, is underlined. Low (0.1%) serum conditions increase hCTPS phosphorylation. B and C, HEK293 cells stably transfected with hCTPS1-FLAG (B) or hCTPS2-FLAG (C) DNA were incubated overnight in high (10%) or low (0.1%) FBS. D, HEK293 cells stably transfected with hCTPS2-FLAG DNA were incubated overnight in low serum (0.1% FBS) in the absence or presence of 50 μm IC261, the CK1 inhibitor. The cells were then labeled with 100 μCi/ml [32P]H3PO4 in phosphate-free DMEM for 4 h. The lysates were separated by SDS-PAGE, transferred to a PVDF membrane, and blotted with a FLAG antibody to detect CTPS protein (bottom blot). The membranes were then dried and exposed to a PhosphorImager screen overnight to detect phosphorylated CTPS (top blot).
In the presence of LS, three single phosphorylation events were identified on Ser564, Ser571, and Ser574, all sites located in the C terminus of hCTPS2 (Table 2 and supplemental Fig. S4, A–C). A double phosphorylation event was also detected containing phosphorylated Ser568 and Ser571 (Table 2 and supplemental Fig. S4D). In the presence of HS, the profile was slightly different, with single phosphorylation events detected on Tyr567, Ser568, and Ser571 and a double phosphorylation event at Ser568 and Ser571 (Table 2 and supplemental Fig. S4, E–G). Three of these sites, Ser568, Ser571, and Ser574, have been confirmed as phosphorylation sites in large scale phosphopeptide analyses of cell lysates (33, 34). No additional phosphorylation sites were detected in hCTPS2, and the sequence coverage is shown in supplemental Fig. S5. Based on these observations and our previous studies in hCTPS1 (1), we designated this region as the C-terminal regulatory domain (CRD).
TABLE 2.
Probable phosphorylation sites for human CTPS2 as determined by mass-specific analysis on an Orbitrap LC-MS/MS
The sequence represents amino acids Leu561–Arg579 of human CTPS2. Detected phosphorylation events are designated in bold, underlined type.
| Treatment | Sequence |
|---|---|
| High serum | LSSSDRYSDASDDSFSEPR |
| LSSSDRYSDASDDSFSEPR | |
| LSSSDRYSDASDDSFSEPR | |
| LSSSDRYSDASDDSFSEPR | |
| Low serum | LSSSDRYSDASDDSFSEPR |
| LSSSDRYSDASDDSFSEPR | |
| LSSSDRYSDASDDSFSEPR | |
| LSSSDRYSDASDDSFSEPR |
To examine the importance of these phosphorylation sites, single point mutations at Ser571, Ser574, and Ser575 as well as a deletion of the CRD starting at residue Ser562 (ΔC-CTPS1) were made for hCTPS1 (1) as well as single point mutations at Ser564, Tyr567, Ser568, Ser571, and Ser574 in hCTPS2. These mutant hCTPS proteins were stably expressed in HEK293 cells. As determined by anti-FLAG immunoblotting, WT-hCTPS1 and the hCTPS1 point mutations were expressed at a similar level, whereas the ΔC-CTPS1 was expressed at a much lower level. In addition, WT-hCTPS2 and the hCTPS2 point mutations were expressed at similar levels to each other (Fig. 2 and supplemental Fig. S1). These cells were labeled with [32P]H3PO4 and treated under HS or LS conditions, and the incorporation of radioactivity into hCTPS1 and hCTPS2 was determined by SDS-PAGE analysis.
Treatment of HEK293 cells with LS conditions increased hCTPS phosphorylation compared with HS conditions (Fig. 2). Mutation of Ser574 (hCTPS1) or Ser564, Tyr567, or Ser574 (hCTPS2) did not significantly affect incorporation of 32P into hCTPS1 or hCTPS2, respectively (Fig. 2, Ser564; data not shown). However, the ΔC-CTPS1 and CTPS1-S575A proteins showed little to no phosphorylation compared with WT-CTPS1, consistent with phosphorylation occurring in the CRD (Fig. 2B, third, fourth, ninth, and tenth lanes). CTPS1-S571I was phosphorylated less than WT-CTPS1 but more than the ΔC-CTPS1 and the CTPS1-S575A proteins (Fig. 2B, fifth and sixth lanes). In addition, compared with WT-CTPS2, the CTPS2-S568A and CTPS2-S571A proteins displayed a significant reduction in 32P incorporation after HS and LS treatment, suggesting that Ser568 and Ser571 are the two major phosphorylation sites in hCTPS2 under these conditions (Fig. 2C).
Sequence analysis of the CRD suggested the potential for phosphorylation by CKI, a kinase that recognizes (pS/pT)XX(S/T), where (pS/pT) is phosphoserine or phosphothreonine and X refers to any amino acid (35, 36). To investigate the influence of CKI on CTPS phosphorylation, the cells were metabolically labeled with 32P as described above and incubated with or without the CKI inhibitor, IC261. As shown in Fig. 2D, incubation with IC261 significantly inhibited the phosphorylation of WT-hCTPS2 and reduced the phosphorylation of the S568A, S571A, and S574A mutant CTPS2 proteins.
CK1 Phosphorylates hCTPS2 on Ser568
To further investigate the role of CKI to phosphorylate hCTPS2, we examined the phosphorylation of immunoprecipitated WT and S568A proteins. These proteins were isolated and phosphorylated with purified CKI as described under “Experimental Procedures.” Both WT CTPS2 and S568A proteins were phosphorylated by CK1; however, hCTPS2-S568A incorporated ∼35–40% less than WT-hCTPS2, demonstrating the importance of this site (Fig. 3).
FIGURE 3.

Phosphorylation of hCTPS2 with CK1; identification of Ser568 as a phosphorylation site. HEK293 cells expressing WT-hCTPS2-FLAG or hCTPS2-S568A-FLAG were lysed, and hCTPS2 proteins were isolated as described above. hCTPS2 proteins were incubated with purified CK1 and [32P]ATP as described under “Experimental Procedures,” and the phosphorylated proteins were applied to SDS-PAGE and exposed to film. Lanes 1 and 2, no kinase; lanes 3 and 4, 500 units of CK1; lanes 5 and 6, 1000 units of CK1. A, shown are the phosphorylated (32P) hCTPS2 (WT) and S568A mutant proteins and the corresponding Coomassie-stained gel bands. B, the hCTPS2 bands were excised and quantitated by scintillation counting. This experiment was repeated twice with similar results.
Effects of CRD Mutations on hCTPS Activity
Our previous data demonstrated that an increase in phosphorylation correlated with a decrease in hCTPS1 activity (1). Therefore, the enzymatic activities of several mutant enzymes, including ΔC-hCTPS1, CTPS2-S568A, and CTPS2-S571A, were determined. Time course analyses were performed to assess the rate of CTP formation over time, and UTP dose-response curves were performed to determine the Vmax for the mutated enzymes. CTP dose-response curves were also performed to determine whether phosphorylation of the CRD affected feedback inhibition by CTP.
As shown in Fig. 2B, the ΔC-hCTPS1 construct showed negligible phosphorylation compared with WT-hCTPS1. The kinetic properties of ΔC-hCTPS1 were compared with WT-hCTPS1. ΔC-hCTPS1 had higher activity at every time point compared with WT-hCTPS1, with initial rate kinetics of 100 ± 30 pmol/min that reached equilibrium at 15 min when UTP was limiting (supplemental Fig. S3). When UTP was not limiting, the Vmax for ΔC-hCTPS1 was 1100 ± 200 pmol/min, which is ∼2.5 times higher than the Vmax for WT-hCTPS1. However, the Km for UTP was also higher for ΔC-hCTPS1 at 1.9 ± 0.9 mm, compared with 0.59 ± 0.24 mm for WT-hCTPS1. Despite the difference in apparent affinity for UTP, the feedback inhibition of ΔC-hCTPS1 by CTP (IC50 of 57 ± 9 μm) was similar to WT-CTPS1 (supplemental Fig. S3 and Table 1).
Because hCTPS2-S568A and hCTPS2-S571A showed the greatest decrease in overall hCTPS2 phosphorylation (Fig. 2C), we chose to perform a kinetic analysis of these enzymes. Interestingly, CTPS2-S571A showed similar kinetics to WT-CTPS2 with respect to time, UTP, and CTP, with only a slight increase in Vmax (490 ± 50 pmol/min) and a decrease in UTP affinity (800 ± 200 μm) (Fig. 4 and Table 1). However, the hCTPS2-S568A enzyme showed much higher activity than the wild-type enzyme, with initial rate kinetics of 178 ± 4 pmol/min (Fig. 4A) and a Vmax of 970 ± 40 pmol/min (Fig. 4B). Despite this, the affinity of hCTPS2-S568A was lower for both UTP and CTP, with a Km of 420 ± 60 μm for UTP (Fig. 4B) and an IC50 of 72 ± 7 μm for CTP (Fig. 4C and Table 1). These data indicate that Ser568 is a major regulatory phosphorylation site on hCTPS2 and that mutation of this site relieves the inhibitory effects of phosphorylation.
FIGURE 4.
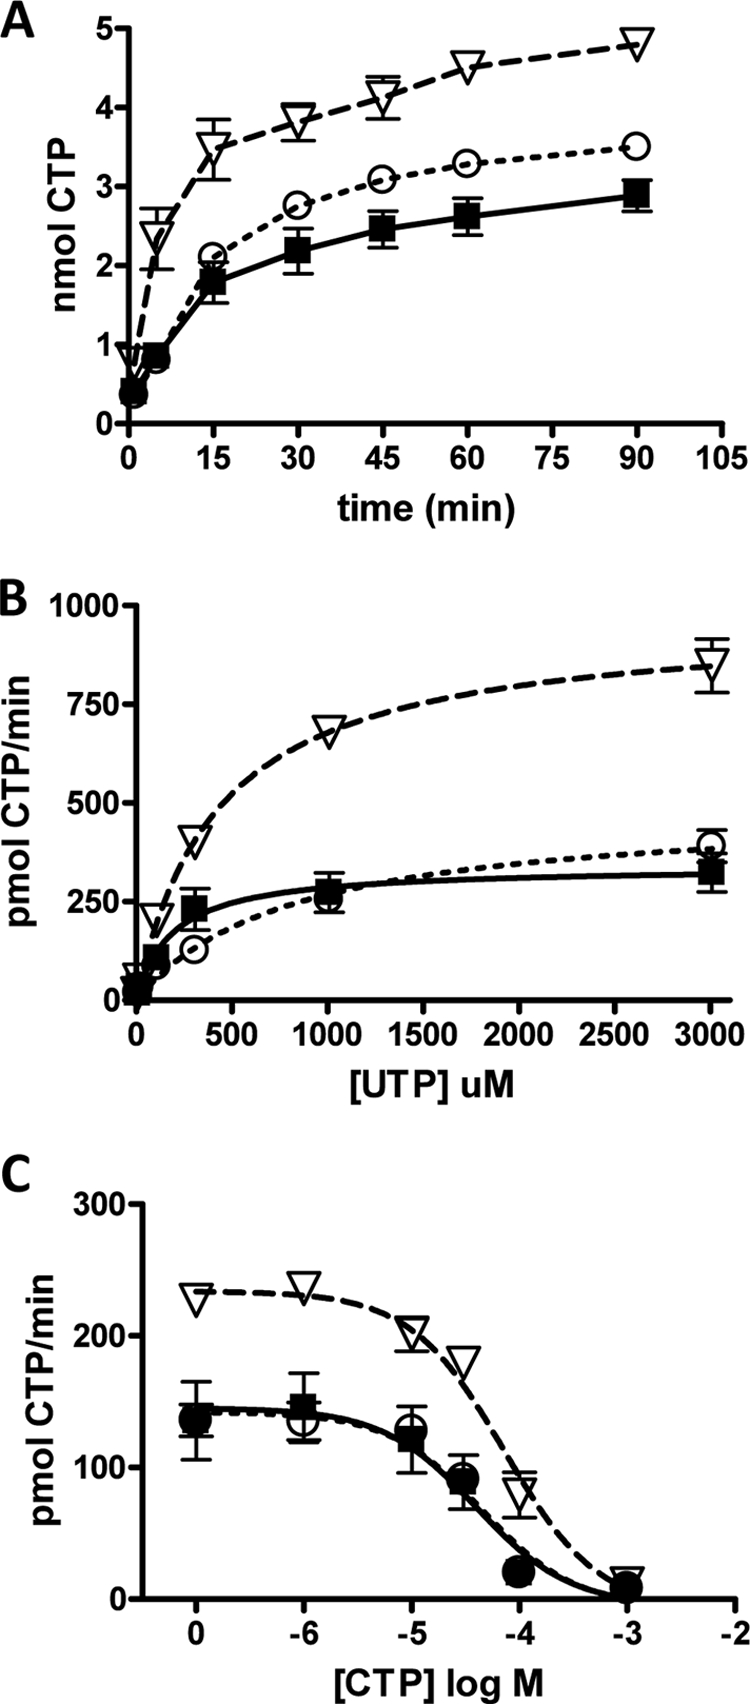
Effect of phosphorylation site mutations on hCTPS2 activity. HEK293 cells expressing WT-hCTPS2-FLAG (solid squares, solid line), hCTPS2-S568A-FLAG (open triangles, dashed line), or hCTPS2-S571A-FLAG (open circles, dotted line) were lysed and assayed for CTPS activity as described above. A, samples were incubated for the indicated time intervals at 37 °C from 1 to 90 min. The data are expressed as nmol of CTP formed and are from three separate experiments. Note that the y axis of A is expressed as nmol of CTP synthesized, not pmol/min CTP as on the other graphs. B, samples were incubated with the indicated UTP concentrations for 15 min at 37 °C. C, samples were incubated with the indicated CTP concentrations for 15 min at 37 °C. The data in B and C are expressed as pmol/min CTP formed and are from three separate experiments. Note that the WT-hCTPS2 data are the same data as presented in supplemental Fig. 1B and Fig. 1 (B and E) and are shown here for comparison purposes.
Mutation of Ser568 Affects the Glutaminase Activity of hCTPS2
Because we observed enhanced activity with the S568A mutant, we hypothesized that phosphorylation of this site may affect the glutaminase activity of hCTPS2. To test this idea, we compared the activity of WT-hCTPS2 and hCTPS2-S568A when assayed with ammonia, the product of the glutaminase reaction. WT-hCTPS2 showed similar amounts of activity when assayed with either Gln or ammonia as the substrate (Fig. 5). By comparison, hCTPS2-S568A displayed approximately three times higher activity than WT-hCTPS2 when assayed with Gln, similar to our earlier results (Table 1). However, when assayed with ammonia, hCTPS2-S568A had lower activity and was more similar to WT hCTPS2 (Fig. 5). These data suggested that phosphorylation of the CRD (Ser568) may influence the ability of hCTPS2 to utilize Gln but not ammonia as a substrate. Kinetic analysis demonstrated that the Km for Gln was essentially unchanged for this mutant (Table 1). Instead, these results are consistent with the S568A mutation, affecting the rate of glutamine hydrolysis (Table 1).
FIGURE 5.
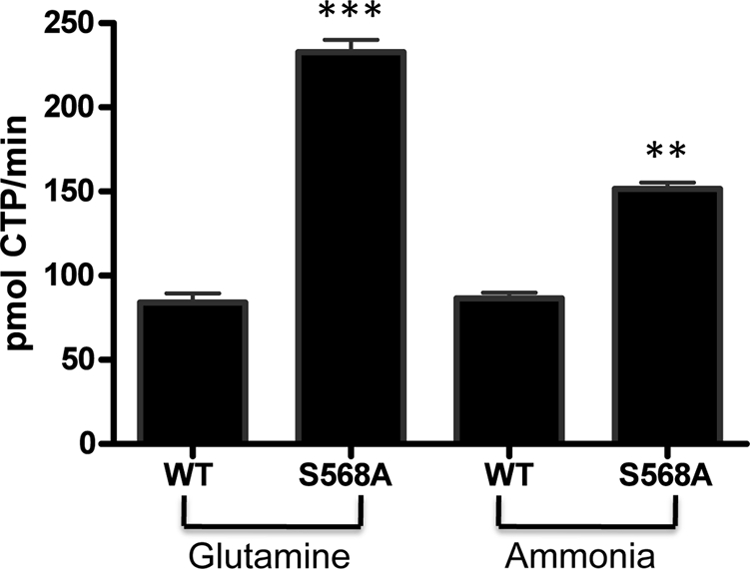
Comparison of glutamine and ammonia-dependent activity for hCTPS2. HEK293 cells expressing WT-hCTPS2-FLAG and hCTPS2-S568A-FLAG were lysed, and hCTPS2 was isolated by FLAG antibody immunoprecipitation. hCTPS2 proteins were assayed for CTPS activity as described above with 10 mm glutamine or 10 mm ammonia as the substrate. The data are expressed as pmol/min CTP formed from two experiments. ***, p < 0.001; **, p < 0.01 from the mean of duplicate samples.
DISCUSSION
The studies described here are the first to examine the detailed kinetic properties of the individual hCTPS1 and hCTPS2 enzymes and to investigate the regulation of hCTPS2 by phosphorylation. Specifically we observed important differences in the kinetic behavior and phosphorylation of these enzymes. hCTPS1 and hCTPS2 activity was maximal when assayed with the approximate physiological concentrations for ATP (3.2 mm), GTP (0.5 mm) (6), and glutamine (0.65 mm) (37); however, hCTPS2 exhibited significantly faster initial rate kinetics than hCTPS1. In contrast to earlier studies with GSK-3 and hCTPS1, we find that hCTPS2 was phosphorylated by CK1 and identified Ser568 as an important site of phosphorylation and regulation. Importantly, these studies suggest that the multisite phosphorylation of the CRD of both hCTPS1 and hCTPS2 may occur through regulation of the glutaminase activity of these enzymes.
As expected, we observed that GTP was required for hCTPS1 and hCTPS2 activity. This is similar to that observed with the E. coli enzyme (28) but differs from that observed with the yeast CTPS enzymes (URA7,8), in which GTP enhances CTPS activity but is not absolutely required (4). At high GTP concentrations, significant inhibition of CTP synthesis was observed but not until GTP concentrations were well above normal levels. This property is also distinct from the E. coli enzyme, in which higher concentrations of GTP (0.15 mm) inhibit CTP formation through an uncoupling of Gln hydrolysis and CTP synthesis (31).
These results indicate that the maximal enzymatic rates of hCTPS1 and hCTPS2 occur at physiological concentrations of ATP, GTP, and glutamine. By contrast, the physiological concentrations of UTP and CTP are close to their Km and IC50 values, respectively, and may thereby facilitate a greater control over CTPS activity. The Km value for UTP for hCTPS1 activity is 590 ± 240 μm, close to the cellular concentration of 600 μm. This may allow small changes in UTP levels to control CTP synthesis. We observed that the Km value for UTP for hCTPS2 is much lower at 190 ± 80 μm, potentially explaining the faster initial rate kinetics displayed by hCTPS2 compared with hCTPS1.
Both enzymes showed similar CTP feedback inhibition properties. The IC50 values were 42 ± 8 and 40 ± 10 μm for hCTPS1 and hCTPS2, respectively. These values are close to the lower end of the physiological concentration of CTP (280 ± 240 μm), suggesting that at normal CTP levels, hCTPS enzymes are not very active. However, as CTP levels decline, hCTPS is likely to become more active. The high affinity for CTP, particularly in comparison with the affinity for UTP, may be instrumental in determining the CTP concentrations within the cell, particularly when CTP is in high demand.
Activity of both hCTPS1 and hCTPS2 was regulated by oligomerization as seen with other CTPS enzymes (8, 16, 25, 38). Tetramerization can be induced by ATP and/or UTP, and at high enzyme concentrations equilibrium often exists between monomers, dimers, and tetramers (29). In the absence of ATP and UTP, hCTPS1 and hCTPS2 are found primarily as monomers and dimers. However, in the presence of 1 mm ATP and/or UTP, hCTPS1 and hCTPS2 form tetramers, suggesting that both hCTPS isoforms normally exist as tetramers. It has been shown that CTPS is only active in this tetrameric form (8, 11, 27, 29). In contrast, the yeast CTPS (URA7) requires UTP but not ATP for tetramerization, although ATP enhances tetramerization (8). Similar to hCTPS, ATP or UTP alone can induce the formation of tetramers in E. coli (25). However, in contrast to hCTPS, ATP and UTP synergistically stimulate tetramer formation in E. coli (16). Interestingly, the pattern of elution of hCTPS1 appears to be more complex than simple monomers, dimers, and tetramers. In particular, the presence of hCTPS1 in earlier fractions could indicate that hCTPS1 is part of a larger signaling complex, although this has not been directly investigated.
Importantly, these studies identified phosphorylation of the C-terminal region of hCTPS as an additional and important mechanism of regulation. This is predicted to be a highly unstructured region and is unique to CTPS enzymes from higher eukaryotes (1). Based on these and our previous studies with CTPS1, we termed this region the CRD. We observed the greatest increase in hCTPS phosphorylation under nutrient deprivation conditions (represented here by treating cells with 0.1% FBS). As previously shown, this increase in phosphorylation correlates with a decrease in hCTPS1 activity (1). This differs from other CTPS enzymes, including yeast URA7 (which lacks the CRD), in which phosphorylation activates the enzyme (3, 21–23). In this study we demonstrate that deletion of the CRD from hCTPS1 resulted in enhanced activity, supporting the thesis that this region is important to the regulation of hCTPS1.
Similar to hCTPS1, we determined that hCTPS2 contains multiple phosphorylation sites in the C-terminal tail, including Ser564, Tyr567, Ser568, Ser571, and Ser574. We identified Ser568 as an important site of hCTPS2 regulation, because mutating this phosphorylation site significantly increased hCTPS2 activity. Moreover, we show that Ser568 is phosphorylated by CK1 in vitro and is a major phosphorylation site in vivo. Importantly, our studies suggest that the effect of Ser568 phosphorylation may be to modulate the glutaminase reaction. This is supported by our findings that mutation of this site resulted in enhanced activity with Gln but not ammonia as the substrate. Based on the reported x-ray crystal structure for the glutaminase domain of hCTPS2 (PDBe), we propose that the flexible CRD may interact with the neighboring glutaminase domain when phosphorylated. Mutation of Ser568 in hCTPS2 decreased phosphorylation and feedback inhibition by CTP (Figs. 2C and 4C), indicating that phosphorylation of Ser568 may also contribute to regulation of hCTPS2 through this mechanism. This contrasts that observed with the yeast enzymes (URA7, 8), which show decreased CTP inhibition after phosphorylation of Ser424 (3, 22).
Comparison of the phosphorylation sites in hCTPS1 and hCTPS2 shows that the proposed phosphorylation site for GSK3β (Ser575) in hCTPS1 is not conserved in hCTPS2 (Fig. 1). This suggests that different kinases are responsible for the phosphorylation of hCTPS2. Ser568, as well as other phosphorylation sites in the CRD of hCTPS2, is a consensus phosphorylation site for CK1, and our experiments indicate that CK1 contributes to the phosphorylation of hCTPS2. Both the in vivo metabolic labeling studies using the CK1 inhibitor (IC261) and the in vitro phosphorylation studies with active CK1 support the role of CK1 in phosphorylating hCTPS2 on Ser568 and potentially other sites.
In summary, these studies provide novel enzymatic characterization of the isolated hCTPS isoforms. Both hCTPS1 and hCTPS2 are maximally activated at physiological concentrations of ATP, GTP, and Gln, and both isoforms undergo tetramerization in the presence of ATP and/or UTP. In addition, both isoforms have a higher affinity for CTP compared with UTP, suggesting that CTP feedback inhibition is important for the regulation of hCTPS activity. Both isoforms also exhibit increased phosphorylation after low serum treatment, suggesting that hCTPS regulation is dependent on nutritional conditions. Mutational analysis and deletion of the CRD supports the hypothesis that phosphorylation of this peptide inhibits enzyme activity. Whereas phosphorylation of Ser571 and Ser575 contributed significantly to hCTPS1 regulation, Ser568 was the major phosphorylation site important for hCTPS2 regulation. Thus the unique pattern of phosphorylation and phosphorylation by different kinases suggests that ultimately different mechanisms of regulation control the activity of these individual isoforms.
Supplementary Material
Acknowledgments
We thank Dr. Robert Nicholas for the use of the FPLC and Joshua Tomberg for technical assistance.
This work was supported, in whole or in part, by National Institutes of Health Grant R01-GM069976 (to L. M. G.).

The on-line version of this article (available at http://www.jbc.org) contains supplemental Table S1 and Figs. S1–S5.
- CTPS
- cytidine triphosphate synthetase
- CRD
- C-terminal regulatory domain
- CK1
- casein kinase 1
- GSK3β
- glycogen synthase kinase 3β
- hCTPS
- human CTPS
- ΔC
- deletion of CRD, residues Ser562–Asp591
- RIPA
- radioimmune precipitation assay
- LS
- low serum
- HS
- high serum
- Tricine
- N-[2-hydroxy-1,1-bis(hydroxymethyl)ethyl]glycine
- ddH2O
- double distilled H2O.
REFERENCES
- 1.Higgins M. J., Graves P. R., Graves L. M. (2007) J. Biol. Chem. 282, 29493–29503 [DOI] [PubMed] [Google Scholar]
- 2.Huang M., Graves L. M. (2003) Cell Mol. Life Sci. 60, 321–336 [DOI] [PMC free article] [PubMed] [Google Scholar]
- 3.Park T. S., Ostrander D. B., Pappas A., Carman G. M. (1999) Biochemistry 38, 8839–8848 [DOI] [PubMed] [Google Scholar]
- 4.Nadkarni A. K., McDonough V. M., Yang W. L., Stukey J. E., Ozier-Kalogeropoulos O., Carman G. M. (1995) J. Biol. Chem. 270, 24982–24988 [DOI] [PubMed] [Google Scholar]
- 5.Ostrander D. B., O'Brien D. J., Gorman J. A., Carman G. M. (1998) J. Biol. Chem. 273, 18992–19001 [DOI] [PubMed] [Google Scholar]
- 6.Traut T. W. (1994) Mol. Cell Biochem. 140, 1–22 [DOI] [PubMed] [Google Scholar]
- 7.van Kuilenburg A. B., Meinsma R., Vreken P., Waterham H. R., van Gennip A. H. (2000) Biochim. Biophys. Acta 1492, 548–552 [DOI] [PubMed] [Google Scholar]
- 8.Pappas A., Yang W. L., Park T. S., Carman G. M. (1998) J. Biol. Chem. 273, 15954–15960 [DOI] [PubMed] [Google Scholar]
- 9.von der Saal W., Anderson P. M., Villafranca J. J. (1985) J. Biol. Chem. 260, 14993–14997 [PubMed] [Google Scholar]
- 10.von der Saal W., Villafranca J. J. (1985) J. Am. Chem. Soc. 107, 703–704 [Google Scholar]
- 11.Endrizzi J. A., Kim H., Anderson P. M., Baldwin E. P. (2004) Biochemistry 43, 6447–6463 [DOI] [PMC free article] [PubMed] [Google Scholar]
- 12.MacLeod T. J., Lunn F. A., Bearne S. L. (2006) Biochim. Biophys. Acta 1764, 199–210 [DOI] [PubMed] [Google Scholar]
- 13.Willemoës M., Sigurskjold B. W. (2002) Eur. J. Biochem. 269, 4772–4779 [DOI] [PubMed] [Google Scholar]
- 14.Han G. S., Sreenivas A., Choi M. G., Chang Y. F., Martin S. S., Baldwin E. P., Carman G. M. (2005) J. Biol. Chem. 280, 38328–38336 [DOI] [PMC free article] [PubMed] [Google Scholar]
- 15.Yang W. L., McDonough V. M., Ozier-Kalogeropoulos O., Adeline M. T., Flocco M. T., Carman G. M. (1994) Biochemistry 33, 10785–10793 [DOI] [PubMed] [Google Scholar]
- 16.Lunn F. A., Macleod T. J., Bearne S. L. (2008) Biochem. J. 412, 113–121 [DOI] [PubMed] [Google Scholar]
- 17.Endrizzi J. A., Kim H., Anderson P. M., Baldwin E. P. (2005) Biochemistry 44, 13491–13499 [DOI] [PMC free article] [PubMed] [Google Scholar]
- 18.Ozier-Kalogeropoulos O., Fasiolo F., Adeline M. T., Collin J., Lacroute F. (1991) Mol. Gen. Genet. 231, 7–16 [DOI] [PubMed] [Google Scholar]
- 19.Ozier-Kalogeropoulos O., Adeline M. T., Yang W. L., Carman G. M., Lacroute F. (1994) Mol. Gen. Genet. 242, 431–439 [DOI] [PubMed] [Google Scholar]
- 20.Park T. S., O'Brien D. J., Carman G. M. (2003) J. Biol. Chem. 278, 20785–20794 [DOI] [PubMed] [Google Scholar]
- 21.Yang W. L., Carman G. M. (1996) J. Biol. Chem. 271, 28777–28783 [DOI] [PubMed] [Google Scholar]
- 22.Yang W. L., Bruno M. E., Carman G. M. (1996) J. Biol. Chem. 271, 11113–11119 [DOI] [PubMed] [Google Scholar]
- 23.Yang W. L., Carman G. M. (1995) J. Biol. Chem. 270, 14983–14988 [DOI] [PMC free article] [PubMed] [Google Scholar]
- 24.Chang Y. F., Martin S. S., Baldwin E. P., Carman G. M. (2007) J. Biol. Chem. 282, 17613–17622 [DOI] [PMC free article] [PubMed] [Google Scholar]
- 25.Levitzki A., Koshland D. E., Jr. (1972) Biochemistry 11, 247–253 [DOI] [PubMed] [Google Scholar]
- 26.Long C. W., Levitzki A., Koshland D. E., Jr. (1970) J. Biol. Chem. 245, 80–87 [PubMed] [Google Scholar]
- 27.Kursula P., Flodin S., Ehn M., Hammarström M., Schüler H., Nordlund P., Stenmark P. (2006) Acta Crystallogr. Sect. F Struct. Biol. Cryst. Commun. 62, 613–617 [DOI] [PMC free article] [PubMed] [Google Scholar]
- 28.Long C. W., Pardee A. B. (1967) J. Biol. Chem. 242, 4715–4721 [PubMed] [Google Scholar]
- 29.Goto M., Omi R., Nakagawa N., Miyahara I., Hirotsu K. (2004) Structure 12, 1413–1423 [DOI] [PubMed] [Google Scholar]
- 30.Levitzki A., Koshland D. E., Jr. (1972) Biochemistry 11, 241–246 [DOI] [PubMed] [Google Scholar]
- 31.MacDonnell J. E., Lunn F. A., Bearne S. L. (2004) Biochim. Biophys. Acta 1699, 213–220 [DOI] [PubMed] [Google Scholar]
- 32.Bearne S. L., Hekmat O., Macdonnell J. E. (2001) Biochem. J. 356, 223–232 [DOI] [PMC free article] [PubMed] [Google Scholar]
- 33.Olsen J. V., Blagoev B., Gnad F., Macek B., Kumar C., Mortensen P., Mann M. (2006) Cell 127, 635–648 [DOI] [PubMed] [Google Scholar]
- 34.Dephoure N., Zhou C., Villén J., Beausoleil S. A., Bakalarski C. E., Elledge S. J., Gygi S. P. (2008) Proc. Natl. Acad. Sci. U.S.A. 105, 10762–10767 [DOI] [PMC free article] [PubMed] [Google Scholar]
- 35.Flotow H., Roach P. J. (1989) J. Biol. Chem. 264, 9126–9128 [PubMed] [Google Scholar]
- 36.Flotow H., Graves P. R., Wang A. Q., Fiol C. J., Roeske R. W., Roach P. J. (1990) J. Biol. Chem. 265, 14264–14269 [PubMed] [Google Scholar]
- 37.Tapiero H., Mathé G., Couvreur P., Tew K. D. (2002) Biomed. Pharmacother. 56, 446–457 [DOI] [PubMed] [Google Scholar]
- 38.Wadskov-Hansen S. L., Willemoës M., Martinussen J., Hammer K., Neuhard J., Larsen S. (2001) J. Biol. Chem. 276, 38002–38009 [DOI] [PubMed] [Google Scholar]
Associated Data
This section collects any data citations, data availability statements, or supplementary materials included in this article.