Abstract
Cells are responding to hypoxia via prolyl-4-hydroxylase domain (PHD) enzymes, which are responsible for oxygen-dependent hydroxylation of the hypoxia-inducible factor (HIF)-1α subunit. To gain further insight into PHD function, we generated knockdown cell models for the PHD2 isoform, which is the main isoform regulating HIF-1α hydroxylation and thus stability in normoxia. Induction of a PHD2 knockdown in tetracycline-inducible HeLa PHD2 knockdown cells resulted in increased F-actin formation as detected by phalloidin staining. A similar effect could be observed in the stably transfected PHD2 knockdown cell clones 1B6 and 3B7. F-actin is at least in part responsible for shaping cell morphology as well as regulating cell migration. Cell migration was impaired significantly as a consequence of PHD2 knockdown in a scratch assay. Mechanistically, PHD2 knockdown resulted in activation of the RhoA (Ras homolog gene family member A)/Rho-associated kinase pathway with subsequent phosphorylation of cofilin. Because cofilin phosphorylation impairs its actin-severing function, this may explain the F-actin phenotype, thereby providing a functional link between PHD2-dependent signaling and cell motility.
Keywords: Actin, Hydroxylase, Hydroxyproline, Hypoxia, Signal Transduction
Introduction
In response to hypoxia, cells are initiating a hypoxia-inducible gene expression program. Genes that are expressed in an oxygen-dependent manner are involved in pH-regulation, anaerobic metabolism, erythropoiesis, angiogenesis, etc. to support cellular adaptation toward the oxygen-deprived conditions (1). Most of the hypoxia-inducible genes are transcriptionally regulated by the hypoxia-inducible factor-1 (HIF-1).3 HIF-1 is a heterodimeric complex; whereas the HIF-1β subunit is constitutively expressed, the stability of the HIF-1α subunit depends on the oxygen availability (2). The oxygen-dependent stability of HIF-1α is mediated by proline hydroxylation (3–5). Hydroxylated HIF-1α is recognized by the von Hippel-Lindau protein, which targets it for polyubiquitination and proteasomal degradation.
The HIF-1α hydroxylation reaction is facilitated by three prolyl-4-hydroxylase domain (PHD) enzymes (6–8). PHD1–3 are members of the oxoglutarate-dependent dioxygenase family (9). Although in vitro, all three PHDs are able to hydroxylate HIF-1α, their in vivo functions seem to differ as indicated by the recently described PHD knock-out models (10–12). This may be explained partly by their different tissue-specific expression patterns (13–15). Moreover, PHD2 is deeply involved in the normoxic degradation of HIF-1α, whereas PHD3 mediates hydroxylation of HIF-1α mostly during hypoxia, which is mainly due to the drastic hypoxic induction of PHD3 (16). This ensures a negative feedback regulation, which limits the hypoxic accumulation of HIF-1α (17).
In addition to their differential involvement in the HIF-signal transduction pathway, there is increasing evidence for PHD-dependent functions that are unrelated to HIF. For PHD1, PHD2 and PHD3 a regulation of the IκB kinase, the large subunit of RNA polymerase II and ATF-4 has been suggested, respectively (18–20). A recently described iTRAQ proteome approach has additionally led to the suggestion that proteins related to the cytoskeleton are regulated as a function of PHD2 (21).
We have described recently a tetracycline (Tet)-inducible PHD2 knockdown HeLa cell model, which was used for identifying PHD2-dependent effects (22). In these cells, we now discovered a PHD2-dependent formation of filamentous (F)-actin polymers, which subsequently led to the identification of the impact of PHD2 on the RhoA/cofilin pathway.
EXPERIMENTAL PROCEDURES
Cell Lines and Cell Culture
The establishment and characterization of the Tet-inducible PHD2 knockdown cell line 2.1.1-16 by stable transfection of HeLa T-Rex cells (Invitrogen) was described recently (22). For generating the 2.1.1-16 cell line, the following shRNA sequences were used: shPHD2.1 (forward), 5′-GGACTGGAAGAAGCACAAGCTTTCAAGAGAAGCTTGTGCTTCTTCCAGTCC-3′ and shPHD2.1 (reverse), 5′-GGACTGGAAGAAGCACAAGCTTCTCTTGAAAGCTTGTGCTTCTTCCAGTCC-3′. To obtain HeLa cells, which constitutively express a PHD2 shRNA targeting human PHD2 or a nontargeting control shRNA, pLKO.1-puro silencer plasmids encoding the respective shRNA sequence driven by the U6 promoter (Sigma) were used (PHD2 TRCN #1045 (forward), 5′-CCGGTGGAGATGGAAGATGTGTGACCTCGAGGTCACACATCTTCCATCTCCATTTTT-3′;PHD2 TRCN #1045 (reverse), 5′-AAAAATGGAGATGGAAGATGTGTGCCTCGAGGTCACACATCTTCCATCTCCACCGG-3′). For lentiviral transfection, viral particles were produced in HEK293T cells using the ViraPower lentiviral expression system according to the manufacturer's instructions (Invitrogen). Cells were treated with 5 μg/ml puromycin (Invitrogen) for selection of cells with successful integration of the plasmid. After subcloning, two independent PHD2 knockdown clones, i.e. 1B6 and 3B7, and one control shRNA expressing clone were successfully established. For lentiviral retransfection of PHD2 WT, an enzymatically inactive PHD2 variant (H131A/D315A (23)) or as a control of GFP in HeLa WT and 3B7 cells pLenti6.2/V5-PHD2 WT, pLent6.2/V5-PHD2 H131A/D315A and pLenti6.2/GW/EmGFP were used, respectively. Pools of clones were derived by blasticidin (Invitrogen; 5 μg/ml) selection and analyzed for effective PHD2 or GFP overexpression by immunoblotting or FACS analyses, respectively.
A549 cells were obtained from Professor Dr. G. Wulff (Department of Oncology, Georg August University Göttingen). Cells were cultivated in high glucose modified Eagle's medium containing 10% Tet-free fetal calf serum (Biochrom), 50 units/ml penicillin G, and 50 μg/ml streptomycin (Pan Biotech, Aidenbach, Germany) in a humidified 5% CO2, 95% air atmosphere at 37 °C.
For hypoxic conditions, O2 levels were decreased to 1% with N2 in an in vivo 400 work station (IUL Instruments GmbH, Königswinter, Germany). In some experiments, cells were treated with 10 μg/ml Tet (Sigma-Aldrich), 1 mm DMOG (Alexis) or 10 μm Y-27632 (Bioaffin GmBH Co KG, Kassel, Germany) for the indicated time periods.
Scratch Assay
For scratch assays, cells were seeded in six-well plates until they reached ∼80% cell density. Using a sterile 200-μl pipette tip, the cell layer was scratched in each well to create a cleared line. Before and at different time points after creating the scratch, it was photographed. The cell-free area was determined using an automatic software-assisted image analysis (S.CORE, S.CO LifeScience GmBH).
Gene Silencing by RNAi
The following stealth RNAi (Invitrogen) sequences were used: PHD2 siRNA (forward), 5′-GGACGAAAGCCAUGGUUGCUUGUUA-3′; PHD2 siRNA (reverse), 5′-UAACAAGCAACCAUGGCUUUCGUCC-3′; PHD3 siRNA (forward), 5′-GCUAUCCGGGAAAUGGAACAGGUUA-3′; PHD3 siRNA (reverse), 5′-UAACCUGUUCCAUUUCCCGGAUAGC-3′; HIF-1α siRNA (forward), 5′-AGCCAUUUACAUAAUAUAGAA-3′; and HIF-1α siRNA (reverse), 5′-UUCUAUAUUAUGUAAAUGGCU-3′. AllStars nontargeting control siRNA was obtained from Qiagen. HeLa and A549 cells were transfected with 80 nm siRNA using Lipofectamine 2000 (Invitrogen).
Phalloidin Staining
Cells were grown on coverslips. For phalloidin staining, cells were fixed with 3.7% paraformaldehyde for 10 min. Subsequently, cells were washed with PBS and incubated with 0.1% Triton X-100 for 5 min. After washing, nonspecific binding was blocked by incubation of cells with blocking solution (1% BSA in PBS) for 20 min. Afterward, cells were incubated with 0.165 μm phalloidin-Alexa Fluor 488 (Invitrogen) for 20 min in the dark. Cells were analyzed by fluorescence microscopy (Axio Observer D1, Carl Zeiss, Göttingen, Germany).
Analysis of F/G-actin Content
F-actin content compared with the amount of G-actin was determined using the G/F-actin in vivo assay kit (Cytoskeleton, Inc.) according to the manufacturer's instructions. In brief, cells were homogenized in lysis buffer and F-actin stabilization buffer (50 mm PIPES, pH 6.9, 50 mm KCl, 5 mm MgCl2, 5 mm EGTA, 5% (v/v) glycerol, 0.1% Nonidet P-40, 0.1% Triton X-100, 0.1% Tween 20, 0.1% 2-mercapto-ethanol, and 0.001% AntifoamC plus protease inhibitor mixture) followed by centrifugation for 1 h at 100,000 × g at 37 °C to separate the F-actin from the G-actin pool. The pellets containing the F-actin were resuspended in hot SDS-sample buffer. The supernatants containing the G-actin were likewise collected. Equal amounts of both the supernatant (G-actin) and the resuspended pellet (F-actin) were subjected to Western blotting with the use of an anti-actin antibody.
Protein Extraction and Immunoblot Analyses
Cells were lysed in 8 m urea and 1% CHAPS. Subsequently, lysates were treated with ultrasound (SONOPLUS HD 2070, Bandelin GmbH, Berlin, Germany). Protein concentrations were determined by the Bradford method using BSA as a standard. For immunoblot analysis, protein extracts were electrophoresed through SDS-polyacrylamide gels and electrotransferred onto nitrocellulose membranes (Amersham Biosciences) by semidry blotting (PeqLab, Erlangen, Germany). For detection of specific proteins, the following primary and secondary HRP-labeled antibodies were used: anti-HIF-1α (catalog no. 610959, Transduction Laboratories), anti-Ser3 phospho-cofilin (catalog no. sc-12912-R, Santa Cruz Biotechnology), anti-cofilin (catalog no. ab42824, Abcam), anti-PHD2 (NB 100–137, Novus Biologicals), anti-PHD3 (NB 100-303, Novus Biologicals), anti-β-actin (catalog no. A5441, Sigma), anti-RhoA (catalog no. sc-418, Santa Cruz Biotechnology), anti-ROCK1 (catalog no. sc-5560, Santa Cruz Biotechnology), HRP-labeled anti-mouse (catalog no. sc-2005, Santa Cruz Biotechnology), and HRP-labeled anti-rabbit (catalog no. sc-2004, Santa Cruz Biotechnology). Chemiluminescence detection of horseradish peroxidase was performed by incubation of the membranes with 100 mm Tris-HCl, pH 8.5, 2.65 mm H2O2, 0.45 mm luminol, and 0.625 mm coumaric acid for 1 min followed by detection of chemiluminescence signals using the LAS3000 (Fuji).
GTP RhoA Activity Assay
RhoA activation was measured by the quantification of GTP-bound RhoA using the G-LISATM RhoA activation biochem kit according to the manufacturer's recommendations (Cytoskeleton).
ROCK Activity Assay
Rho-associated kinase (ROCK) activity was determined using a commercially available kit according to the manufacturer's recommendations (MBL International, Woburn, MA).
Statistical Analyses
The statistical analyses were performed using Student‘s two-tailed t test. Data are shown as means ± S.E. Values of p < 0.05 were considered statistically significant.
RESULTS
Changes in Actin Filament Formation and Cell Migration as a Consequence of PHD2 Knockdown
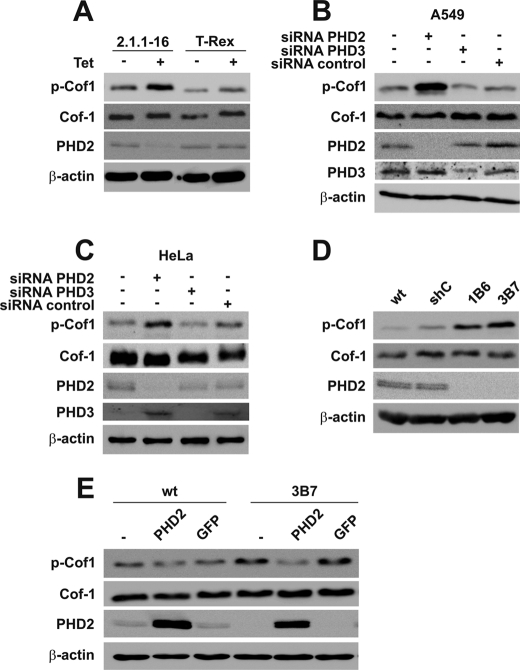
We have recently established the 2.1.1-16 cells, which constitutively express a Tet-inducible PHD2 shRNA (22). Addition of Tet to the cell culture medium results in a significant down-regulation of PHD2 protein levels (Fig. 1A). To exclude shRNA-unrelated, Tet-inducible effects, we performed all experiments additionally in the parental HeLa T-Rex wild type cells, which have a Tet-independent PHD2 expression. Furthermore, we established the PHD2 knockdown HeLa cell clones 1B6 and 3B7, which express constitutively a PHD2 shRNA resulting in decreased PHD2 protein levels (Fig. 1B). HeLa cells, expressing a nontargeting control shRNA were produced simultaneously and used as suitable control cells.
FIGURE 1.
F-actin formation in PHD2 knockdown cells. A, 2.1.1-16 and HeLa T-Rex cells were treated with or without 10 μg/ml Tet for 96 h. Subsequently, cells were lysed, and protein extracts were analyzed by immunoblot. B, WT HeLa cells and stably transfected control shRNA (shC) or PHD2 shRNA 1B6 and 3B7 cells were lysed, and protein extracts were analyzed by immunoblot. C, 2.1.1-16 and HeLa T-Rex cells were grown on coverslips and treated with 10 μg/ml Tet for 96 h. Subsequently, cells were fixed, and F-actin organization was analyzed by phalloidin staining. D, WT HeLa, control shRNA, 1B6, and 3B7 cells were grown on coverslips. Subsequently, cells were fixed, and F-actin organization was analyzed by phalloidin staining.
Actin microfilaments, which form a three-dimensional cytoskeletal network throughout the cell, are shaping cell morphology via continuous remodeling (24). After having generated the PHD2 knockdown cell models, we noticed that the cytoskeletal arrangement of actin filaments was changed as a consequence of the PHD2 knockdown. Individual G-actin subunits can assemble into long filamentous polymers called F-actin. These linear polymers of actin subunits are at least in part responsible for cell morphology. We performed fluorescent phalloidin staining as to investigate the distribution of F-actin in cells. Phalloidin binds specifically at the interface between F-actin subunits, locking adjacent subunits together (25). Induction of the PHD2 knockdown by treating 2.1.1-16 cells with Tet resulted in a rearrangement of the actin cytoskeleton with more prominent F-actin (Fig. 1C). Treating HeLa T-Rex cells with Tet excluded a Tet-inducible nonspecific effect, because in these cells, no Tet-induced F-actin accumulation was detectable. Similar prominent phalloidin-stained F-actin was detected in the PHD2 knockdown 1B6 and 3B7 cells but not in the wild type or shRNA control cells (Fig. 1D).
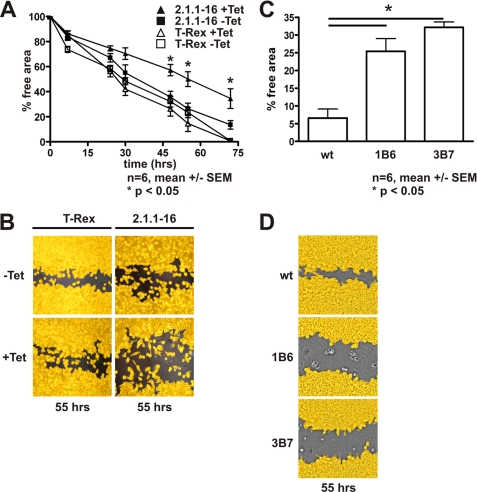
Cell migration appears to be tightly coupled to actin assembly (26). Cells with dysregulated F-actin formation have defects in their migration abilities (27). Therefore, we tested whether knockdown of PHD2 indeed affects cell migration. To this end, confluent 2.1.1-16 and HeLa T-Rex cells were subjected to a scratch assay to monitor cell motility. Cells were scraped with a pipette tip to create a cell-free area, and images were captured at the beginning and subsequent regular intervals. The cell-free area was determined and analyzed as a marker for wound healing/cell migration activity. A significantly decreased closure of the cell free area was seen as a consequence of the PHD2 knockdown in the 2.1.1-16 cells (Fig. 2, A and B) as well as in the 1B6 and 3B7 cells (Fig. 2, C and D). In this regard, it is important to note that the difference in closing the scratch cannot be explained by changes in cell proliferation, which did not differ significantly comparing 2.1.1-16 and HeLa T-Rex cells treated or untreated with Tet (22) as well as comparing 1B6 and 3B7 cells with the wild type cells or the nontargeting control shRNA cells (cell doubling times: WT, 16 h; control shRNA, 15 h; 1B6, 17.1 h; and 3B7, 15.5 h).
FIGURE 2.
Cell migration in a scratch wound healing assay is impaired in PHD2 knockdown cells. A, 2.1.1-16 cells and HeLa T-Rex cells were treated with or without 10 μg/ml Tet for 96 h in six-well plates. Using a sterile 200-μl pipette tip, the cell layer was scratched in each well to create a cleared line. Subsequently, the cell-free area was determined using an automatic software-assisted image analysis. B, representative photographs of 2.1.1-16 and HeLa T-Rex cells with or without Tet treatment 55 h after setting the scratch. C, WT HeLa, 1B6, and 3B7 cells were treated as described in A. The cell-free area was determined 55 h after setting the scratch. D, representative photographs of WT HeLa, 1B6, and 3B7 cells 55 h after setting the scratch.
PHD2 Affects Phosphorylation Status of Cofilin
To uncover the molecular events, which result in PHD2-mediated F-actin assembly, we examined the RhoA/ROCK/Cof-1 pathway. RhoA integrates stimuli from the cell microenvironment of the cell and acts as a signaling node governing cytoskeletal actin filament turnover and thereby cell motility (28). It executes its effects upon several known effector proteins, including Rho-associated kinase (ROCK). In its GTP-bound form, RhoA activates ROCK that in turn phosphorylates LIM kinase 1 (29), which interferes with actin assembly by phosphorylating the actin depolymerization factor Cof-1 (30, 31). Cof-1 regulates actin dynamics by severing actin filaments and sequestering actin monomers from the pointed end of actin filaments (32). Whereas the nonphosphorylated form of Cof-1 is responsible for actin severing, RhoA/ROCK/LIM kinase 1-dependent phosphorylation decreases Cof-1 activity (33).
The total Cof-1 protein expression did not differ in Tet-treated versus non-Tet-treated 2.1.1-16 cells (Fig. 3A). However, when analyzing the Ser3-phosphorylated form of Cof-1, we identified an increased phosphorylation of Cof-1 as a consequence of PHD2 down-regulation. Transient transfection of HeLa and A549 cells with siRNA-targeting PHD2, PHD3, or a nontargeting control siRNA excluded a clonal or cell line-specific effect (Fig. 3, B and C). Whereas transient down-regulation of PHD3 in HeLa cells or transfection of the control siRNA did not affect the phosphorylation of Cof-1, down-regulation of PHD2 led to an increase of phosphorylated Cof-1 (p-Cof1). The impact of PHD2 for the phosphorylation status of Cof-1 was further supported by increased levels of p-Cof1 as determined in 1B6 and 3B7 cells (Fig. 3D). To analyze whether the effect in the stably transfected cells can be reversed by re-expression of PHD2, we generated WT-PHD2 and 3B7-PHD2 cells, which were transfected with a PHD2 expression plasmid. As a control, WT and 3B7 cells were additionally transfected with a GFP expression plasmid (WT-GFP and 3B7-GFP). Re-establishment of PHD2 protein levels reversed the increased phosphorylation levels of Cof-1 in 3B7-PHD2 cells, whereas overexpression of GFP did not affect p-Cof1 levels (Fig. 3E). To analyze whether re-establishment of PHD2 protein levels also reversed the F-actin assembly Hela cells, WT-PHD2, 3B7, and 3B7-PHD2 cells were stained with fluorescent phalloidin. Whereas 3B7 cells demonstrated increased F-actin formation compared with WT or WT-PHD2 cells, this phenotype was reversed in 3B7-PHD2 cells (Fig. 4A). A similar result was obtained analyzing the amount of F-actin and G-actin by high speed centrifugation and subsequent immunoblot analysis (Fig. 4B).
FIGURE 3.
Cof-1 is phosphorylated as a consequence of a PHD2 knockdown. A, Tet-treated and -untreated 2.1.1-16 and HeLa T-Rex cells were lysed. Protein extracts were analyzed by immunoblots. A549 (B) and HeLa (C) cells were transiently transfected with siRNAs targeting PHD2, PHD3, or a nontargeting control siRNA. 24 h later, cells were lysed. Protein extracts were analyzed by immunoblots. D, WT HeLa, shC, 1B6, and 3B7 cells were lysed, and protein extracts were analyzed by immunoblots. E, WT HeLa and 3B7 cells as well as PHD2-reconstituted (WT-PHD2 and 3B7-PHD2) or GFP-overexpressing cells (WT-GFP and 3B7-GFP) were lysed, and protein extracts were analyzed by immunoblots.
FIGURE 4.
F-actin assembly in PHD2 knockdown cells is reversed by reconstitution of PHD2 expression. A, WT Hela and 3B7 cells as well as their stably transfected PHD2 variants (WT-PHD2 and 3B7-PHD2) were grown on coverslips. Subsequently, cells were fixed, and F-actin organization was analyzed by phalloidin staining. B, F-actin (pellet, p) and G-actin (supernatant, s) content was determined in WT Hela and 3B7 cells as well as their transfected PHD2 variants (WT-PHD2 and 3B7-PHD2).
RhoA/ROCK Activity Is Responsible for Cof-1 Phosphorylation and F-actin Rearrangement in PHD2 Knockdown Cells
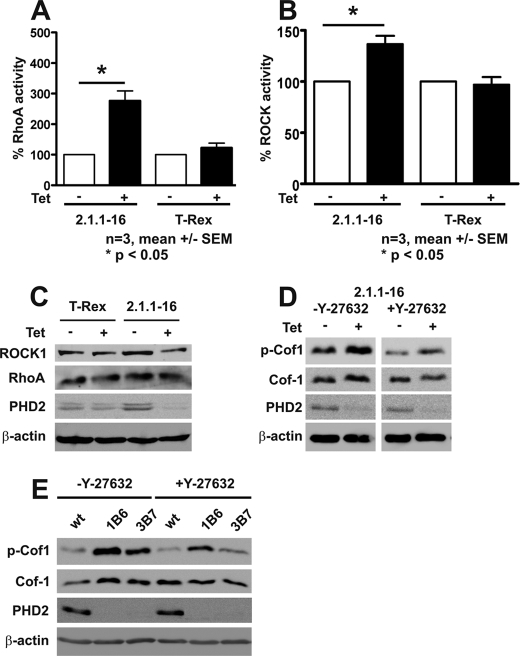
To analyze whether RhoA/ROCK activity is responsible for the increased levels of p-Cof1, we determined active GTP-bound RhoA levels in Tet-induced 2.1.1-16 and Hela T-Rex cells. RhoA activity was significantly increased in Tet-treated 2.1.1-16 cells, whereas Tet treatment in HeLa T-Rex cells did not affect GTP-bound RhoA levels (Fig. 5A). RhoA, in its active form, increases ROCK activity. ROCK activity was significantly increased in Tet-induced 2.1.1-16 cells (Fig. 5B). The increased RhoA and ROCK activities were not due to increased protein levels (Fig. 5C). The involvement of RhoA/ROCK activity was further substantiated by the fact that treatment of Tet-induced 2.1.1-16 cells with the ROCK inhibitor Y-27632 abrogated increased phosphorylation of Cof-1 (Fig. 5D). A similar effect was observed in the PHD2 knockdown cells 1B6 and 3B7 (Fig. 5E).
FIGURE 5.
Increased RhoA and ROCK activity in PHD2 knockdown cells. RhoA (A) and ROCK (B) activity and protein expression (C) were determined in Tet-treated and -untreated 2.1.1-16 and HeLa T-Rex cells. D, Tet-treated and -untreated 2.1.1-16 cells were incubated with 10 μm Y-27632 for 90 min. Subsequently, cells were lysed, and protein extracts were analyzed by immunoblots. E, WT HeLa, 1B6, and 3B7 cells were incubated with 10 μm Y27632 for 90 min. Subsequently, cells were lysed, and protein extracts were analyzed by immunoblots.
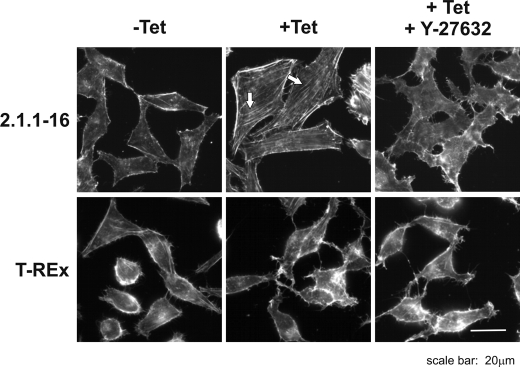
Additionally, we performed phalloidin staining in the Tet-inducible 2.1.1-16 PHD2 knockdown cells, in which ROCK activity was blocked by addition of Y-27632. Y-27632 treatment significantly diminished actin filaments in Tet-treated 2.1.1-16 cells indicating the involvement of RhoA/ROCK-dependent cofilin phosphorylation (Fig. 6).
FIGURE 6.
Inhibiting ROCK activity reverses F-actin fiber formation in PHD2 knockdown cells. Tet-treated and -untreated 2.1.1-16 and HeLa T-Rex cells were incubated with 10 μm Y-27632 for 30 min. Subsequently, cells were fixed, and F-actin fiber formation was analyzed by phalloidin staining.
Phosphorylation of Cofilin Depends on PHD2 Hydroxylation Activity
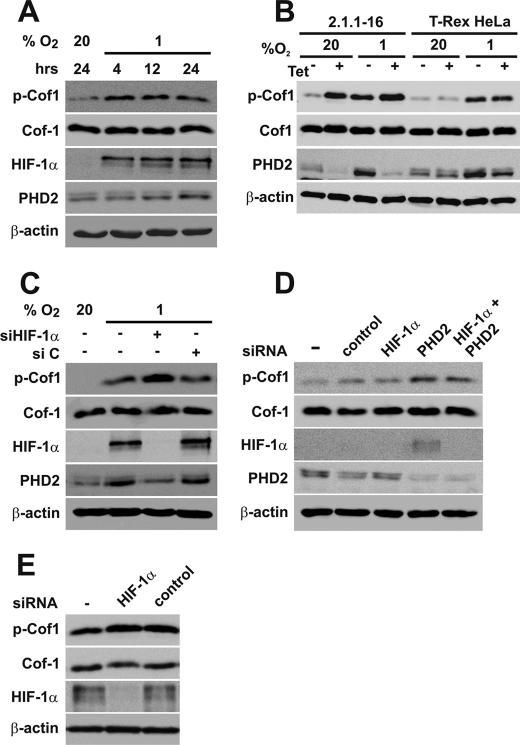
RhoA has been shown to be induced by hypoxia in mouse embryonic fibroblasts (34) and in renal cancer cells (35) previously. Exposing HeLa cells to hypoxia resulted in increased p-Cof1 levels in our study (Fig. 7A), which is in line with the above mentioned reports. p-Cof1 levels were also increased in the 2.1.1–16 PHD2 knockdown cells exposed to hypoxia (Fig. 7B). Thus, it is possible that hypoxia may induce phosphorylation of Cof-1 independently of PHD2 via an unrelated mechanism. This was further substantiated by the fact that hindering HIF-1α accumulation in hypoxia or in PHD2 knockdown cells in normoxia had distinct effects. Whereas p-Cof1 levels were further increased in hypoxia after transient transfection of HIF-1α siRNAs (Fig. 7C), p-Cof1 levels were not affected after transient transfection of siRNA targeting HIF-1α combined with siRNA targeting PHD2 or transient transfection of siRNA targeting HIF-1α in the stably transfected HeLa PHD2 knockdown cells (Fig. 7, D and E) under normoxic conditions. The successful knockdown of HIF-1α after transfection of HIF-1α siRNA was verified by HIF-1α immunoblots as well as by diminished expression of PHD2, which is hypoxia-inducible by HIF-1 itself (36).
FIGURE 7.
Cofilin phosphorylation in hypoxia. A, HeLa cells were incubated at 20% O2 or 1% O2 for the indicated times. Subsequently, cells were lysed, and protein extracts were analyzed by immunoblots. B, Tet-treated and -untreated 2.1.1-16 and HeLa T-Rex cells were incubated at 20% O2 or 1% O2 for 24 h. Subsequently, cells were lysed, and protein extracts were analyzed by immunoblots. C, HeLa cells were transfected with nontargeting control siRNA (si C) or siRNA-targeting HIF-1α (si HIF-1α) and incubated at 20% O2 or 1% O2 for 24 h. Subsequently, cells were lysed, and protein extracts were analyzed by immunoblots. D, HeLa cells were transfected with siRNAs targeting PHD2 or HIF-1α and incubated at 20% O2 for 24 h. Subsequently, cells were lysed, and protein extracts were analyzed by immunoblots. E, 3B7 cells were transfected with siRNAs targeting HIF-1α and incubated at 20% O2 for 24 h. Subsequently, cells were lysed, and protein extracts were analyzed by immunoblots.
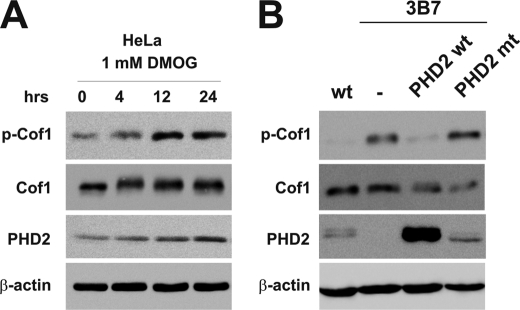
To gain further insight into the interrelation of PHD2 activity and Cof-1 phosphorylation, we treated HeLa cells with the oxoglutarate analog DMOG, which inhibits PHD activity. In DMOG-treated cells, we detected increased phosphorylation of Cof-1 indicating that phosphorylation of Cof-1 depends on PHD activity (Fig. 8A). To more directly analyze the requirement of PHD2 hydroxylation activity, we restored PHD2 levels in the PHD2-silenced 3B7 cells by transfecting either wild type or an enzymatically inactive PHD2. The wild type PHD2 reversed the increased p-Cof1 levels in 3B7 cells, whereas the mutant PHD2 had no similar effect (Fig. 8B).
FIGURE 8.
Cofilin phosphorylation and PHD activity. A, HeLa cells were treated with 1 mm DMOG as indicated. Subsequently, cells were lysed, and protein extracts were analyzed by immunoblots. B, HeLa WT, 3B7 cells, and 3B7 cells, which were stably transfected with PHD2 WT or PHD2 mt were lysed, and protein extracts were analyzed by immunoblots.
DISCUSSION
Analysis of inducibly and stably transfected PHD2 knockdown cells revealed major differences in cell motility in comparison with wild type cells. The behavioral differences correlated with changes in F-actin organization and activation of the RhoA/ROCK/Cof-1 pathway. Cof-1 is a key regulator of cell motility by inducing F-actin depolymerization and severing (37). Phosphorylation of Cof-1 at serine 3 leads to loss of actin binding and severing activities and subsequently results in decreased cell motility (33). Actin remodeling and its impact on cell migration have an essential function in a variety of cellular processes such as cell movement, cell adhesion, and cytokinesis (38). Our data thus demonstrate a functional link between two major cellular functions, i.e. oxygen sensing and cell migration via actin reorganization.
The Rho GTPase family includes several members from which RhoA, Rac1, and Cdc42 are the best characterized. Each of these proteins is active when bound to GTP at the membrane (39). RhoA plays a critical role in cell motility and has been shown to be induced by hypoxia in mouse embryonic fibroblasts (34) and in renal cancer cells (35) previously. Turcotte et al. (35) have speculated that intracellular ATP depletion may be involved in hypoxia-induced RhoA activation. The described hypoxia-induced activation of RhoA is in line with our findings of increased p-Cof1 levels in hypoxia. Moreover, the elevated p-Cof1 levels of HIF-1α siRNA-treated HeLa cells in hypoxia may point to an essential role of HIF-1α for regulating Cof-1 under reduced oxygen conditions. This may include effects of HIF-1 on ATP levels because HIF-1 affects the metabolic adaptation in hypoxia (40). Our findings of increased RhoA activation and Cof-1 phosphorylation in PHD2 knockdown cells in normoxia, however, may indicate an additional link between the oxygen-sensing system and Cof-1 regulation. Although we cannot rule out that chronic HIF inactivation would alter the PHD2-mediated p-Cof1 levels, short term inhibition of HIF-1α accumulation did not affect the increased levels of p-Cof1 in PHD2 knockdown cells in normoxia. In this regard, it is important to note that a recent report by Chan et al. (23) demonstrates that loss of PHD2 can induce HIF-independent effects.
Inhibiting PHD2 activity with the oxoglutarate analog DMOG in normoxia resulted in a similar effect compared with PHD2 knockdown cells regarding p-Cof1 levels. Involvement of PHD2 activity was further substantiated by reconstitution of WT PHD2 or a mutant enzymatic inactive form. Although our data indicate that PHD2 activity is necessary for affecting p-Cof1 levels, the precise mechanism still remains to be determined. Thoms and Murphy (41) have recently shown that PHD2 influences extracellular matrix synthesis in chondrocytes. Because the extracellular matrix affects RhoA/ROCK activity, this might be a link between PHD2 and the p-Cof1 levels.
Several previous studies have indicated an impact of the oxygen concentration on cell migration, especially in the context of tumor cell metastasis (42, 43). The molecular link and the signaling pathways involved, however, are not completely understood. Successful metastasis relies on detachment of the cell, migration, invasion, and reattachment at the metastatic site (44). PHD2-modulated cell migration as demonstrated in the presented study might at least partially affect tumor metastasis. In SCID mouse models, it was recently shown that PHD2 knockdown tumor cells form bigger tumors compared with their wild type control cells at implantation sites (23). This is mainly due to an increased angiogenesis. The impact of PHD2 for tumor metastasis, however, is not known at this time. RhoA and Cof-1 are critically involved in tumor metastasis (45, 46). Thus, to gain a complete picture of PHD2 for tumor progression, we will focus on this connection in follow-up studies.
Studies with small molecule inhibitors of the PHD enzymes have shown promising effects regarding treatment of anemia or ischemic diseases (47, 48). As development of clinically applicable PHD inhibitors is ongoing, there is a growing need to analyze the consequences of down-regulating PHD function (49). In this regard, our data indicate that PHD2 function is linked to cytoskeletal organization in tumor cells.
This work was supported by grants from the Deutsche Forschungsgemeinschaft (Ka1269/9-1) and the Wilhelm Sander Stiftung (Project 2008.062.1) (to D. M. K.). This work was performed as collaborative project within the COST Action TD0901 “HypoxiaNet.”
- HIF-1
- hypoxia-inducible factor-1
- DMOG
- dimethyl oxaloyl glycine
- F-actin
- filamentous actin
- PIPES
- 1,4-piperazinediethanesulfonic acid
- G-actin
- globular actin
- CHAPS
- 3-[(3-cholamidopropyl)dimethylammonio]-1-propanesulfonic acid
- PHD
- prolyl-4-hydroxylase domain enzyme
- ROCK
- Rho-associated kinase
- Tet
- tetracycline
- Cof-1
- cofilin-1.
REFERENCES
- 1.Wenger R. H. (2002) FASEB J. 16, 1151–1162 [DOI] [PubMed] [Google Scholar]
- 2.Kaelin W. G., Jr., Ratcliffe P. J. (2008) Mol. Cell 30, 393–402 [DOI] [PubMed] [Google Scholar]
- 3.Yu F., White S. B., Zhao Q., Lee F. S. (2001) Proc. Natl. Acad. Sci. U.S.A. 98, 9630–9635 [DOI] [PMC free article] [PubMed] [Google Scholar]
- 4.Ivan M., Kondo K., Yang H., Kim W., Valiando J., Ohh M., Salic A., Asara J. M., Lane W. S., Kaelin W. G., Jr. (2001) Science 292, 464–468 [DOI] [PubMed] [Google Scholar]
- 5.Jaakkola P., Mole D. R., Tian Y. M., Wilson M. I., Gielbert J., Gaskell S. J., Kriegsheim Av, Hebestreit H. F., Mukherji M., Schofield C. J., Maxwell P. H., Pugh C. W., Ratcliffe P. J. (2001) Science 292, 468–472 [DOI] [PubMed] [Google Scholar]
- 6.Bruick R. K., McKnight S. L. (2001) Science 294, 1337–1340 [DOI] [PubMed] [Google Scholar]
- 7.Epstein A. C., Gleadle J. M., McNeill L. A., Hewitson K. S., O'Rourke J., Mole D. R., Mukherji M., Metzen E., Wilson M. I., Dhanda A., Tian Y. M., Masson N., Hamilton D. L., Jaakkola P., Barstead R., Hodgkin J., Maxwell P. H., Pugh C. W., Schofield C. J., Ratcliffe P. J. (2001) Cell 107, 43–54 [DOI] [PubMed] [Google Scholar]
- 8.Ivan M., Haberberger T., Gervasi D. C., Michelson K. S., Günzler V., Kondo K., Yang H., Sorokina I., Conaway R. C., Conaway J. W., Kaelin W. G., Jr. (2002) Proc. Natl. Acad. Sci. U.S.A. 99, 13459–13464 [DOI] [PMC free article] [PubMed] [Google Scholar]
- 9.Hewitson K. S., McNeill L. A., Elkins J. M., Schofield C. J. (2003) Biochem. Soc. Trans. 31, 510–515 [DOI] [PubMed] [Google Scholar]
- 10.Takeda K., Ho V. C., Takeda H., Duan L. J., Nagy A., Fong G. H. (2006) Mol. Cell. Biol. 26, 8336–8346 [DOI] [PMC free article] [PubMed] [Google Scholar]
- 11.Bishop T., Gallagher D., Pascual A., Lygate C. A., de Bono J. P., Nicholls L. G., Ortega-Saenz P., Oster H., Wijeyekoon B., Sutherland A. I., Grosfeld A., Aragones J., Schneider M., van Geyte K., Teixeira D., Diez-Juan A., Lopez-Barneo J., Channon K. M., Maxwell P. H., Pugh C. W., Davies A. M., Carmeliet P., Ratcliffe P. J. (2008) Mol. Cell. Biol. 28, 3386–3400 [DOI] [PMC free article] [PubMed] [Google Scholar]
- 12.Aragonés J., Schneider M., Van Geyte K., Fraisl P., Dresselaers T., Mazzone M., Dirkx R., Zacchigna S., Lemieux H., Jeoung N. H., Lambrechts D., Bishop T., Lafuste P., Diez-Juan A., Harten S. K., Van Noten P., De Bock K., Willam C., Tjwa M., Grosfeld A., Navet R., Moons L., Vandendriessche T., Deroose C., Wijeyekoon B., Nuyts J., Jordan B., Silasi-Mansat R., Lupu F., Dewerchin M., Pugh C., Salmon P., Mortelmans L., Gallez B., Gorus F., Buyse J., Sluse F., Harris R. A., Gnaiger E., Hespel P., Van Hecke P., Schuit F., Van Veldhoven P., Ratcliffe P., Baes M., Maxwell P., Carmeliet P. (2008) Nat. Genet. 40, 170–180 [DOI] [PubMed] [Google Scholar]
- 13.Lieb M. E., Menzies K., Moschella M. C., Ni R., Taubman M. B. (2002) Biochem. Cell Biol. 80, 421–426 [DOI] [PubMed] [Google Scholar]
- 14.Cioffi C. L., Liu X. Q., Kosinski P. A., Garay M., Bowen B. R. (2003) Biochem. Biophys. Res. Commun. 303, 947–953 [DOI] [PubMed] [Google Scholar]
- 15.Menzies K., Liu B., Kim W. J., Moschella M. C., Taubman M. B. (2004) Biochem. Biophys. Res. Commun. 317, 801–810 [DOI] [PubMed] [Google Scholar]
- 16.Appelhoff R. J., Tian Y. M., Raval R. R., Turley H., Harris A. L., Pugh C. W., Ratcliffe P. J., Gleadle J. M. (2004) J. Biol. Chem. 279, 38458–38465 [DOI] [PubMed] [Google Scholar]
- 17.Stiehl D. P., Wirthner R., Köditz J., Spielmann P., Camenisch G., Wenger R. H. (2006) J. Biol. Chem. 281, 23482–23491 [DOI] [PubMed] [Google Scholar]
- 18.Köditz J., Nesper J., Wottawa M., Stiehl D. P., Camenisch G., Franke C., Myllyharju J., Wenger R. H., Katschinski D. M. (2007) Blood 110, 3610–3617 [DOI] [PubMed] [Google Scholar]
- 19.Cummins E. P., Berra E., Comerford K. M., Ginouves A., Fitzgerald K. T., Seeballuck F., Godson C., Nielsen J. E., Moynagh P., Pouyssegur J., Taylor C. T. (2006) Proc. Natl. Acad. Sci. U.S.A. 103, 18154–18159 [DOI] [PMC free article] [PubMed] [Google Scholar]
- 20.Mikhaylova O., Ignacak M. L., Barankiewicz T. J., Harbaugh S. V., Yi Y., Maxwell P. H., Schneider M., Van Geyte K., Carmeliet P., Revelo M. P., Wyder M., Greis K. D., Meller J., Czyzyk-Krzeska M. F. (2008) Mol. Cell. Biol. 28, 2701–2717 [DOI] [PMC free article] [PubMed] [Google Scholar]
- 21.Haffey W. D., Mikhaylova O., Meller J., Yi Y., Greis K. D., Czyzyk-Krzeska M. F. (2009) Adv. Enzyme Regul. 49, 121–132 [DOI] [PMC free article] [PubMed] [Google Scholar]
- 22.Brökers N., Le-Huu S., Vogel S., Hagos Y., Katschinski D. M., Kleinschmidt M. (2010) Cancer Sci. 101, 129–136 [DOI] [PMC free article] [PubMed] [Google Scholar]
- 23.Chan D. A., Kawahara T. L., Sutphin P. D., Chang H. Y., Chi J. T., Giaccia A. J. (2009) Cancer Cell 15, 527–538 [DOI] [PMC free article] [PubMed] [Google Scholar]
- 24.Winder S. J. (2003) Curr. Opin. Cell Biol. 15, 14–22 [DOI] [PubMed] [Google Scholar]
- 25.Small J., Rottner K., Hahne P., Anderson K. I. (1999) Microsc. Res. Tech. 47, 3–17 [DOI] [PubMed] [Google Scholar]
- 26.Small J. V., Rottner K., Kaverina I., Anderson K. I. (1998) Biochim. Biophys. Acta 1404, 271–281 [DOI] [PubMed] [Google Scholar]
- 27.Olson M. F., Sahai E. (2009) Clin. Exp. Metastasis 26, 273–287 [DOI] [PubMed] [Google Scholar]
- 28.Ridley A. J., Hall A. (1992) Cell 70, 389–399 [DOI] [PubMed] [Google Scholar]
- 29.Ohashi K., Nagata K., Maekawa M., Ishizaki T., Narumiya S., Mizuno K. (2000) J. Biol. Chem. 275, 3577–3582 [DOI] [PubMed] [Google Scholar]
- 30.Arber S., Barbayannis F. A., Hanser H., Schneider C., Stanyon C. A., Bernard O., Caroni P. (1998) Nature 393, 805–809 [DOI] [PubMed] [Google Scholar]
- 31.Yang N., Higuchi O., Ohashi K., Nagata K., Wada A., Kangawa K., Nishida E., Mizuno K. (1998) Nature 393, 809–812 [DOI] [PubMed] [Google Scholar]
- 32.Bailly M., Jones G. E. (2003) Curr. Biol. 13, R128–130 [DOI] [PubMed] [Google Scholar]
- 33.Van Troys M., Huyck L., Leyman S., Dhaese S., Vandekerkhove J., Ampe C. (2008) Eur. J. Cell Biol. 87, 649–667 [DOI] [PubMed] [Google Scholar]
- 34.Greijer A. E., van der Groep P., Kemming D., Shvarts A., Semenza G. L., Meijer G. A., van de Wiel M. A., Belien J. A., van Diest P. J., van der Wall E. (2005) J. Pathol. 206, 291–304 [DOI] [PubMed] [Google Scholar]
- 35.Turcotte S., Desrosiers R. R., Béliveau R. (2003) J. Cell Sci. 116, 2247–2260 [DOI] [PubMed] [Google Scholar]
- 36.Metzen E., Stiehl D. P., Doege K., Marxsen J. H., Hellwig-Bürgel T., Jelkmann W. (2005) Biochem. J. 387, 711–717 [DOI] [PMC free article] [PubMed] [Google Scholar]
- 37.Bernstein B. W., Bamburg J. R. (2010) Trends Cell Biol. 20, 187–195 [DOI] [PMC free article] [PubMed] [Google Scholar]
- 38.Bugyi B., Carlier M. F. (2010) Annu. Rev. Biophys. 39, 449–470 [DOI] [PubMed] [Google Scholar]
- 39.Matozaki T., Nakanishi H., Takai Y. (2000) Cell. Signal. 12, 515–524 [DOI] [PubMed] [Google Scholar]
- 40.Seagroves T. N., Ryan H. E., Lu H., Wouters B. G., Knapp M., Thibault P., Laderoute K., Johnson R. S. (2001) Mol. Cell. Biol. 21, 3436–3444 [DOI] [PMC free article] [PubMed] [Google Scholar]
- 41.Thoms B. L., Murphy C. L.J. Biol. Chem. 285, 20472–20480 [DOI] [PMC free article] [PubMed] [Google Scholar]
- 42.Chan D. A., Giaccia A. J. (2007) Cancer Metastasis Rev. 26, 333–339 [DOI] [PubMed] [Google Scholar]
- 43.Ruan K., Song G., Ouyang G. (2009) J. Cell. Biochem. 107, 1053–1062 [DOI] [PubMed] [Google Scholar]
- 44.Thiery J. P., Acloque H., Huang R. Y., Nieto M. A. (2009) Cell 139, 871–890 [DOI] [PubMed] [Google Scholar]
- 45.Wang W., Eddy R., Condeelis J. (2007) Nat. Rev. Cancer 7, 429–440 [DOI] [PMC free article] [PubMed] [Google Scholar]
- 46.Karlsson R., Pedersen E. D., Wang Z., Brakebusch C. (2009) Biochim. Biophys. Acta 1796, 91–98 [DOI] [PubMed] [Google Scholar]
- 47.Myllyharju J. (2008) Ann. Med. 40, 402–417 [DOI] [PubMed] [Google Scholar]
- 48.Katschinski D. M. (2009) Acta Physiologica 195, 407–414 [DOI] [PubMed] [Google Scholar]
- 49.Myllyharju J. (2009) Curr. Pharm. Des. 15, 3878–3885 [DOI] [PubMed] [Google Scholar]


