Abstract
Calmodulin (CaM) is a ubiquitous Ca2+ sensor protein that plays a pivotal role in regulating innumerable neuronal functions, including synaptic transmission. In cortical neurons, most neurotransmitter release is triggered by Ca2+ binding to synaptotagmin-1; however, a second delayed phase of release, referred to as asynchronous release, is triggered by Ca2+ binding to an unidentified secondary Ca2+ sensor. To test whether CaM could be the enigmatic Ca2+ sensor for asynchronous release, we now use in cultured neurons short hairpin RNAs that suppress expression of ∼70% of all neuronal CaM isoforms. Surprisingly, we found that in synaptotagmin-1 knock-out neurons, the CaM knockdown caused a paradoxical rescue of synchronous release, instead of a block of asynchronous release. Gene and protein expression studies revealed that both in wild-type and in synaptotagmin-1 knock-out neurons, the CaM knockdown altered expression of >200 genes, including that encoding synaptotagmin-2. Synaptotagmin-2 expression was increased several-fold by the CaM knockdown, which accounted for the paradoxical rescue of synchronous release in synaptotagmin-1 knock-out neurons by the CaM knockdown. Interestingly, the CaM knockdown primarily activated genes that are preferentially expressed in caudal brain regions, whereas it repressed genes in rostral brain regions. Consistent with this correlation, quantifications of protein levels in adult mice uncovered an inverse relationship of CaM and synaptotagmin-2 levels in mouse forebrain, brain stem, and spinal cord. Finally, we employed molecular replacement experiments using a knockdown rescue approach to show that Ca2+ binding to the C-lobe but not the N-lobe of CaM is required for suppression of synaptotagmin-2 expression in cortical neurons. Our data describe a previously unknown, Ca2+/CaM-dependent regulatory pathway that controls the expression of synaptic proteins in the rostral-caudal neuraxis.
Keywords: Calcium, Calmodulin, Calcium Calmodulin-dependent Protein Kinase (CaMK), Cell Adhesion, Exocytosis, Neurobiology, Neuroscience, Synapses
Introduction
Neurotransmitter release is mediated by two separate, competing pathways: synchronous and asynchronous releases. Both modes of synaptic vesicle exocytosis are triggered by Ca2+. The synchronous release mode exhibits an apparent Ca2+ cooperativity of ∼5 (1–3), and the asynchronous release shows an apparent Ca2+ cooperativity of ∼2 (3). The role of synaptotagmins as primary Ca2+ sensors for synchronous neurotransmitter release is well established (4–11). However, the molecular identity of the Ca2+ sensor that mediates asynchronous release remains unknown.
Calmodulin (CaM)4 is a ubiquitous and essential Ca2+-binding protein that regulates a plethora of cellular processes, from gene transcription to signal transduction to ion channels to membrane traffic (12–14). CaM is highly conserved in vertebrates and is ubiquitously expressed. All CaM proteins are composed of two lobes (i.e. the N- and C-lobes) that each contain two E-F hand Ca2+-binding motifs and are connected via a flexible α-helix (15). Each E-F hand motif binds to one Ca2+ ion. Ca2+ binds to the N- and C-lobes in a cooperative manner, with the N-lobe binding Ca2+ with a lower affinity but faster association and dissociation rates than the C-lobe (16, 17). The different Ca2+ binding characteristics probably confer onto CaM lobes specific target protein binding properties and functions (18, 19). Apart from numerous cytoplasmic regulatory functions, Ca2+ binding to CaM serves to activate transcription by a number of distinct signaling pathways (14, 20).
CaM regulates neurotransmitter release by multiple mechanisms, including binding to Munc13, regulating Ca2+ channels, and activating Ca2+/CaM-dependent kinase II (CaMKII) (12–14, 20–24). In addition, CaM was proposed to directly function as a Ca2+ sensor for Ca2+-triggered exocytosis (25, 26), prompting us to test here whether CaM may act as the Ca2+ sensor for asynchronous release. For this purpose, we cultured cortical neurons from synaptotagmin-1 (Syt1) knock-out (KO) mice in which synchronous release is abolished and only asynchronous release remains (5, 6). We then analyzed the effects of shRNA-mediated knockdown (KD) of all CaM isoforms on neurotransmitter release, using a previously established lentiviral system that suppresses ∼70% of neuronal CaM expression (24). We found that although KD of CaM had no significant effect on asynchronous release, it surprisingly rescued the loss of synchronous release in Syt1 KO neurons. An unbiased genome-wide gene expression profiling experiment revealed that the CaM KD induced a dramatic up-regulation of expression of Syt2 and synaptobrevin-1 (Syb1), which are normally expressed in the forebrain at low levels but are abundant in caudal brain regions (27–29). In addition, the expression of other caudal synaptic genes was increased, whereas expression of rostral synaptic genes was decreased. Moreover, using molecular replacement experiments, we show that the regulation of Syt2 expression by CaM requires Ca2+ binding to only the C-lobe but not the N-lobe of CaM. Thus, our data show that Ca2+ binding to CaM regulates neurotransmitter release not only in the short term by binding to target proteins (12–14, 20–24) but also on a longer time frame by modulating the expression of presynaptic proteins such as Syt2, thereby influencing the properties of neurotransmitter release at a synapse.
EXPERIMENTAL PROCEDURES
Neuronal Culture
Mouse cortical culture was made as described elsewhere (6, 24). Briefly, the primary cortical neurons were isolated from postnatal day 0 pups of Syt1 deficient or wild-type mice, dissociated by papain digestion, and plated on Matrigel-coated circle glass coverslips. The neurons were cultured in vitro for 13–16 days in minimal essential medium (Invitrogen) supplemented with B27 (Invitrogen), glucose, transferrin, fetal bovine serum, and Ara-C (Sigma).
Lentivirus Packaging and Infection of Neuronal Culture
The packaging of lentiviruses and the infection of neurons with lentiviruses were described previously (24). Briefly, the lentiviral expression vector (control vector L309 or the shRNAs carrying vectors) and three helper plasmids, the pRSV-REV, pMDLg/pRRE, and vesicular stomatitis virus G protein were co-transfected into HEK 293T cells (ATCC, Manassas, VA) at 6, 2, 2, and 2 μg of DNA/25-cm2 culture area, respectively. The transient transfections were performed with FuGENE 6 transfection reagent (Roche Applied Science) following the manufacturer's instructions. Supernatants with viruses were collected 48 h after transfection. Cortical neuronal culture was infected at 5 days in vitro (DIV) and used for biochemical or physiological analysis on 14–16 DIV. All of the steps were performed under level II biosafety conditions.
Lentiviral Vector Construction
Lentiviral vectors constructions were described previously (24). Human H1 promoter and human U6 promoter were cloned into lentiviral backbone vector FG-12 vector. Cloning sites after H1 promoter are XhoI-XbaI-HpaI; cloning sites after U6 promoter are AscI-ClaI-RsrII-PacI. Internal ribosome entry site-enhanced GFP was cloned in after ubiquitin C promoter, leaving BamHI-EcoRI sites for inserting rescue cDNAs. Short hairpin sequences for CaMs were the same as described previously (24).
Microarray Expression Assays
The cultured cortical neurons were lysed, and total RNA was extracted and purified with a RNAqueous micro kit (Ambion) following the manufacturer's instructions. Standard gene expression analyses were performed using the Affymetrix mouse gene ST_1.0 chip by the Protein and Nucleic Acid Facility at Stanford University. Array data were analyzed using the Partek genomics suite. Gene expression levels were compared with their control groups individually. Two data sets of CaM KD and CaM KD + WT CaM rescue were obtained with two batches of cultured neurons infected with control viruses; viruses with shRNAs targeting CaM 1–3; or viruses with shRNAs and expression of shRNA silent WT CaM cDNA (supplemental Table S1). Only the gene expression levels changed after CaM KD and rescued with WT CaM in both experiments are included in the list. Full gene expression array data are deposited to the NCBI Gene Expression Omnibus.
Quantification of mRNA Level by Quantitative Real Time PCR
The cultured cortical neurons were lysed, and total RNA was extracted and purified with a RNAqueous micro kit (Ambion) following the manufacturer's instructions. The mRNA level of individual genes was then analyzed by one-step quantitative real time PCR system with pre-made TaqMan® gene expression assays (Applied Biosystems). Briefly, 30 ng of RNA sample in 1 μl of volume was mixed with 10 μl of TaqMan fast universal PCR master mix (twice), 0.1 μl of reverse transcriptase (50 units/μl), 0.4 μl of RNase inhibitor (20 units/μl), 7.5 μl of H2O, and 7 μl of TaqMan® gene expression assay for the target gene (including the forward and reverse primers and the TaqMan FAM-MGB probe). The reaction mixture was loaded onto ABI7900 fast real time PCR machine for 30 min of reverse transcription at 48 °C followed by 40 PCR amplification cycles consisting of denaturation at 95 °C for 1 s and annealing and extension at 60 °C for 20 s. The amplification curve was collected and analyzed with ΔΔCt methods for relative quantification of mRNAs. The amount of mRNA of target genes, normalized to that of an endogenous control and relative to the calibrator sample, is calculated by 2−ΔΔCt. In the current study, GAPDH was used as the endogenous control, and the RNA samples derived from neurons infected with control vector (L309) were used as calibrators. The TaqMan® gene expression assays (Applied Biosystems) used in the current study included: Mm00486655_m1 (CaM 1), Mm00849529_g1 (CaM 2), Mm00482929_m1 (CaM 3), Mm00618457_m1 (Lrrtm3), Mm00436864_m1 (Syt2), and mouse GAPD (GAPDH) endogenous control. Syt9 quantitative real time PCR PrimeTime assay was designed and custom-made through Integrated DNA Technologies.
Electrophysiology
Electrophysiology was performed as described previously (6, 24, 30). Briefly, the evoked synaptic responses were triggered by a bipolar electrode (FHC, CBAEC75 Concentric Bipolar Electrode OP: 125 μm SS; IP: 25 μm Pt/lr) placed at a position 100–150 μm from the soma of neurons recorded. The patch pipettes were pulled from borsilicate glass capillary tubes (Warner Instruments; catalog number 64-0793) using PP830 or PC-10 pipette puller (Narishige). The resistance of pipettes filled with intracellular solution varied between 4 and 5 MOhm. After formation of whole cell configuration and equilibration of intracellular pipette solution, the series resistance was adjusted to 8–10 MOhm. Synaptic currents were monitored with Multiclamp 700B amplifier (Molecular Devices). The frequency, duration, and magnitude of extracellular stimulus were controlled with a model 2100 isolated pulse stimulator (A-M Systems, Inc.) synchronized with Clampex 9 data acquisition software (Molecular Devices). The whole cell pipette solution contained 135 mm CsCl, 10 mm HEPES, 1 mm EGTA, 1 mm Na-GTP, 4 mm Mg-ATP, and 10 mm QX-314 (pH 7.4, adjusted with CsOH). The bath solution contained 140 mm NaCl, 5 mm KCl, 2 mm MgCl2, 2 mm CaCl2, 10 mm HEPES, and 10 mm glucose (pH 7.4, adjusted with NaOH). Inhibitory and excitatory postsynaptic currents were pharmacologically isolated by adding AMPA and NMDA receptor blockers 6-cyano-7-nitroquinoxaline-2,3-dione (20 μm) and AP-5 (50 μm) or GABAA receptor blockers bicuculine (20 μm) or picrotoxin (50 μm) to the extracellular bath solution. Spontaneous miniature inhibitory postsynaptic currents (mIPSCs) were monitored in the presence of tetrodotoxin (1 μm) to block the action potentials.
Miscellaneous Procedures
For immunoblotting analyses from cultured neurons, at 14–15 DIV, the cultures were washed twice using PBS. The materials were directly collected by SDS protein sample buffers (50 μl of sample buffer/well for 24-well plates). Equal amounts of samples (25 μl) were analyzed by SDS-PAGE and immunoblotting using antibodies as follows: CaM monoclonal antibody (Milllipore; 05-173, 1:1,000); Syt2 (I735, 1:3,000); Syt1 (Cl41.1, 1:4,000); syntaxin 1 (U6251, 1:3,000); SNAP-25 (P913, 1:1,000); Rab3A (42.2, 1:2,000); rabphilin (I731, 1:1,000), secretory carrier membrane proteins (R806, 1:1,000); PSD95 (L667, 1:1,000); Munc18 (J371, 1:1,000); cysteine string protein (R807, 1:1,000); N-ethylmaleimide-sensitive factor (P944, 1:1,000); NL1 (4C12, 1:1,000); NL2 (169C, 1:200); GDP dissociation inhibitor (81.2, 1:2,000); synaptotbrevin-1 (P938, 1:500); β-actin (mouse monoclonal antibody clone 14; BD Transduction Labs; 1:2,000); and vasolin-containing protein (VCP; K330, 1:1,000). For protein quantitations, 125I-labeled secondary antibodies and PhosphoImager detection (Molecular Dynamics) were used. GDP dissociation inhibitor and VCP were employed as internal standards.
Data Analysis
The electrophysiological currents were sampled at 10 kHz and analyzed off-line using Clampfit 9 (Molecular Devices) software. For graphic representation of the current traces shown for evoked synaptic transmission, stimulus artifacts were removed. For measurements of frequency of spontaneous release and amplitudes of synchronous IPSCs during stimulus trains, individual mIPSCs or IPSCs were collected using pClamp template search function. Cumulative distributions of inter-event interval and amplitude of mIPSCs were compared using a Kolmogorov-Smirnov test. All of the statistical comparisons were made using Student's t test except where otherwise stated.
RESULTS
CaM KD Rescues Synchronous Release in Syt1 KO Synapses
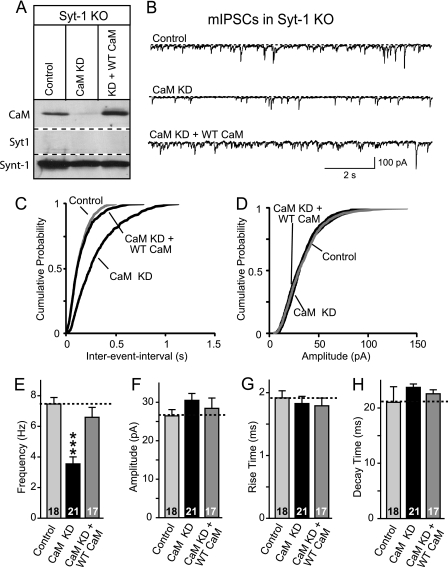
We used shRNAs targeting all CaM isoforms (24) to suppress CaM expression in cultured cortical neurons from Syt1 KO mice. Immunoblotting analysis with enhanced chemiluminescence detection suggested that the CaM KD strongly suppresses CaM expression (Fig. 1A), and quantitations of the CaM mRNA and protein levels confirmed an actual suppression of CaM expression by ∼70% (24).
FIGURE 1.
CaM knockdown reduces mini release in Syt1 KO neurons. Cultured cortical neurons from Syt1 KO mice were infected with control lentivirus or with CaM KD lentivirus expressing CaM shRNAs without or with wild-type CaM rescue mRNA (+WT CaM) (24). Neurons were cultured from newborn mice, infected at DIV 5, and analyzed at DIV 14–15. A, representative immunoblots of neurons probed with antibodies to CaM, Syt1, and syntaxin-1 (Synt-1) and visualized by enhanced chemiluminescence. B, representative traces of mIPSCs. C, cumulative distributions of the inter-event intervals of mIPSCs. The plot shows the averages of minis from five neurons. p < 0.001 for control versus CaM KD; the values for control versus CaM KD with rescue were not significant. A Kolmogorov-Smirnov test was used. D, cumulative distributions of the mIPSC amplitudes. The plot shows averages of minis from five neurons. The values for control versus CaM and control versus CaM KD with rescue were not significant. A Kolmogorov-Smirnov test was used. E, summary graphs of the mIPSC frequency. F, summary graphs of the mIPSC amplitude. G, summary graphs of the 10–90% rise time of mIPSCs. H, summary graphs of the 90% to 10% decay time of mIPSCs. The data shown are the means ± S.E.; n = number of cells indicated in the bars from three independent cultures. ***, p < 0.001 as assessed with Student's t test.
Syt1 functions not only as a Ca2+ sensor for synchronous release but also for spontaneous miniature synaptic release (“minis”); it additionally acts as a clamp for mini release (31). As a result, the Syt1 KO causes a large increase in the frequency of minis; however, the increased minis in Syt1-deficient synapses remain Ca2+-sensitive and are likely mediated by a secondary, as yet unidentified Ca2+ sensor that exhibits the same properties as the Ca2+ sensor for asynchronous release. Thus, we first tested whether the CaM KD alters the increased minis observed in the absence of Syt1. Indeed, we found that the CaM KD reduced the frequency of mini IPSCs in Syt1 KO neurons ∼40% (Fig. 1, B, C, and E). This reduction in mini release was fully rescued by expression of shRNA-resistant wild-type CaM using the same lentivirus (24), demonstrating that the mini reduction is not a result of an off-target effect of the shRNAs used for the experiment. No obvious changes have been observed in the amplitudes of mIPSCs after CaM KD (Fig. 1, D and F) and kinetics of mIPSCs (Fig. 1, G and H).
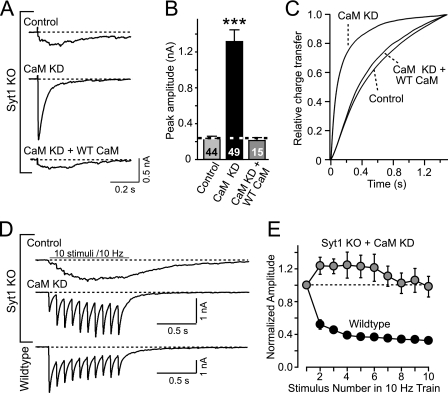
We next examined evoked asynchronous release in Syt1 KO cultured neurons with or without rescue. To our surprise, we found that instead of impairing asynchronous release, the CaM KD reversed the loss of synchronous release in Syt1 KO neurons (Fig. 2, A–C). Analysis of the kinetics of evoked responses revealed that upon CaM KD, the massively delayed release reaction in Syt1 KO synapses is accelerated to wild-type levels (Fig. 2C). Again, this CaM KD phenotype could be fully rescued by expression of wild-type CaM. Moreover, the restoration of synchronous release is also evident during trains of stimulation (Fig. 2D). However, the presence of synaptic facilitation instead of depression during the stimulus trains indicated that the release probability of CaM KD synapses was lower than that of WT synapses (Fig. 2E), consistent with our previous observation that the CaM KD decreases the presynaptic release probability by a CaMKII-dependent mechanism (24).
FIGURE 2.
CaM KD restores synchronous release in Syt1 KO neurons. Cultured cortical neurons from Syt1 KO and littermate wild-type mice were infected with control lentivirus or with CaM KD lentivirus expressing CaM shRNAs without or with wild-type CaM rescue mRNA (24). Neurons were cultured from newborn mice, infected at DIV 5, and analyzed at DIV 14–15. A, representative traces of evoked IPSCs in Syt1 KO neurons. B, summary graphs of the peak amplitudes of evoked IPSCs (means ± S.E.; numbers of neurons analyzed are shown in bars; n > 3 independent cultures; ***, p < 0.001 per Student's t test). C, time course of the synaptic IPSC charge transfer induced by isolated action potentials. The curves are the averages of n = 11 neurons in each group. D, representative traces of IPSCs evoked by 10 stimuli at 10 Hz in control or CaM KD Syt1 KO neurons and in wild-type neurons. E, normalized synchronous IPSC amplitudes during the 10 Hz stimulus train in CaM KD Syt1 KO (n = 22) and wild-type (n = 10) neurons. The data are the means ± S.E.; the numbers in the bars indicate the number of cells analyzed in at least three independent experiments; statistical significance was calculated by Student's t test (p < 0.01). Numerical data are listed in supplemental Table S2.
Gene Expression Profiling Identifies Multiple Synaptic CaM Targets
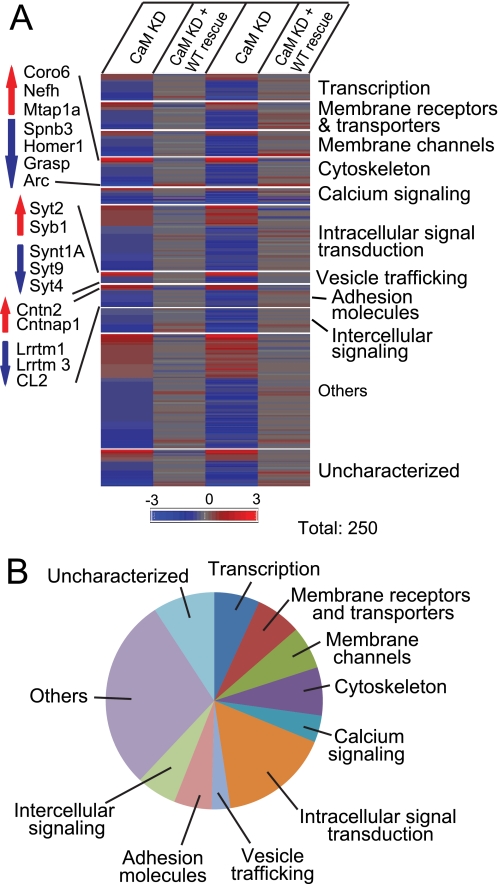
To search for a potential mechanism that accounts for the rescue of synchronous release by the CaM KD in Syt1 KO neurons, we performed an unbiased gene expression analysis in cortical neurons. To avoid artifacts induced by the Syt1 KO or by off-target effects, we used wild-type neurons and directly compared neurons that had been infected with lentiviruses expressing the CaM shRNAs either without or with a wild-type CaM rescue protein. We then analyzed the gene expression patterns in these neurons with the Affymetrix mouse gene ST_1.0 chip. We identified in two independent array studies ∼250 genes whose expression was consistently up- or down-regulated by the CaM KD, as compared with the CaM KD/rescue control (see Fig. 4; Table 1 and supplemental Table S1; deposited to the NCBI Gene Expression Omnibus.
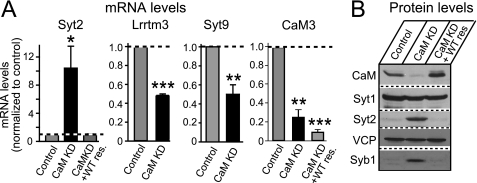
FIGURE 4.
Validation of gene expression in CaM KD by quantitative real time PCR and immunoblotting. Cultured cortical neurons from newborn wild-type mice were infected at DIV 5 with control lentivirus or with CaM KD lentivirus expressing CaM shRNAs without or with wild-type CaM rescue mRNA and analyzed at DIV 14. A, quantitative real time PCR measurements of the mRNA levels of Syt2, Lrrtm3, Syt9, and CaM3. Note that the CaM3 mRNA levels are not rescued by expression of the rescue CaM2 cDNA. B, immunoblotting analysis of Syt1, Syt2, CaM, and VCP (used as load control).
TABLE 1.
Correlation of gene expression changes induced by the CaM KD in cortical neurons with the rostral-caudal expression patterns of these genes as deduced from the Allen Brain Atlas
Array data fold changes are the averages of two independent experiments. The expression levels at different brain regions were obtained from the Allen Brain Atlas. An up arrow depicts increase; a down arrow indicates decrease; a left arrow indicates that expression levels are higher in rostral than caudal brain regions; and a right arrow indicates the opposite. The ratio of caudal/rostral gene expression was calculated from the data of the Allen Brain Atlas by dividing the numerical values listed there as follows: the average values of medulla and pons: the average values of cortex and hippocampus.
| Gene name | Description | Expression level in CaM KD (microarray) | -Fold change (CaM KD/control) | Rostral to caudal expression level (Allen Brain Atlas) | Ratio (caudal/rostral) |
|---|---|---|---|---|---|
| Syt2 | synaptotagmin 2 | ↑ | 5.64 | → | 3.04 |
| Cntn2 | contactin 2 | ↑ | 2.22 | → | 2.02 |
| Lgi3 | leucine-rich repeat LGI family, member 3 | ↑ | 2.12 | → | 1.12 |
| Coro6 | coronin, actin binding protein 6 | ↑ | 3.96 | → | 2.06 |
| Flt3 | FMS-like tyrosine kinase 3 | ↑ | 2.56 | → | 2.79 |
| Phospho1 | phosphatase, orphan 1 | ↑ | 2.15 | → | 4.11 |
| Aldh1a7 | aldehyde dehydrogenase family 1, subfamily A7 | ↑ | 1.79 | → | 2.35 |
| Tspan17 | tetraspanin 17 | ↑ | 1.71 | → | 1.44 |
| Tspan2 | tetraspanin 2 | ↑ | 1.75 | → | 1.26 |
| F3 | coagulation factor III | ↑ | 1.46 | → | 2.90 |
| Stx1a | syntaxin 1A | ↓ | 0.61 | ← | 0.30 |
| Icam5 | intercellular adhesion molecule 5 | ↓ | 0.54 | ← | 0.02 |
| Lrrtm1 | leucine-rich repeat transmembrane neuronal 1 | ↓ | 0.69 | ← | 0.05 |
| Opcml | opioid-binding protein | ↓ | 0.6 | ← | 0.37 |
| Lrrtm3 | leucine-rich repeat transmembrane neuronal 3 | ↓ | 0.62 | ← | 0.47 |
| Npas2 | Neuronal PAS domain protein 2 | ↓ | 0.65 | ← | 0.14 |
| NueroD6 | neurogenic differentiation 6 | ↓ | 0.38 | ← | 0.46 |
| Arpc5 | actin-related protein 2 | ↓ | 0.63 | ← | 0.11 |
| Mtap9 | microtubule-associated protein 9 | ↓ | 0.67 | ← | 0.54 |
| Dlg3 | discs, large homolog 3 | ↓ | 0.64 | ← | 0.25 |
| Necab1 | N-terminal EF-hand calcium binding protein 1 | ↓ | 0.61 | ← | 0.27 |
| Doc2B | double C2 domain protein B | ↓ | 0.58 | ← | 0.18 |
| Cpne5 | copine 5 | ↓ | 0.56 | ← | 0.23 |
| Sez6 | Seizure related gene 6 | ↓ | 0.63 | ← | 0.34 |
| Ypel2 | Yipppee-like 2 | ↓ | 0.6 | ← | 0.57 |
| Galnt9 | UDP-N-acetyl-a-d-galactosamine | ↓ | 0.58 | ← | 0.52 |
| Tiam2 | T-cell lymphoma invasion and metastasis 2 | ↓ | 0.62 | ← | 0.14 |
| Ctxn1 | cortexin 1 | ↓ | 0.6 | ← | 0.20 |
| Pak7 | p21 (CDKN1A)-activated kinase 7 | ↓ | 0.58 | ← | 0.07 |
| Rab40b | Rab40b, member RAS oncogene family | ↓ | 0.62 | ← | 0.30 |
| Rimbp2 | RIMS binding protein 2 | ↓ | 0.52 | ← | 0.72 |
| Tmem74 | transmembrane protein 74 | ↓ | 0.55 | ← | 0.25 |
| Lingo1 | leucine-rich repeat and Ig domain containing 1 | ↓ | 0.56 | ← | 0.22 |
| Epha6 | Eph receptor A6 | ↓ | 0.56 | ← | 0.62 |
| Ephb6 | Eph receptor B6 | ↓ | 0.69 | ← | 0.45 |
As expected, multiple classes of genes were regulated by CaM. Consistent with previous studies (32, 33), we found that activity-dependent genes, such as Homers, Npas2, Arc, and Egr3 (supplemental Table S1), were down-regulated by the CaM KD. Interestingly, we observed that several synaptic trafficking proteins were either up- or down-regulated by the CaM KD (Fig. 3 and supplemental Table S1). Among these was a large increase in the expression of Syt2, which can serve as a Ca2+ sensor for synaptic exocytosis (3, 7–9); thus, this up-regulation of Syt2 by the CaM KD likely accounts for the rescue of the Syt1 KO phenotype. In addition, expression of Syb1 was massively increased, whereas expression of Syt4, Syt9, and syntaxin-1A was decreased. Another intriguing class of proteins whose expression was strongly regulated by CaM were cell adhesion molecules, such as the synaptic cell adhesion molecules Lrrtm1, Lrrtm3, and contactin-2 (Fig. 3). Moreover, we observed up-regulation of sodium channels, and a down-regulation of potassium channels, suggesting that CaM might control the activity-dependent regulation of neuronal excitability. Finally, we detected changes in multiple genes encoding transcription factors, intracellular signal transduction proteins, elements of the cytoskeleton, or metabolic enzymes (supplemental Table S1). It should be noted, however, that despite these multifarious changes, more than 95% of genes showed no CaM KD-induced change, suggesting that the observed CaM KD-dependent expression changes are specific.
FIGURE 3.
Profiling of gene expression in control, CaM KD, or CaM KD with WT CaM rescue. Cultured cortical neurons from newborn wild-type mice were infected at DIV 5 with control lentivirus or with CaM KD lentivirus expressing CaM shRNAs without or with wild-type CaM rescue mRNA and analyzed using Affimetrix arrays at DIV 14–15. A, heat map plot of gene expression changes in CaM KD neurons without or with wild-type CaM rescue, as compared with control neurons. Only genes with CaM KD-induced changes that were rescued by wild-type CaM are shown (n = 2 independent experiments). B, functional classification of genes changed by the CaM KD and rescued by wild-type CaM.
Validation of Microarray Results by Quantitative Real Time PCR and Immunoblotting
We validated the microarray results by quantification of the mRNAs for three representative genes. Quantitative real time PCR measurements confirmed that Syt2 expression, tested because of its Ca2+ sensor function, was up-regulated ∼10-fold by the CaM KD, whereas Lrrtm3 and Syt9 expression were down-regulated ∼2-fold (Fig. 4A). In addition, because we are employing a rat CaM2 cDNA to rescue the mouse CaM KD phenotype and because the TaqMan® assays for mouse CaM3 that we employed to measure the mRNA levels do not detect the rat CaM mRNA, we were able to use quantitative real time PCR to confirm the CaM KD efficiency even under rescue conditions. CaM mRNA levels were low in CaM KD samples and remained low even under rescue conditions (Fig. 4A). Thus, our results indicate that the lentivirally mediated KD of CaM is very effective in cultured neurons.
Next, we analyzed the expression of selected proteins encoded by the mRNAs that were altered by the CaM KD. Immunoblotting confirmed that the CaM KD produced a strong induction of Syt2 and Syb1 protein, consistent with the microarray data (Fig. 4B). Syt2 and Syb1 were expressed at very low levels in control cortical cultures that only express enhanced GFP; however, in CaM KD condition we found obvious expression of both Syt2 and Syb1 (Fig. 4B). Again, the up-regulation of Syt2 and Syb1 can be reduced (rescued) by overexpression of wild-type CaM in CaM KD neurons.
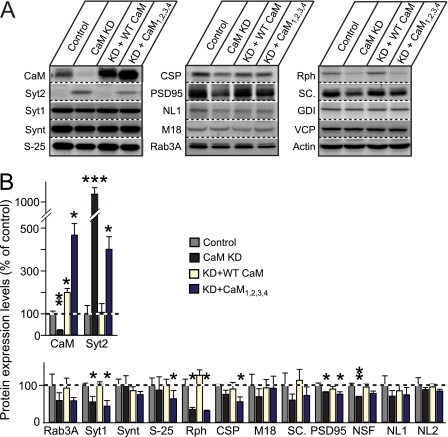
To achieve a more quantitative understanding of the changes in protein expression upon CaM KD, we measured the levels of 14 synaptic proteins in the CaM knockdown neurons using quantitative immunoblotting with 125I-labeled secondary antibodies and PhosphoImager detection. In this analysis, we not only analyzed neurons infected with control and CaM KD lentiviruses but also neurons in which the CaM KD viruses additionally produced shRNA-resistant mRNAs encoding either wild-type rat CaM or mutant rat CaM that contains mutations in all four Ca2+-binding sites (called CaM1,2,3,4). These measurements further confirmed the array data, demonstrating a large increase in Syt2 levels induced by the CaM knockdown (>10-fold), and additionally revealed changes in multiple other proteins, especially in rabphilin, whose levels decreased >60% (Fig. 5). Note that in this analysis the lack of rescue by mutant CaM1,2,3,4 that is unable to bind Ca2+ provides a further control that ensures the specificity of the results.
FIGURE 5.
Quantitation of CaM KD-induced changes in protein levels. Cultured cortical neurons from newborn wild-type mice were infected at DIV 5 with control lentivirus or with CaM KD lentivirus expressing CaM shRNAs without a CaM mRNA or with either wild-type CaM rescue mRNA (+ WT CaM) or a mutant CaM rescue mRNA (+ CaM1,2,3,4) and analyzed at DIV 14. A, representative immunoblots of neuronal proteins using primary antibody against the different proteins as indicated and 125I-conjugated secondary antibodies followed by PhosphoImager detection. B, summary graphs of protein levels measured by quantitative immunoblotting. The data shown are the means ± S.E. *, p < 0.05; **, p < 0.01 as analyzed by Student's t test (n = 3 independent cultures). Synt, syntaxin-1; S-25, SNAP-25; CSP, cysteine string protein; NL1, neuroligin-1; M18, Munc18-1; Rph, rabphilin; SC., secretory carrier membrane protein; GDI, GDP dissociation inhibitor; NL2, neuroligin-2.
CaM-regulated Gene Expression Correlates with a Rostral-Caudal Gradient
Inspection of the gene expression changes induced by CaM suggests that the genes that are up-regulated by the CaM KD, such as Syt2 and Syb1, are preferentially expressed in caudal brain regions, whereas genes that are down-regulated, such as Syt9 and Lrrtms, are primarily expressed in rostral brain regions. Indeed, quantitation of the ratio of expression of selected genes in rostral versus caudal brain regions using the Allen Brain Atlas reveals a tight correlation of the direction of the gene expression change induced by the CaM KD and the rostral-caudal expression gradient of a gene (Table 1). This suggests that although not all genes expressed in a rostral-caudal gradient are subject to CaM regulation in cultured cortical neurons, those whose expression is regulated by CaM in this system are expressed in a predictable gradient in the brain.
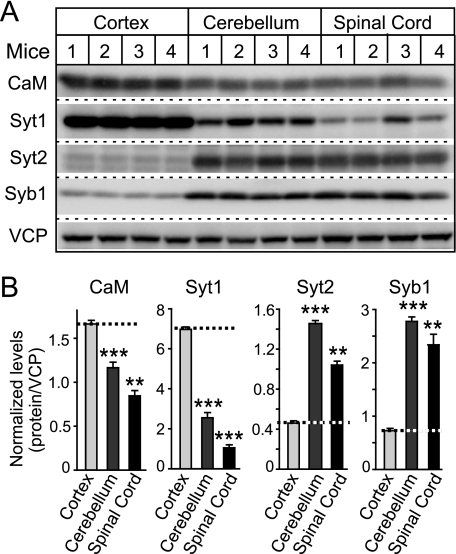
These observations led us to hypothesize that possibly CaM itself is expressed in a rostral-caudal gradient in brain and may contribute to the specification of rostral-caudal gene expression. We thus measured the levels of CaM, Syt1, Syt2, Syb1, and VCP (as a load control) in the cortex, cerebellum, and spinal cord of four adult mice by quantitative immunoblotting. Strikingly, we found that CaM was expressed in a rostral-caudal gradient, with an absolute level in spinal cord that is nearly 40% lower than in cortex (Fig. 6). Syt1 exhibited an even more pronounced rostral-caudal expression gradient, whereas Syt2 and Syb1 displayed an inverse rostral-caudal gradient (Fig. 6).
FIGURE 6.
Quantitative analysis of CaM, Syt1, Syt2, and Syb1 levels in cortex, cerebellum, and spinal cord of mice. A, representative immunoblots of mouse cortex, cerebellum/brain stem, and spinal cord homogenates using primary antibody against Syt1, Syt2, Syb1, and CaM and 125I-conjugated secondary antibodies. B, quantitation of Syt1, Syt2, Syb1, and CaM expression levels normalized to VCP in different brain regions. VCP was used as internal loading control because it is ubiquitously expressed without notable differences between cell types. The data shown are the means ± S.E. **, p < 0.01; ***, p < 0.001 as analyzed by Student's t test (n = 4 mice).
CaM Control of Syt2 Expression Is Independent of CaMKIIα
The Ca2+ dependence of the CaM-mediated suppression of Syt2 expression prompted us to ask whether Syt2 expression in cultured neurons is activity-dependent. However, inhibition of neuronal activity in cultured cortical neurons using tetrodotoxin (a Na+ channel inhibitor), AP-5 (an NMDA receptor inhibitor), or nifedipine (an L-type Ca2+ channel blocker) had no significant effect on Syt2 expression (supplemental Fig. S1). This result is consistent with the notion that the Ca2+/CaM-dependent control of Syt2 expression does not operate on a short term basis in neurons but is a developmental process.
We previously found that in presynaptic terminals, one pathway by which CaM controls synaptic strength is through the activation of CaMK II (24). Because in T lymphocytes, CaM activates CaMKIIα to inhibit IL2 gene expression (34, 35), we tested whether overexpression of a constitutively active mutant of CaMKIIα (CaMKIIαT286D) reverses the activation of Syt2 gene expression upon CaM KD. The rationale for this experiment is that the same CaMKIIα mutant rescues the decrease in synaptic strength induced by CaM KD (24), suggesting that it may represent a general pathway of CaM action. However, immunoblotting demonstrated that neither wild-type CaMKIIα nor constitutively active mutant CaMKIIαT286D reversed the increase in Syt2 expression induced by the CaM KD (supplemental Fig. S1B), indicating that the suppression of Syt2 gene expression by CaM is independent of CaMKIIα.
Ca2+ Binding to the C-lobe of CaM Sufficed to Suppress Syt2 Expression
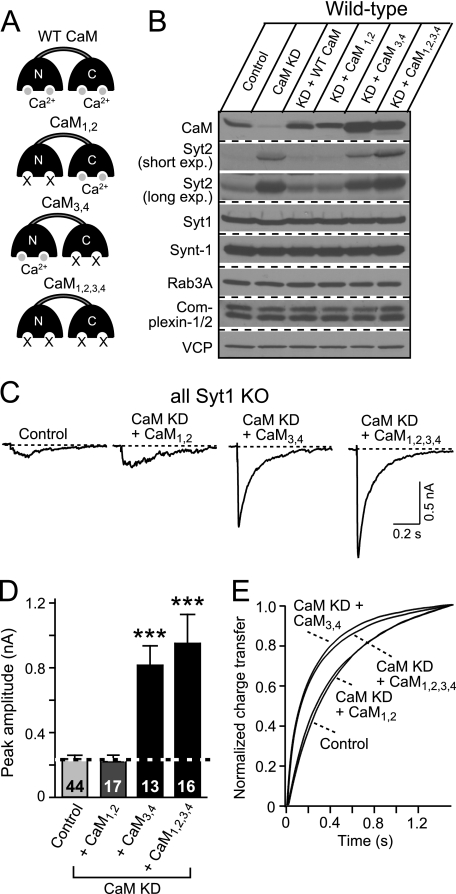
CaM suppression of Syt2 expression in cultured cortical neurons requires Ca2+ binding, because the CaM mutant in which all four Ca2+-binding sites were abolished (CaM1,2,3,4) was unable to rescue the CaM KD phenotype (Fig. 5). The two lobes of CaM, the C- and N-lobes, each contain two E-F hand Ca2+-binding sites. Because studies on CaM-regulated ion channels uncovered a differential requirement for Ca2+ binding to the N- or C-terminal lobes of CaM (36, 37), we asked whether all CaM Ca2+-binding sites are required for suppression of Syt2 expression or whether Ca2+ binding to one of the two lobes is sufficient. Strikingly, mutant CaM in which Ca2+ binding to the N-terminal lobe of CaM was blocked still fully rescued the increased Syt2 expression induced by the CaM KD, whereas mutant CaM lacking Ca2+ binding to the C-terminal lobe was inactive (Fig. 7). Thus, CaM normally suppresses Syt2 expression via Ca2+ binding to only its C-terminal lobe.
FIGURE 7.
Ca2+ binding to the C-lobe of CaM regulates Syt2 expression in cortical neurons. Cultured cortical neurons from newborn wild-type or Syt1 KO mice were infected at DIV 5 with control lentivirus, with CaM KD lentivirus expressing CaM shRNAs without a CaM rescue construct, or with either wild-type CaM (+ WT CaM) or mutant CaM in which Ca2+ binding to the N-lobe (CaM1,2), the C-lobe (CaM3,4), or both lobes of CaM (CaM1,2,3,4) is blocked. The neurons were analyzed at DIV 14–15. A, schematic structures of wild-type and mutant CaMs. B, immunoblot analysis of the indicated proteins in control and CaM KD neurons expressing various CaM constructs. Note that to better indicate the expression level of Syt2, we did two different exposure times for the immunoblots. The short exposure (short exp.) was ∼15 s, and the long exposure (long exp.) was ∼5 min. C, representative traces of IPSCs monitored in Syt1 KO neurons that were infected with the indicated lentiviruses. D, summary graphs of the peak amplitudes of evoked IPSCs. The data shown are the means ± S.E. ***, p < 0.001 as analyzed by Student's t test (n = number of neurons indicated in bars from three independent cultures. E, kinetic analysis of the IPSC time course (n = 10–17 in each group).
DISCUSSION
In this study, we tested whether Ca2+ binding to CaM triggers asynchronous neurotransmitter release, prompted by the similarities between the deduced properties of the asynchronous release Ca2+ sensor (3) and CaM (15–17) and by previous suggestions that CaM may function as a Ca2+ sensor of vesicle exocytosis (25, 26). As an approach, we used cultured cortical neurons from neonatal mice and lentivirally delivered shRNAs that efficiently suppress expression of all CaM isoforms in neurons (Fig. 1A). Our initial experiments focused on neurons from Syt1 KO in which synchronous release is deleted; thus, asynchronous release can be studied in isolation in these neurons, and changes in asynchronous release are easily detected. To our surprise, however, we found that the CaM KD did not decrease asynchronous release measurably but instead partly rescued the loss of asynchronous release in the Syt1 KO neurons (Figs. 1 and 2). Thus, CaM is not the Ca2+ sensor for asynchronous release but instead normally suppresses a pathway of synchronous release in Syt1 KO neurons that is redundant with Syt1.
In our experimental paradigm investigating cultured neurons from newborn mice, we studied not only the workings of synapses but also the maturation of neurons. In the period between the culture and lentiviral infection of the neurons and their analysis 2 weeks later, the neurons developed from immature cells to morphologically and functionally advanced neurons; at the time of plating, the neurons lacked dendrites, axons, spines, and synapses, whereas at the time of analysis, all of these had developed. Thus, we hypothesized that the CaM KD may have activated synchronous release in Syt1 KO neurons by inducing changes in gene expression. To explore this hypothesis, we performed whole genome array studies that led to the identification of a cohort of genes that were up- or down-regulated by the CaM KD (Fig. 3). Strikingly, Syt2 was among the up-regulated genes, and its activation by the CaM KD was confirmed by quantitative mRNA and protein level measurements (Figs. 4 and 5). Because Syt2 normally acts as a fast Ca2+ sensor for neurotransmitter release in hindbrain regions, such as the brain stem (3, 10), the increase in Syt2 expression upon CaM KD provides a facile explanation for the reversal of the Syt1 KO phenotype by the CaM KD. Note that in our experiments, all of the shRNA-dependent effects are controlled for by rescue experiments, an essential component given the many off-target effects of shRNAs.
The gene expression changes induced by the CaM KD were relatively restricted, affecting only ∼250 genes (Fig. 3 and supplemental Table S1). Analysis of these gene expression changes yielded several observations. First, the expression of multiple genes involved in neurotransmitter release was affected (e.g. Syb1, syntaxin-1A, and Syt9 in addition to Syt2); this suggests that the multifarious functions of CaM at the synapse, functions that go beyond simply regulating ion channels, signal transduction, and Munc13, include regulating synaptic gene expression during development. Second, apart from the expected changes in the expression of activity-dependent genes (e.g. Egr3, Npas2, Arc, and Homer) and of genes involved in intracellular signaling and the cytoskeleton, the CaM KD also specifically altered the expression of cell adhesion molecules. We found that cell adhesion molecules such as cntnap1 (contactin associate protein 1, CASPR) were up-regulated, whereas other cell adhesion molecules such as Lrrtms and latrophilins/CLs were down-regulated by the CaM KD. Lrrtms have been shown to be the endogenous ligands of neurexins and play important role in synapse formation (38–40). Our data indicate that a Ca2+-CaM paradigm might also play a role in synapse formation, although the functional consequences of these gene transcription changes remain to be further investigated. Third, the possibly most important observation was that the CaM KD-induced changes in the expression of at least a subset of genes correlates with the rostral-caudal expression pattern of these genes (Table 1). This correlation was extended to CaM itself, in that our protein quantitations show that CaM is expressed at a significantly higher level in forebrain, where expression of Syt2 and Syb1 are suppressed, than in hindbrain, where they are activated (Fig. 6). Thus, it is conceivable that CaM may contribute to the regulation of gene expression during development.
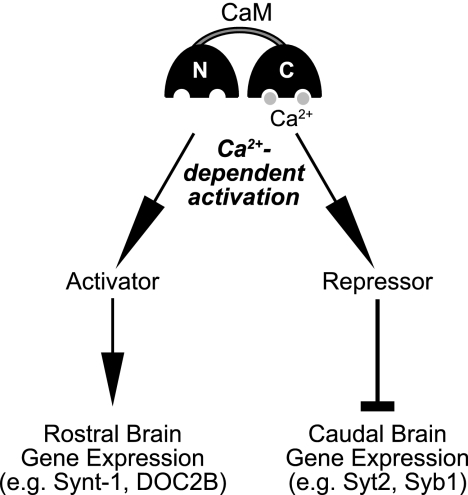
CaM presumably acts via the Ca2+-dependent activation of positive and negative transcription factors, whose identity remains unknown (Fig. 8). Our data demonstrate that Ca2+ binding to the C-lobe of CaM is both required and sufficient for its suppression of Syt2 expression (Fig. 7) and that CaM does not act via CaMKIIα (supplemental Fig. S1). One possible pathway for CaM regulating Syt2 gene expression is through RE1 silencing transcription factor (also known as the neuron-restrictive silencing factor), because two RE1 locations have been identified on Syt2 gene (41). In addition, it has been shown that HDAC4 and 5, which are CaMK-responsive repressors of hypertrophic signaling, associate with neuron-restrictive silencing factor and participate in neuron-restrictive silencing factor-mediated repression of gene in ventricular myocytes (42). However, RE1 silencing transcription factor functions as a general silencer of neuron-specific genes (43, 44), and it is highly unlikely that RE1 silencing transcription factor is normally activated by CaM in cortical neurons to suppress Syt2 and Syb1 expression.
FIGURE 8.
Model for the Ca2+/CaM-dependent regulation of gene expression. The model suggests that Ca2+ binding to the C-lobe of CaM activates a suppressor of the expression of Syt2, Syb1, and Lrrtms and of an enhancer of the expression of Syt9, syntaxin-1A, and contactin-1/contactin-associated protein 1.
In summary, our study shows that in cultured cortical neurons, Ca2+ binding to the C-lobe of CaM suppresses expression of a subset of synaptic proteins that includes Syt2 and Syb1 and activates expression of another subset of synaptic proteins that includes syntaxin-1A and Syt9. This regulation of gene expression is developmental and is related to the normal rostral-caudal expression pattern of the genes involved. Thus, CaM mediates a Ca2+-dependent regulation of synaptic transmission that goes beyond its acute role in pre- and postsynaptic compartments toward specifying the composition of synapses.
Supplementary Material
Acknowledgments
We thank Dr. John Adelman (Vollum Institute) for CaM Ca2+-binding mutant constructs and Kaishan Xian and Iryna Huryeva for excellent technical assistance.
This work was supported, in whole or in part, by a National Institutes of Mental Health Grant (to T. C. S.). This work was also supported by awards from National Alliance for Research on Schizophrenia and Depression (to Z. P. P.).

The on-line version of this article (available at http://www.jbc.org) contains supplemental Tables S1 and S2 and Fig. S1.
- CaM
- calmodulin
- CaMKII
- CaM-dependent kinase II
- Syt
- synaptotagmin
- KO
- knock-out
- Syb
- synaptobrevin
- DIV
- day(s) in vitro
- mIPSC
- miniature inhibitory postsynaptic currents
- VCP
- vasolin-containing protein.
REFERENCES
- 1.Bollmann J. H., Sakmann B., Borst J. G. (2000) Science 289, 953–957 [DOI] [PubMed] [Google Scholar]
- 2.Schneggenburger R., Neher E. (2000) Nature 406, 889–893 [DOI] [PubMed] [Google Scholar]
- 3.Sun J., Pang Z. P., Qin D., Fahim A. T., Adachi R., Südhof T. C. (2007) Nature 450, 676–682 [DOI] [PMC free article] [PubMed] [Google Scholar]
- 4.Fernández-Chacón R., Königstorfer A., Gerber S. H., García J., Matos M. F., Stevens C. F., Brose N., Rizo J., Rosenmund C., Südhof T. C. (2001) Nature 410, 41–49 [DOI] [PubMed] [Google Scholar]
- 5.Geppert M., Goda Y., Hammer R. E., Li C., Rosahl T. W., Stevens C. F., Südhof T. C. (1994) Cell 79, 717–727 [DOI] [PubMed] [Google Scholar]
- 6.Maximov A., Südhof T. C. (2005) Neuron 48, 547–554 [DOI] [PubMed] [Google Scholar]
- 7.Pang Z. P., Melicoff E., Padgett D., Liu Y., Teich A. F., Dickey B. F., Lin W., Adachi R., Südhof T. C. (2006) J. Neurosci. 26, 13493–13504 [DOI] [PMC free article] [PubMed] [Google Scholar]
- 8.Pang Z. P., Shin O. H., Meyer A. C., Rosenmund C., Südhof T. C. (2006) J. Neurosci. 26, 12556–12565 [DOI] [PMC free article] [PubMed] [Google Scholar]
- 9.Pang Z. P., Südhof T. (2010) Curr. Opin. Cell Biol. 22, 496–505 [DOI] [PMC free article] [PubMed] [Google Scholar]
- 10.Pang Z. P., Sun J., Rizo J., Maximov A., Südhof T. C. (2006) EMBO J. 25, 2039–2050 [DOI] [PMC free article] [PubMed] [Google Scholar]
- 11.Perin M. S., Fried V. A., Mignery G. A., Jahn R., Südhof T. C. (1990) Nature 345, 260–263 [DOI] [PubMed] [Google Scholar]
- 12.Clapham D. E. (2007) Cell 131, 1047–1058 [DOI] [PubMed] [Google Scholar]
- 13.Dai S., Hall D. D., Hell J. W. (2009) Physiol. Rev. 89, 411–452 [DOI] [PMC free article] [PubMed] [Google Scholar]
- 14.Greer P. L., Greenberg M. E. (2008) Neuron 59, 846–860 [DOI] [PubMed] [Google Scholar]
- 15.Babu Y. S., Sack J. S., Greenhough T. J., Bugg C. E., Means A. R., Cook W. J. (1985) Nature 315, 37–40 [DOI] [PubMed] [Google Scholar]
- 16.Bayley P., Ahlström P., Martin S. R., Forsen S. (1984) Biochem. Biophys. Res. Commun. 120, 185–191 [DOI] [PubMed] [Google Scholar]
- 17.Teleman A., Drakenberg T., Forsén S. (1986) Biochim Biophys. Acta 873, 204–213 [DOI] [PubMed] [Google Scholar]
- 18.Forest A., Swulius M. T., Tse J. K., Bradshaw J. M., Gaertner T., Waxham M. N. (2008) Biochemistry 47, 10587–10599 [DOI] [PMC free article] [PubMed] [Google Scholar]
- 19.Shifman J. M., Choi M. H., Mihalas S., Mayo S. L., Kennedy M. B. (2006) Proc. Natl. Acad. Sci. U.S.A. 103, 13968–13973 [DOI] [PMC free article] [PubMed] [Google Scholar]
- 20.Liu X., Yang P. S., Yang W., Yue D. T. (2010) Nature 463, 968–972 [DOI] [PMC free article] [PubMed] [Google Scholar]
- 21.Gifford J. L., Walsh M. P., Vogel H. J. (2007) Biochem. J. 405, 199–221 [DOI] [PubMed] [Google Scholar]
- 22.Junge H. J., Rhee J. S., Jahn O., Varoqueaux F., Spiess J., Waxham M. N., Rosenmund C., Brose N. (2004) Cell 118, 389–401 [DOI] [PubMed] [Google Scholar]
- 23.Lee A., Wong S. T., Gallagher D., Li B., Storm D. R., Scheuer T., Catterall W. A. (1999) Nature 399, 155–159 [DOI] [PubMed] [Google Scholar]
- 24.Pang Z. P., Cao P., Xu W., Südhof T. C. (2010) J. Neurosci. 30, 4132–4142 [DOI] [PMC free article] [PubMed] [Google Scholar]
- 25.DeLorenzo R. J. (1981) Cell Calcium 2, 365–385 [DOI] [PubMed] [Google Scholar]
- 26.Steinhardt R. A., Alderton J. M. (1982) Nature 295, 154–155 [DOI] [PubMed] [Google Scholar]
- 27.Berton F., Iborra C., Boudier J. A., Seagar M. J., Marquèze B. (1997) J. Neurosci. 17, 1206–1216 [DOI] [PMC free article] [PubMed] [Google Scholar]
- 28.Ullrich B., Südhof T. C. (1995) Neuropharmacology 34, 1371–1377 [DOI] [PubMed] [Google Scholar]
- 29.Ullrich B., Li C., Zhang J. Z., McMahon H., Anderson R. G., Geppert M., Südhof T. C. (1994) Neuron 13, 1281–1291 [DOI] [PubMed] [Google Scholar]
- 30.Maximov A., Pang Z. P., Tervo D. G., Südhof T. C. (2007) J. Neurosci. Methods 161, 75–87 [DOI] [PubMed] [Google Scholar]
- 31.Xu J., Pang Z. P., Shin O. H., Südhof T. C. (2009) Nat. Neurosci. 12, 759–766 [DOI] [PMC free article] [PubMed] [Google Scholar]
- 32.Greenberg M. E., Thompson M. A., Sheng M. (1992) J. Physiol. Paris 86, 99–108 [DOI] [PubMed] [Google Scholar]
- 33.Sheng M., Thompson M. A., Greenberg M. E. (1991) Science 252, 1427–1430 [DOI] [PubMed] [Google Scholar]
- 34.Liu J. O. (2009) Immunol. Rev. 228, 184–198 [DOI] [PMC free article] [PubMed] [Google Scholar]
- 35.Nghiem P., Ollick T., Gardner P., Schulman H. (1994) Nature 371, 347–350 [DOI] [PubMed] [Google Scholar]
- 36.DeMaria C. D., Soong T. W., Alseikhan B. A., Alvania R. S., Yue D. T. (2001) Nature 411, 484–489 [DOI] [PubMed] [Google Scholar]
- 37.Lee W. S., Ngo-Anh T. J., Bruening-Wright A., Maylie J., Adelman J. P. (2003) J. Biol. Chem. 278, 25940–25946 [DOI] [PubMed] [Google Scholar]
- 38.Ko J., Fuccillo M. V., Malenka R. C., Südhof T. C. (2009) Neuron 64, 791–798 [DOI] [PMC free article] [PubMed] [Google Scholar]
- 39.de Wit J., Sylwestrak E., O'Sullivan M. L., Otto S., Tiglio K., Savas J. N., Yates J. R., 3rd, Comoletti D., Taylor P., Ghosh A. (2009) Neuron 64, 799–806 [DOI] [PMC free article] [PubMed] [Google Scholar]
- 40.Linhoff M. W., Laurén J., Cassidy R. M., Dobie F. A., Takahashi H., Nygaard H. B., Airaksinen M. S., Strittmatter S. M., Craig A. M. (2009) Neuron 61, 734–749 [DOI] [PMC free article] [PubMed] [Google Scholar]
- 41.Sun Y. M., Greenway D. J., Johnson R., Street M., Belyaev N. D., Deuchars J., Bee T., Wilde S., Buckley N. J. (2005) Mol. Biol. Cell 16, 5630–5638 [DOI] [PMC free article] [PubMed] [Google Scholar]
- 42.Nakagawa Y., Kuwahara K., Harada M., Takahashi N., Yasuno S., Adachi Y., Kawakami R., Nakanishi M., Tanimoto K., Usami S., Kinoshita H., Saito Y., Nakao K. (2006) J. Mol. Cell Cardiol. 41, 1010–1022 [DOI] [PubMed] [Google Scholar]
- 43.Chong J. A., Tapia-Ramírez J., Kim S., Toledo-Aral J. J., Zheng Y., Boutros M. C., Altshuller Y. M., Frohman M. A., Kraner S. D., Mandel G. (1995) Cell 80, 949–957 [DOI] [PubMed] [Google Scholar]
- 44.Schoenherr C. J., Anderson D. J. (1995) Science 267, 1360–1363 [DOI] [PubMed] [Google Scholar]
Associated Data
This section collects any data citations, data availability statements, or supplementary materials included in this article.


