Abstract
The SIRT1 deacetylase inhibits fat synthesis and stimulates fat oxidation in response to fasting, but the underlying mechanisms remain unclear. Here we report that SREBP-1c, a key lipogenic activator, is an in vivo target of SIRT1. SIRT1 interaction with SREBP-1c was increased during fasting and decreased upon feeding, and consistently, SREBP-1c acetylation levels were decreased during fasting in mouse liver. Acetylated SREBP-1c levels were also increased in HepG2 cells treated with insulin and glucose to mimic feeding conditions, and down-regulation of p300 by siRNA decreased the acetylation. Depletion of hepatic SIRT1 by adenoviral siRNA increased acetylation of SREBP-1c with increased lipogenic gene expression. Tandem mass spectrometry and mutagenesis studies revealed that SREBP-1c is acetylated by p300 at Lys-289 and Lys-309. Mechanistic studies using acetylation-defective mutants showed that SIRT1 deacetylates and inhibits SREBP-1c transactivation by decreasing its stability and its occupancy at the lipogenic genes. Remarkably, SREBP-1c acetylation levels were elevated in diet-induced obese mice, and hepatic overexpression of SIRT1 or treatment with resveratrol, a SIRT1 activator, daily for 1 week decreased acetylated SREBP-1c levels with beneficial functional outcomes. These results demonstrate an intriguing connection between elevated SREBP-1c acetylation and increased lipogenic gene expression, suggesting that abnormally elevated SREBP-1c acetylation increases SREBP-1c lipogenic activity in obese mice. Reducing acetylation of SREBP-1c by targeting SIRT1 may be useful for treating metabolic disorders, including fatty liver, obesity, and type II diabetes.
Keywords: Chromatin Regulation, DNA Transcription, Fatty Acid Metabolism, Insulin, Liver Metabolism, Acetylation, Fatty Liver, Lipogenesis, p300, Resveratrol
Introduction
The NAD+-dependent SIRT1 (sirtuin 1) deacetylase plays a critical role in cellular metabolism, stress responses, and possibly aging by modulating the activity of transcription factors and cofactors by protein deacetylation (1–4). In response to low nutritional availability, SIRT1 functions as a master switch to maintain lipid and glucose homeostasis and energy balance by regulating important metabolic regulators, such as PGC-1α (PPARγ coactivator α), Foxo-1, and liver X receptor (1, 5–7). We recently identified the nuclear bile acid receptor, farnesoid X receptor (FXR),3 as an important in vivo target of SIRT1 in the regulation of hepatic lipid metabolism (8). Of these reported regulators, the function of SIRT1 in deacetylating and enhancing the activity of PGC-1α has been well established (1, 5, 9, 10). SIRT1 deacetylation of PGC-1α increases its activity, which enhances the expression of metabolic genes involved in hepatic gluconeogenesis, fatty acid β-oxidation, and mitochondrial function (1, 3, 11). It was recently demonstrated that acute down-regulation of SIRT1 in mouse liver using adenoviral delivery increased expression of lipogenic genes and decreased expression of genes involved in fatty acid β-oxidation and bile acid biosynthesis (5). Consistent with these observations, activation of SIRT1 by treatment with SIRT1 activators, such as a natural pleiotropic activator, resveratrol, or a synthetic activator, SIRT1720, improved mitochondrial function, increased fat oxidation, and decreased fat synthesis by increasing deacetylation of PGC-1α (12–14).
Sterol response element-binding proteins belong to the basic helix-loop-helix leucine zipper family of DNA binding transcription factors (15–17). SREBP-1a and -1c (sterol response element-binding protein 1a and 1c, respectively) are produced from the same gene, and SREBP-2 is encoded by a separate gene (15, 18). SREBP-1c contains 4 unique amino acids in its N terminus but lacks 28 acidic amino acids that are present in SREBP-1a (15, 19, 20). Expression of SREBP-1c is more abundant than expression of SREBP-1a in adult liver, whereas SREBP-1a is the predominant isoform in HepG2 cells (15–17). SREBP-2 plays a crucial role in the regulation of cholesterol synthesis, and SREBP-1a and -1c control expression of fatty acid and triglyceride synthesis (18). In response to feeding, SREBP-1c binds to its lipogenic target genes, such as fatty acid synthase (Fas), and to its own gene and thereby stimulates hepatic lipogenesis (15, 21–23). We and others showed that SREBP-1c also plays a role in suppression of hepatic bile acid biosynthesis in response to insulin under feeding conditions by inhibiting transcription of Cyp7a1 (cholesterol 7α hydroxylase), the rate-limiting bile acid synthetic enzyme (24, 25).
The activity of SREBP-1 was shown to be regulated by post-translational modifications, such as phosphorylation, ubiquitination, and acetylation (26–29). A ubiquitin ligase, Fbw7, was shown to interact with SREBP-1 and enhances its ubiquitination in a phosphorylation-dependent manner (28). Further, a functional interplay between ubiquitination and acetylation of SREBP-1a was also reported (27). It was also demonstrated that GSK3 or a salt-inducible kinase negatively regulates lipogenic activity of SREBP-1c by phosphorylation (29, 30).
Although extensive studies have shown beneficial functions of SIRT1 in metabolic regulation, how SIRT1 inhibits hepatic lipogenesis and whether a key lipogenic activator SREBP-1c is an in vivo target of SIRT1 is not fully understood. Using in vivo animal studies as well as molecular and cellular studies, we obtained compelling evidence indicating that SREBP-1c is an important in vivo target of SIRT1 in the regulation of hepatic lipid metabolism. Lys-289 and Lys-309 near and within the DNA binding domain of SREBP-1c, respectively, is the target of p300 acetylase and SIRT1 deacetylase. Deacetylation of SREBP-1c by SIRT1 inhibited SREBP-1c activity by decreasing its stability and its association with its lipogenic target gene promoters. SREBP-1c acetylation levels were dynamically regulated during fasting and feeding cycles and increased in HepG2 cells treated with insulin and glucose. Remarkably, SREBP-1c acetylation levels were highly elevated in diet-induced obese mice, and overexpression of SIRT1 decreased the acetylation levels with changes in metabolic gene expression expected to be beneficial.
EXPERIMENTAL PROCEDURES
Cell Culture and Transfection Assay
COS-1 cells and mouse hepatoma cells (Hepa1c1c7) were maintained in Dulbecco's modified Eagle's medium (DMEM) at 37 °C and 5% CO2. Human hepatoma HepG2 cells (ATCC HB8065) were maintained in DMEM/F-12 (1:1) medium. Media were supplemented with 10% fetal bovine serum and 100 units/ml penicillin/streptomycin. Cell-based functional reporter assays were performed as described previously (24, 31). COS-1 or Hepa1c1c7 cells were transfected using Lipofectamine, and HepG2 cells were transfected by electroporation to improve transfection efficiency. SREBP-1c mutants were constructed by site-directed mutagenesis (Stratagene, Inc.) and confirmed by sequencing.
Animal Experiments and Tail Vein Injection of Adenoviral Vectors
8–10-week-old male BALB/c mice were maintained on a 12-h light and 12-h dark cycle. Mice were randomly divided into groups and fasted overnight with free access to water or fasted overnight and then fed standard chow for 3 h as described previously (8, 24). Normal or obese mice were injected with Ad-FLAG-SIRT1, Ad-siSIRT1, or control Ad-empty (0.5–1.0 × 10⁹ active viral particles in 200 μl of PBS), and 5–7 days after infection, mice were fasted overnight, and livers were collected for further analysis. For the diet-induced obese mouse studies, 8-week-old BALB/c mice were fed with either a standard normal chow or a high fat diet (42% from fat; Harland Teklad TD88137) for 16–20 weeks. Diet-induced obese mice were infected with Ad-FLAG-SIRT1, and 1 week later, livers were collected for acetylation assays. All of the animal use and adenoviral protocols were approved by the Institutional Use and Care of Animals and Biosafety Committees at the University of Illinois and were in accordance with National Institutes of Health guidelines.
Cycloheximide (CHX) Experiments
CHX experiments were performed as described previously (32). COS-1 cells were cotransfected with plasmids for SREBP-1c wild type or mutants, along with CMV-His6-p300 (33) or CMV-HA-SIRT1 (34), and then treated with CHX (10 μg/ml) for the times indicated in the figure legends. Cell extracts were prepared, and SREBP-1c levels were detected by Western analysis.
In-cell Ubiquitination Assays
Because of poor transfection efficiency in HepG2 cells, in-cell ubiquitination studies utilizing transfection were carried out in mouse Hepa1c1c7 cells. Cells were transfected with expression plasmids for SREBP-1c and HA-ubiquitin in the presence of SIRT1 expression plasmid. Cells were treated with 5 μm MG132 for 5 h, and cell extracts were prepared under denaturing conditions using radioimmune precipitation buffer (50 mm Tris-HCl, pH 7.5, 1 mm EDTA, 1% Nonidet P-40, 1% sodium deoxycholate, 0.1% SDS). FLAG-SREBP-1c was immunoprecipitated with M2 antibody (Sigma), and after washing in radioimmune precipitation buffer, proteins were separated by SDS-PAGE, and HA-ubiquitinated FLAG-SREBP-1c was detected by Western analyses using HA or ubiquitin antibody.
In Vitro, In-cell, and in Vivo Acetylation and Deacetylation Assays
For in-cell assays, COS-1 or mouse Hepa1c1c7 cells in 6-well plates were cotransfected with expression plasmids for FLAG-SREBP-1c, p300, and/or SIRT1. For adenoviral experiments, HepG2 cells were infected with an adenoviral vector expressing p300 siRNA (35) or a control vector, and 24 h later, cells were incubated in serum-free low glucose (5 mm) medium overnight and then treated with insulin (100 nm) and high glucose (25 mm) for 30 min. To inhibit deacetylase activity, cells were treated with deacetylase inhibitors, 500 nm trichostatin A, and freshly prepared 10 mm nicotinamide (Nam) for 2–5 h before preparing the cell extracts.
For in vivo acetylation assays, liver nuclear extracts were prepared in the presence of deacetylase inhibitors. Endogenous SREBP-1c was immunoprecipitated at 4 °C for 2 h in radioimmune precipitation buffer and washed four times with radioimmune precipitation buffer. Acetylated SREBP-1c levels were detected by Western analyses using acetyl-Lys antibody (Cell Signaling, Inc.).
For in vitro deacetylation assays, COS-1 cells (four 150-mm plates) were transfected with FLAG-SREBP-1c expression plasmids, and 48 h later, FLAG-SREBP-1c was isolated by M2 agarose and incubated with purified p300 and acetyl-CoA in buffer (50 mm Hepes, pH. 7.9, 10% glycerol). After incubation at 30 °C for 30 min, the beads were thoroughly washed, and acetylated FLAG-SREBP-1c was incubated with purified GST or GST-SIRT1 in the presence of 50 μm NAD+ in deacetylation buffer (Tris-HCl, pH 8.8, 5% glycerol, 50 mm NaCl, 4 mm MgCl2, 1 mm DTT) at 37 °C for 1 h. Proteins were separated by SDS-PAGE, and acetylated SREBP-1c was detected by Western analysis using acetyl-Lys antibody.
Quantitative RT-PCR
Total RNA was isolated using TRIzol reagent (Invitrogen). Real-time RT-PCR was performed with an iCycler iQ (Bio-Rad) using SYBR Green PCR master mix. Target gene mRNA levels were normalized to those of 36B4.
Co-IP and Chromatin IP (ChIP) Assays
Co-IP and ChIP assays were performed as described (8, 24, 32, 36, 37). For ChIP assays, HepG2 cells were transfected with expression plasmids using electroporation, and cells were incubated with serum-free low glucose medium overnight and then treated with 100 nm insulin and 25 mm glucose for 30 min and used for ChIP assays. Sequences of the primers for quantitative RT-PCR and ChIP assays are available upon request.
RESULTS
SIRT1 Directly Interacts with and Deacetylates SREBP-1c
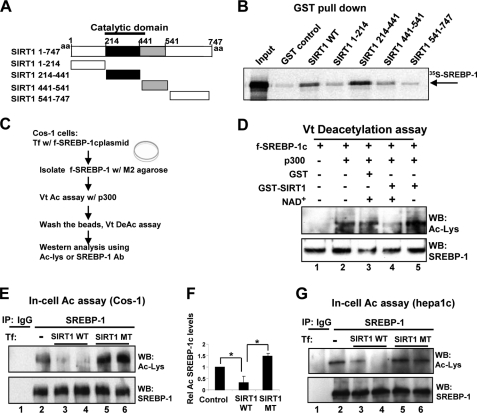
To examine whether SIRT1 directly interacts with SREBP-1c, in vitro GST pull-down assays were performed. SREBP-1c interacted with full-length SIRT1 and a fragment (amino acids 214–441) containing the catalytic domain (Fig. 1, A and B). Because SIRT1 directly interacts with SREBP-1c through the catalytic domain, we asked whether SIRT1 can deacetylate SREBP-1c using in vitro deacetylation assays. SREBP-1c proteins were expressed in cells, purified, and used in deacetylation assays (Fig. 1C). Western analyses showed that SREBP-1c is acetylated in samples incubated with p300 (Fig. 1D, lanes 1 and 2). Incubation of the acetylated SREBP-1c with GST-SIRT1 resulted in an NAD+-dependent decrease in acetylation, whereas no decrease was observed with the control GST (Fig. 1D, lanes 3–5). These results indicate that SIRT1 deacetylates SREBP-1c in vitro in an NAD+-dependent manner.
FIGURE 1.
SIRT1 directly interacts with and deacetylates SREBP-1c. A, a schematic diagram of full-length SIRT1 and deletion mutants. B, purified GST or GST-SIRT1 fusion proteins that had been bound to glutathione-Sepharose were incubated with 35S-labeled SREBP-1c, and after washing, bound proteins were eluted and analyzed by SDS-PAGE followed by autoradiography. C, experimental outline of in vitro deacetylation assays. D, FLAG-SREBP-1c, acetylated by p300, was further incubated with GST control or GST-SIRT1 in the absence or presence of NAD+, and acetylated FLAG-SREBP-1c and FLAG-SREBP-1c in input samples were detected by Western analysis (bottom). E–G, COS-1 (E and F) or Hepa1c1c7 cells (G) were co-transfected with FLAG-SREBP-1c and p300 expression plasmids with SIRT1 plasmids as indicated, and 36 h later, in-cell acetylation assays were performed. SREBP-1c was immunoprecipitated from cell extracts under stringent conditions using SDS-containing buffers, and acetylated SREBP-1c was detected by Western analysis. Duplicates are shown. Band intensities of acetylated SREBP-1c were quantified using the ImageJ program, and the values from control samples were set to 1. Statistical significance was determined using Student's t test. *, p < 0.05 (n = 3). aa, amino acids; Ab, antibody; WB, Western blot; IP, immunoprecipitation. Error bars, S.E.
Deacetylation of SREBP-1c by SIRT1 was further confirmed in cells. SREBP-1c was immunoprecipitated under stringent conditions with buffers containing SDS, and acetylated SREBP-1c levels were detected by Western analysis using acetyl-Lys antibody. Co-expression of SIRT1 wild type with p300 substantially reduced acetylation levels of SREBP-1c by over 60% (Fig. 1, E (lanes 2–4) and F), whereas co-expression of a SIRT1 mutant lacking the deacetylase activity resulted in increased acetylated SREBP-1c levels (Fig. 1, E (lanes 2, 5, and 6) and F). Similar results were observed with SREBP-1 in mouse Hepa1c1c7 cells (Fig. 1G). These results indicate that SIRT1 can deacetylate SREBP-1c in vitro and in cells.
SIRT1 Deacetylates Hepatic SREBP-1c in Vivo
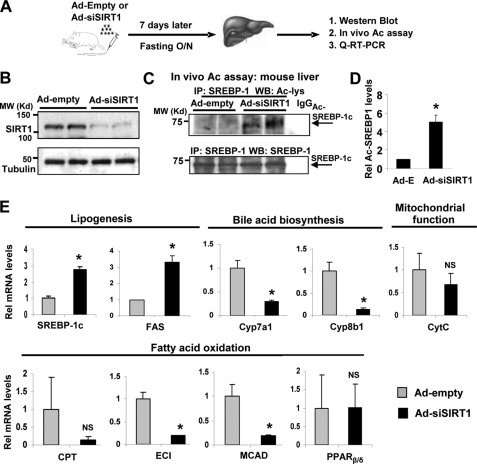
To directly demonstrate that SIRT1 deacetylates SREBP-1c in vivo, endogenous SIRT1 in mouse liver was acutely down-regulated by tail vein injection of an adenoviral vector expressing siRNA for SIRT1 (Ad-siSIRT1), and acetylation levels of SREBP-1c were examined (Fig. 2A). Hepatic SIRT1 levels were efficiently reduced in fasted mice infected with Ad-siSIRT1 compared with mice injected with Ad-empty, whereas control tubulin levels were not changed (Fig. 2B). SIRT1 depletion substantially increased acetylation levels of endogenous SREBP-1c in the livers of fasted mice (Fig. 2, C and D). Consistently, the addition of Nam, but not trichostatin A, to mouse liver extracts during immunoprecipitation increased acetylation levels of endogenous SREBP-1c (supplemental Fig. S1). These results suggest that SIRT1 deacetylates SREBP-1c in mouse liver in vivo.
FIGURE 2.
Down-regulation of SIRT1 increases acetylated SREBP-1c levels in vivo. A, the experimental procedure is shown. Mice were injected with Ad-siSIRT1 or control Ad-empty via tail veins, and 7 days later, mice were fasted overnight, and livers were collected for further analysis. B, Western blotting was performed to detect hepatic SIRT1 protein levels. C, endogenous SREBP-1c was immunoprecipitated, and acetylated SREBP-1c levels were detected by Western analysis. Duplicates are shown. D, band intensities of acetylated and total SREBP-1 were determined using ImageJ software, and acetylated SREBP-1 levels relative to total levels from the mice infected with Ad-empty were set to 1. Statistical significance was determined by Student's t test. *, p < 0.05 (n = 3). E, the mRNA levels of the indicated genes were determined by real-time quantitative RT-PCR in the same livers used for in vivo acetylation assays. Statistical significance was determined by Student's t test. * and NS, p < 0.05 and statistically not significant, respectively (n = 5). IP, immunoprecipitation. Error bars, S.E.
We also examined the effects of SIRT1 depletion on hepatic expression of metabolic genes. Consistent with elevated SREBP-1c acetylation levels resulting from down-regulation of hepatic SIRT1, which is expected to increase activity of SREBP-1c, the expression of Srebp-1c and Fas, key lipogenic genes, were significantly increased in these mice (Fig. 2E). Furthermore, down-regulation of SIRT1 significantly decreased expression of Cyp7a1 and Cyp8b1, hepatic enzymes involved in the bile acid biosynthetic pathway. The SIRT1 depletion also reduced the expression of a mitochondrial oxidative phosphorylation gene, cytochrome c, although the decrease was not statistically significant. Expression of fatty acid oxidation genes, such as Eci (enoyl-CoA isomerase) and Mcad, was also decreased significantly in the SIRT1-depleted mice. In contrast, expression of Pparβ/δ, an important regulator in energy balance (38), was not changed in these mice. These in vivo studies demonstrate that SIRT1 deacetylates SREBP-1c in the mouse liver, which correlates with beneficially expected gene expression patterns of lipid metabolic genes.
SREBP-1 Acetylation Is Increased under Feeding Mimic Conditions in a p300-dependent Manner
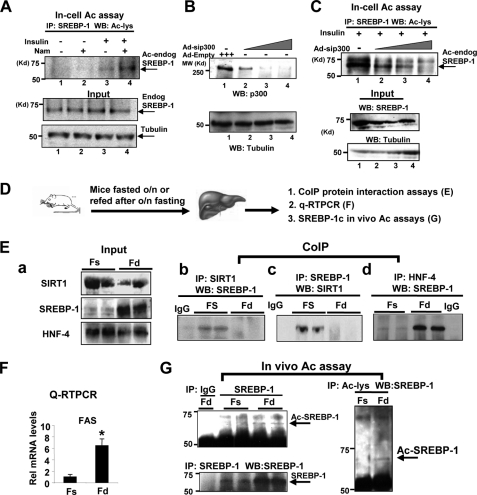
Because SIRT1 deacetylates SREBP-1c (Figs. 1 and 2) and NAD+-dependent SIRT1 activity is increased under nutritional deprivation (1), acetylation levels of SREBP-1 would be expected to be decreased during fasting and increased upon feeding. To test this idea, we first examined whether acetylation levels of endogenous SREBP-1 in HepG2 cells are increased by treatment with insulin and glucose to mimic feeding conditions. Treatment with insulin and glucose slightly increased acetylation levels of endogenous SREBP-1 (Fig. 3A, lanes 1 and 3). Further treatment with Nam, a SIRT1 inhibitor, markedly increased the acetylation levels (lanes 3 and 4). These results suggest that acetylation of endogenous SREBP-1 in HepG2 cells is increased under conditions that mimic feeding and SIRT1 deacetylates SREBP-1.
FIGURE 3.
SREBP-1 acetylation is increased under conditions that mimic feeding in a p300-dependent manner. A, HepG2 cells were treated with vehicle or Nam (10 mm) for 3 h and further treated with insulin (100 nm) and glucose (25 mm) for 30 min. Then cells were collected, and acetylation assays were carried out as described in the legend to Fig. 1. Acetylated endogenous SREBP-1 levels were detected by Western analysis. B and C, HepG2 cells were infected with Ad-sip300, and 48 h later, cells were treated with the HDAC inhibitors trichostatin A and Nam for 3 h and further treated with insulin and glucose. Protein levels of p300, SREBP-1, and acetylated endogenous SREBP-1 were detected. D, experimental outline. E (a), protein levels in input samples were detected by Western analysis. E (b, c, and d), co-IP protein interaction studies were done using antibodies as indicated. F, the mRNA levels of FAS were measured by quantitative RT-PCR. Statistical significance was determined using Student's t test. *, p < 0.05 (n = 3). G, endogenous SREBP-1c was immunoprecipitated and acetylated SREBP-1c levels were detected (left). Conversely, acetylated proteins were immunoprecipitated by acetyl-Lys antibody, and then acetylated SREBP-1c proteins were detected using SREBP-1 antibody (right). IP, immunoprecipitation; WB, Western blot. Error bars, S.E.
It was previously reported from in vitro and cell culture studies that SREBPs are acetylated by p300/CBP acetylases (27). To test whether increased acetylation of SREBP-1 by insulin and glucose treatment is dependent on p300, endogenous p300 in HepG2 cells was down-regulated by siRNA, and acetylated SREBP-1 levels were detected. The p300 levels were decreased in cells infected with Ad-sip300, whereas control tubulin levels were not (Fig. 3B). The acetylated SREBP-1 levels were decreased in cells infected with adenoviral siRNA for p300 in a dose-dependent manner (Fig. 3C). These results demonstrate that p300 acetylates SREBP-1 in HepG2 cells under conditions mimicking feeding.
SREBP-1c Acetylation Is Dynamically Regulated by Fasting and Feeding in Vivo
We next examined whether acetylation of SREBP-1c is regulated in response to fasting and feeding. Mice were fasted overnight or refed after overnight fasting, and livers were collected for further analyses (Fig. 3D). Hepatic SREBP-1c protein levels were substantially increased upon feeding (Fig. 3E, a), which is consistent with elevated mRNA levels of the key lipogenic Fas gene, a well known SREBP-1c target (Fig. 3F). Co-IP studies revealed that SREBP-1c interaction with SIRT1 was increased during fasting, whereas interaction with HNF-4 was increased during feeding (Fig. 3E, b–d). Consistently, acetylated SREBP-1c was barely detectable in fasted mice (Fig. 3G). Due to the dynamic nature of acetylation and deacetylation of SREBP-1c, it was challenging to consistently detect elevated acetylation of endogenous SREBP-1c under feeding conditions. These results, taken together with acetylation studies in vitro, in cells, and in vivo (Figs. 1–3), suggest that SIRT1 decreases acetylated SREBP-1c levels during fasting.
SREBP-1c Is Acetylated at Lys289 and Lys309 by p300
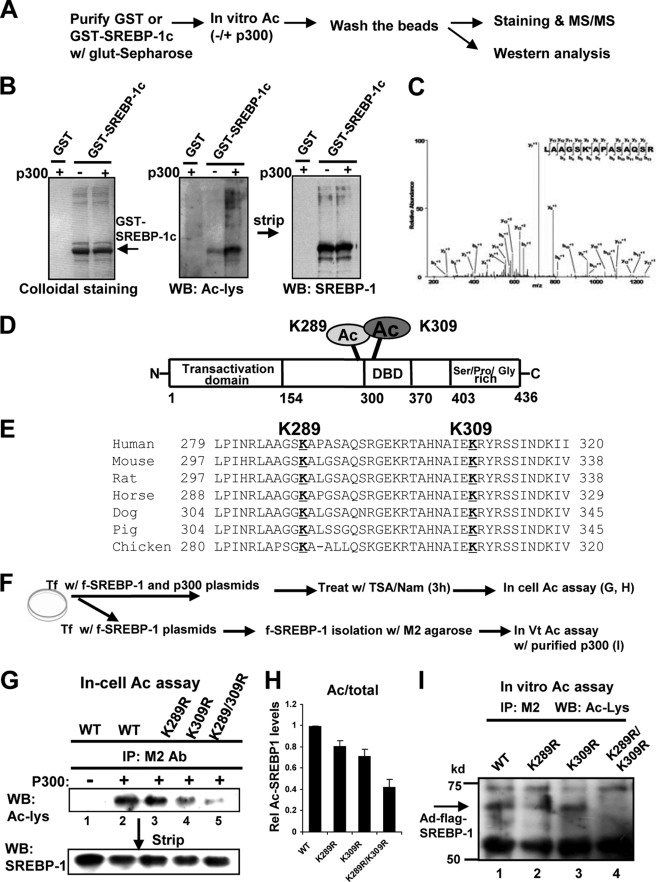
To better understand the functional roles of SREBP-1c acetylation, we sought to identify acetylation site(s) in SREBP-1c. It was reported that the SREBP-1a isoform is acetylated by p300 at Lys-333 in SREBP-1a (equivalent to Lys-309 in SREBP-1c) (27). Using tandem mass spectrometry and mutagenesis studies, we further identified Lys-289 as well as Lys-309 as acetylation sites (Fig. 4, A–D). Lys-289 and Lys-309 are highly conserved in vertebrates (Fig. 4E). To confirm these results, in-cell and in vitro acetylation assays were performed using SREBP-1c mutants (Fig. 4, F–I). Acetylation of SREBP-1c wild type was substantially increased in the presence of p300 in COS-1 cells (Fig. 4G, lanes 1 and 2). Acetylation of SREBP-1c was not markedly decreased with the K289R mutant, was somewhat decreased with K309R mutant, and was substantially reduced with K289R/K309R double mutant (Fig. 4, G and H). To directly determine if both residues are important for acetylation, in vitro acetylation assays were performed. Acetylated SREBP-1c was detectable with wild type, K289R, and K309R but was not detectable with the K289R/K309R mutant (Fig. 4I). Comparable levels of SREBP-1c wild type, K309R, and K289R/K309R were utilized in the in vitro acetylation assays (supplemental Fig. S2). These results indicate that both Lys-289 and Lys-309 sites are important for acetylation by p300.
FIGURE 4.
Lys-289 and Lys-309 are the major sites in SREBP-1c acetylated by p300. A, the experimental protocol for MS/MS analysis is outlined. B, purified GST or GST-SREBP-1c was incubated with p300, and proteins were separated using SDS-PAGE followed by Western analysis. C, MS/MS analysis of acetylated SREBP-1c is shown, which identifies Lys-289 as a site acetylated by p300. D, a schematic diagram of the acetylation sites in SREBP-1c. E, alignments of the SREBP-1c region containing Lys-289 or Lys-309 from different vertebrates. F, outline of experimental protocols. G, COS-1 cells were transfected with plasmids as indicated, and acetylation assays were performed as described in the legend to Fig. 1. H, band intensities of acetylated SREBP-1c were quantified, and the values from wild type samples were set to 1. Consistent results were observed from two additional assays. I, in vitro acetylation assays were performed as described under “Experimental Procedures.” Acetylated FLAG-SREBP-1c was detected by Western analysis. IP, immunoprecipitation; WB, Western blot. Error bars, S.E.
SIRT1 Decreases the Stability of SREBP-1c by Increasing Ubiquitination
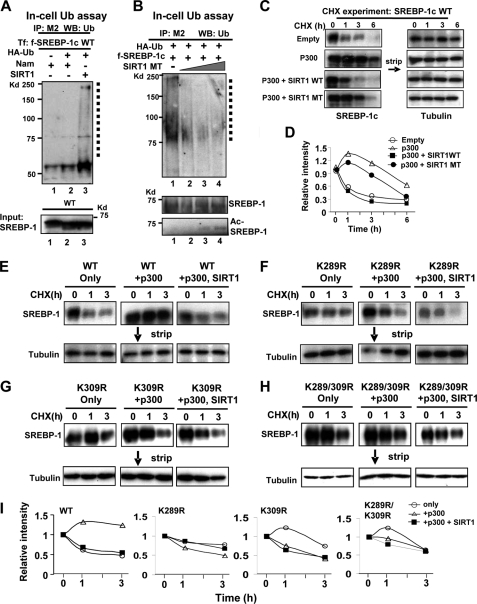
Acetylation of transcriptional factors, such as p53, Foxo-1, and FXR, influences their stability, DNA binding, and protein-protein interactions (6, 8, 27, 39). It was reported that acetylation of SREBP-1a increases its stability by preventing its ubiquitination (27). To examine whether SIRT1-mediated deacetylation alters SREBP-1c stability, we first examined whether SIRT1 affects ubiquitination of SREBP-1c. Overexpression of a SIRT1 wild type increased ubiquitinated SREBP-1c levels (Fig. 5A, lanes 1–3). Further, expression of a catalytically inactive SIRT1 mutant decreased ubiquitinated SREBP-1c levels and, consistently, increased acetylated SREBP-1c levels (Fig. 5B, lanes 1–4). These results suggest that SIRT1 increases ubiquitination of SREBP-1c, which should decrease the stability of SREBP-1c.
FIGURE 5.
SIRT1 decreases SREBP-1c stability, which is correlated with increased ubiquitination. A and B, Hepa1c1c7 cells were transfected with plasmids as indicated, and in-cell ubiquitination assays were performed. FLAG-SREBP-1c was immunoprecipitated in SDS-containing buffers, and ubiquitinated FLAG-SREBP-1c was detected by Western analysis. Ubiquitinated FLAG-SREBP-1c is indicated by a dotted line. FLAG-SREBP-1c levels in input are shown at the bottom. In B, acetylated SREBP-1c levels were detected by Western analysis using acetyl-Lys antibody. C–I, CHX experiments. COS-1 cells were transfected with plasmids as indicated, and 36 h later, cells were treated with CHX for the indicated times, and SREBP-1 levels were detected. Membranes were stripped, and tubulin levels were detected. D and I, band intensities were measured and normalized to the values from the zero time points, which were set to 1. Consistent results were observed from two independent CHX assays. Ub, ubiquitin; IP, immunoprecipitation; WB, Western blot.
To test the effects of p300 and SIRT1 on SREBP-1c stability, we monitored protein degradation using CHX experiments. SREBP-1c was rapidly degraded with a half-life of about 1 h (Fig. 5, C and D). Overexpression of p300 substantially increased the half-life, and coexpression of SIRT1 wild type with p300 markedly decreased the stability, reducing the half-life from about 6 h to about 1 h. In contrast, a smaller decrease was observed in cells co-expressing a catalytically inactive SIRT1 mutant. These results indicate that p300 increases SREBP-1c stability and that SIRT1 decreases SREBP-1c stability in a manner dependent on it deacetylation activity.
We further analyzed the role of SREBP-1c acetylation in protein stability using the acetylation-defective mutants. Overexpression of p300 robustly increased the half-life of SREBP-1c wild type, and additional expression of SIRT1 substantially decreased it (Fig. 5, E and I). In contrast, these effects were not observed with the K289R, K309R, and K289R/K309R mutants (Fig. 5, F–I). These results suggest that acetylation at Lys-289 and Lys-309 increases SREBP-1c stability, and SIRT1 decreases its stability.
SIRT1 Reduces SREBP-1c Occupancy at Lipogenic Target Promoters
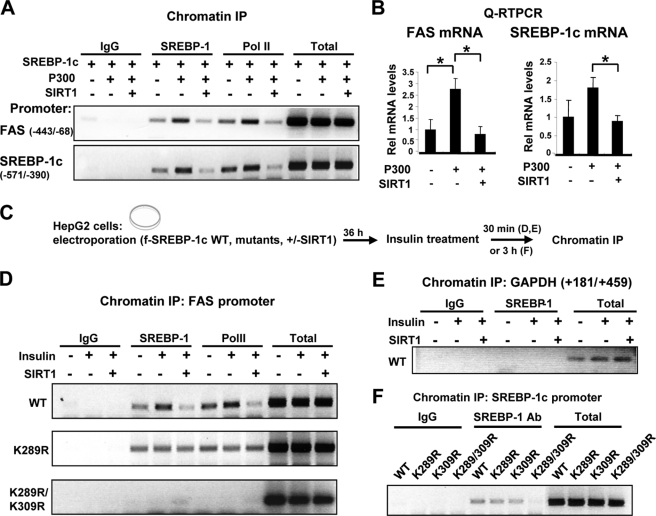
Because acetylation of transcription factors affected their DNA binding ability (6, 8, 39) and Lys-289 and Lys-309 are present near and within the DBD of SREBP-1c, respectively, we next sought to determine the effects of SREBP-1c acetylation on DNA binding. ChIP assays were performed in HepG2 cells overexpressing p300. Although occupancy of SREBP-1c and RNA polymerase II at the Fas and Srebp-1c promoters was increased in cells expressing p300, the occupancy was decreased in cells co-expressing SIRT1 (Fig. 6A and supplemental Fig. S3). These results indicate that p300-mediated acetylation increases, whereas SIRT1-mediated deacetylation decreases, the SREBP-1c occupancy at the promoters. We also examined the effect of SREBP-1c acetylation on the expression of these genes. The Fas and Srebp-1c mRNA levels were increased in HepG2 cells co-expressing SREBP-1c with p300, whereas additional expression of SIRT1 significantly reversed the increase (Fig. 6B). Consistently, cell-based reporter assays showed that down-regulation of SIRT1 using siRNA increased SREBP-1c transactivation of the Fas promoter (supplemental Figs. S4 and S5).
FIGURE 6.
SIRT1 decreases occupancy of SREBP-1c at the Fas and Srebp-1c gene promoters. A, HepG2 cells were transfected with plasmids, as indicated, using electroporation, and association of SREBP-1c or RNA pol II at the Fas and Srebp-1c promoters was detected by ChIP assays. B, the mRNA levels of Fas and Srebp-1c genes were detected by quantitative RT-PCR in parallel. Statistical significance was determined by Student's t test. *, p < 0.05 (n = 3). C, the experimental procedure is outlined. D and E, HepG2 cells were transfected with SREBP-1c wild type or mutant plasmids using electroporation as indicated. Cells were treated with insulin (100 nm) for 30 min and collected for ChIP assays to detect occupancy of SREBP-1c at the Fas promoter (D), Srebp-1c promoter (F), or GAPDH coding region (E). Consistent results were observed from two independent assays. IP, immunoprecipitation. Error bars, S.E.
Because SREBP-1c acetylation was increased in mice under feeding conditions and in HepG2 cells by treatment with insulin (Fig. 3), we next examined the effects of insulin treatment on SREBP-1c binding to the Fas gene promoter (Fig. 6C). The SREBP-1c occupancy at the Fas promoter was markedly increased upon insulin treatment, and overexpression of SIRT1 decreased SREBP-1c occupancy (Fig. 6D). In contrast, the occupancy of wild type SREBP-1c at the control GAPDH coding region was not detected (Fig. 6E). Association of RNA polymerase II was markedly decreased in cells overexpressing SIRT1 (Fig. 6D). In contrast, occupancy of the K289R mutant was detected but not increased by insulin treatment, and remarkably, occupancy of the K289R/K309R double mutant was not detectable (Fig. 6D). Consistently, occupancy of the SREBP-1c K289R/K309R double mutant and RNA polymerase II was substantially decreased at the Srebp-1c promoter (Fig. 6F and supplemental Figs. S6 and S7). These results suggest that SIRT1 deacetylates and inhibits SREBP-1c transactivation, at least in part, by inhibiting its occupancy at target promoters.
SREBP-1c Acetylation Levels Are Highly Elevated in Diet-induced Obese Mice
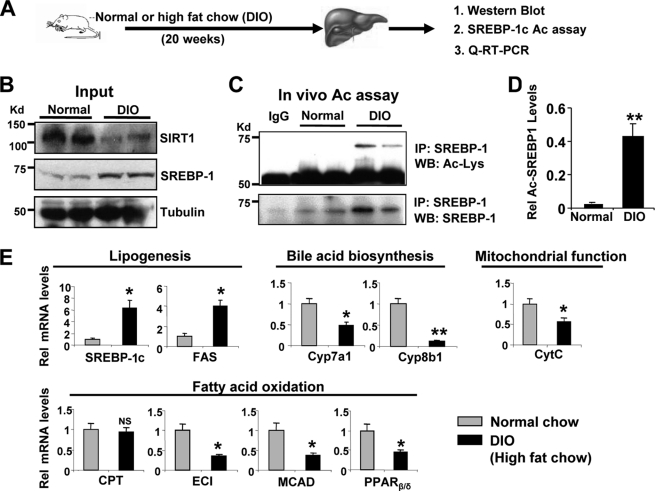
Hepatic SREBP-1c levels are highly elevated in fatty livers of animal models of obesity and type II diabetes (40). Because acetylation of SREBP-1c increases its transactivation ability by increasing protein stability and promoter occupancy at lipogenic target genes (Figs. 5 and 6), we asked whether SREBP-1c acetylation levels are abnormally elevated in a metabolic disease state model using diet-induced obese (DIO) mice (Fig. 7A). As previously reported (12, 13, 40), SIRT1 levels were substantially decreased, and SREBP-1c levels were increased in livers of obese mice (Fig. 7B), confirming the effectiveness of the chronic high fat diet. Consistent with decreased SIRT1 levels in these mice, acetylated SREBP-1c levels were dramatically increased compared with control mice (Fig. 7, C and D). The mRNA levels of SREBP-1c target genes, such as Srebp-1c itself and Fas, were significantly increased in the diet-induced obese mice, and mRNA levels of bile acid biosynthetic genes, Cyp7a1 and Cyp8b1, were substantially decreased (Fig. 7E). In obese mice, expression of cytochrome c was significantly reduced, and genes involved in fatty acid oxidation, such as Eci and Mcad, were also decreased, whereas Cpt (carnitine palmitoyltransferase) gene expression was not changed. Expression of Pparβ/δ was also significantly decreased in obese mice. These patterns of gene expression are similar to those observed in SIRT1-depleted mice (Fig. 2E) and demonstrate that elevated SREBP-1c acetylation levels correlate with gene expression patterns expected to be deleterious.
FIGURE 7.
Acetylated SREBP-1c levels are highly elevated in diet-induced obese (DIO) mice. A, the experimental procedure. B, protein levels were determined by Western analysis. Results from two mice are shown. C, endogenous SREBP-1c was immunoprecipitated and acetylated SREBP-1c was detected by Western analysis. D, band intensities of acetylated and total SREBP-1 were measured, and acetylated SREBP-1 levels relative to total levels were calculated. E, the mRNA levels of the indicated genes were determined by quantitative RT-PCR. Statistical significance was determined by Student's t test (n = 4). *, **, and NS, p < 0.05, p < 0.01, and statistically not significant, respectively. IP, immunoprecipitation; WB, Western blot. Error bars, S.E.
Overexpression of Hepatic SIRT1 Decreases SREBP-1c Acetylation Levels in Obese Mice
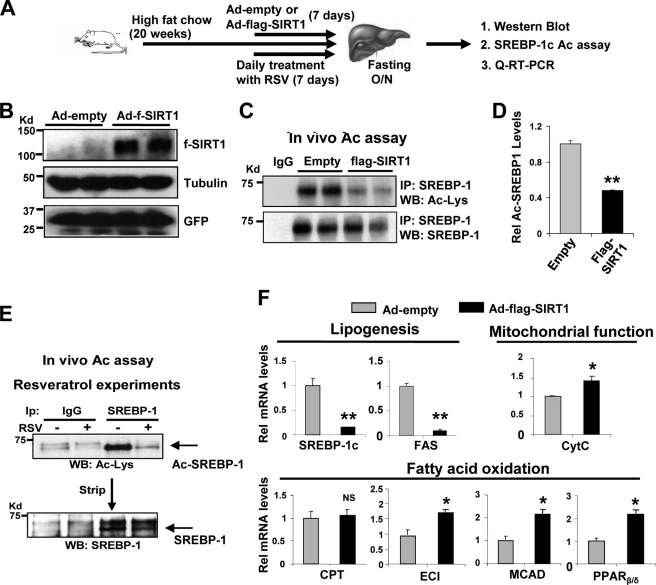
Our in vivo acetylation studies in mice infected with Ad-siSIRT1 (Fig. 2) and diet-induced obese mice (Fig. 7) showed an intriguing correlation between elevated SREBP-1c acetylation levels and detrimental lipid metabolic gene expression profiles. To test whether overexpression of SIRT1 could reverse these effects in the obese mice, Ad-FLAG-SIRT1 was injected, and mice were fasted overnight, and acetylation of endogenous hepatic SREBP-1c was examined (Fig. 8A). Overexpression of SIRT1 (Fig. 8B) significantly decreased SREBP-1c acetylation levels by 80% in the obese mice infected with Ad-FLAG-SIRT1 (Fig. 8, C and D). Consistent with these results, activation of SIRT1 by resveratrol, a SIRT1 activator (12–14), substantially decreased hepatic acetylated SREBP-1c levels (Fig. 8E). In quantitative RT-PCR analyses, mRNA levels of Srebp-1c and Fas decreased in mice infected with Ad-FLAG-SIRT1 (Fig. 8F). Overexpression of SIRT1 resulted in increased expression of hepatic genes involved in fatty acid β-oxidation and mitochondrial function. These in vivo studies, taken together with in vitro and cell studies, demonstrate that SIRT1 deacetylates and inhibits hepatic SREBP-1c activity by decreasing its stability and promoter occupancy at the FAS and SREBP-1c, which contributes to inhibition of hepatic lipogenesis.
FIGURE 8.
Overexpression of SIRT1 in obese mice decreases SREBP-1c acetylation levels. A, outline of the experimental protocol. B, protein levels of FLAG-SIRT1 were detected by Western blotting. C–E, endogenous SREBP-1c was immunoprecipitated from liver extracts from obese mice overexpressing FLAG-SIRT1 (C) or mice treated orally with resveratrol daily for 1 week (E). Acetylated SREBP-1c levels were detected by Western analysis. D, band intensities of acetylated and total SREBP-1 were measured, and acetylated SREBP-1 levels relative to total levels were calculated. F, the mRNA levels of indicated genes were determined by quantitative RT-PCR. D and F, statistical significance was determined by Student's t test, and S.E. was calculated (n = 3). * and **, p < 0.05 and p < 0.01, respectively. IP, immunoprecipitation; WB, Western blot. Error bars, S.E.
DISCUSSION
Using adenovirus-mediated down-regulation or overexpression of SIRT1 in livers of normal and diet-induced obese mice, as well as molecular, biochemical, and cellular studies, we have obtained compelling evidence that the lipogenic activator SREBP-1c is an important in vivo target of SIRT1. Tandem mass spectrometry and mutagenesis studies revealed that Lys-289 and Lys-309 of SREBP-1c are targets of p300 acetylation and SIRT1 deacetylation. SIRT1 deacetylates and inhibits SREBP-1c activity by decreasing its stability and by decreasing its occupancy at the lipogenic target gene promoters. Acetylation levels of endogenous SREBP-1c in liver were increased in response to feeding and decreased by fasting, suggesting that SREBP-1c acetylation is normally dynamically regulated by SIRT1. Consistently, depletion of endogenous SIRT1 by adenoviral siRNA substantially increased SREBP-1c acetylation levels. Remarkably, hepatic SREBP-1c acetylation levels were highly elevated in diet-induced obese mice, and adenovirus-mediated overexpression of SIRT1 decreased SREBP-1c acetylation levels, resulting in changes in lipid metabolic gene expression patterns expected to be beneficial.
Our results are consistent with recent studies demonstrating that SIRT1 plays a critical role in the regulation of hepatic lipid metabolism (5, 41). Rodgers and Puigserver (5) originally reported that acute down-regulation of endogenous SIRT1 in mouse liver using adenoviral delivery increased expression of lipogenic genes and decreased expression of genes involved in fatty acid β-oxidation and bile acid biosynthesis. Consistent with these results, a recent knock-out mouse study demonstrated that liver-specific deletion of SIRT1 decreased fatty acid β-oxidation by impairing PPARα/PGC-1α signaling, and these mice developed hepatic steatosis and inflammation when challenged with a high fat diet (41). However, the molecular basis of SIRT1 inhibition of fat synthetic gene expression and stimulation of fat oxidative gene expression was not fully understood. Our current studies suggest that SIRT1 contributes to such beneficial lipid metabolic outcomes in the liver, at least in part, by deacetylating SREBP-1c and inhibiting lipogenic gene expression.
SREBP-1c is a key lipogenic activator and its expression is dynamically regulated in response to nutritional and hormonal cues (15–17, 23). SREBP-1c levels are transiently elevated upon feeding and reduced by fasting in normal mice. In contrast, SREBP-1c levels are constitutively and highly elevated in metabolic disease states, as detected in ob/ob mice and diet-induced obese mice (40). Our studies show that SREBP-1c acetylation enhances SREBP-1c activity by increasing its stability and recruitment to its lipogenic target promoters, which should promote hepatic lipogenesis and further contribute to fatty liver disease (hepatosteatosis), a condition associated with obesity and insulin resistance. It was recently shown that SIRT1 levels were decreased in mice fed alcohol, and consistent with the decreased SIRT1 levels, SREBP-1c acetylation levels were elevated in mice fed ethanol (42). This report, together with our current studies, suggests that SIRT1 is involved in the prevention of non-alcoholic and alcoholic fatty liver by deacetylating and suppressing SREBP-1c activity.
We observed that acetylation of SREBP-1c in liver is dynamically increased upon feeding and decreased during fasting in normal physiological conditions, but the levels were highly elevated in diet-induced obese mice. Constitutively elevated acetylation of SREBP-1c may underlie highly elevated hepatic lipogenesis in these obese mice. In line with these results, we also recently demonstrated that SIRT1 and p300 play important roles in modulating activity of the nuclear bile acid receptor FXR by dynamically acetylating and deacetylating FXR as well as histones at the target gene promoter (8, 31). Remarkably, in metabolic disease states, the interaction of SIRT1 with FXR was substantially decreased, and hepatic FXR acetylation levels were highly elevated (8). In these two studies, acetylation of FXR or SREBP-1 increased protein stability by inhibiting ubiquitination, but the opposite effects of acetylation on transactivation of these two proteins were observed. Although acetylation of FXR resulted in inhibition of heterodimerization with RXR and DNA binding, acetylation of SREBP-1c seemed to increase the occupancy of SREBP-1c with its lipogenic target gene promoters. These FXR and SREBP-1c studies suggest that a dynamic balance between p300 and SIRT1 is important in maintaining metabolic homeostasis, and disruption of this balance leads to hyperactivation or inactivation of metabolic regulators, such as SREBP-1c and FXR, respectively, resulting in metabolic disorders. It will be important to understand how p300 and SIRT1 activities are unbalanced in disease conditions and which signaling pathways are involved.
We also observed that SREBP-1c protein levels were not increased, whereas elevated acetylation levels were detected in in vivo acetylation experiments under overnight fasting conditions (Figs. 2 and 8). This may be partly due to the lack of a complete understanding of in vivo regulations controlling SREBP-1c levels, but overnight fasting could be a major reason. It was shown that GSK kinase phosphorylates SREBP-1c at Ser-410 and destabilizes the protein and that insulin treatment inhibits GSK activity, resulting in increased stability of SREBP-1c (26). Therefore, overnight fasting may override the acetylation effects on stability if elevated insulin levels are required for the effect of SREBP-1c acetylation on its stability.
In the current studies, we show that SREBP-1c is an important in vivo target of SIRT1. While this manuscript was under revision, Näär and colleagues (43) demonstrated that in response to fasting cues, SIRT1 orthologs in metazoans play a crucial role in inhibiting lipid/cholesterol synthesis by deacetylating and decreasing nuclear SREBP-1 and -2 levels. Therefore, our studies, taken together with this study, consistently demonstrate that increased activity and expression of SIRT1 during fasting deacetylates and inhibits SREBP-1c activity, resulting in down-regulation of lipogenic SREBP-1c gene expression and subsequently decreased fat storage in the liver. Our studies further suggest that abnormally elevated SREBP-1c acetylation contributes to hepatic lipogenesis by increasing SREBP-1c activity in obese mice.
SREBP-1c has been considered to be central to pathogenesis of metabolic disorders, including fatty liver, and has received much attention as a therapeutic target (15, 21–23, 43–45). Small molecules to suppress SREBP-1c acetylation levels by either inhibiting p300 or activating SIRT1 may be useful for treatment of metabolic disorders, such as fatty liver disease, obesity, and type II diabetes.
Supplementary Material
Acknowledgments
We are grateful to P. Puigserver for providing adenoviral vectors (Ad-FLAG-SIRT1 and Ad-siSIRT1). We thank P. Rotwein for providing an adenoviral vector expressing p300 siRNA (Ad-sip300). We also thank Drs. M. Leid for GST-SIRT1 constructs, W. Gu for FLAG-SIRT1 plasmids, T. Imamura for HA-ubiquitin plasmids, and H. Shimano and Jae Bum Kim for expression plasmids for SREBPs. We also thank B. Kemper for helpful discussions.
This work was supported, in whole or in part, by National Institutes of Health Grants CA103867 and CA124760 (to C.-M. C.), DK062777, and DK80032 (to J. K. K.) and National Institutes of Health, NCI, Contract N01-CO-12400 (to T. D. V.). This work was also supported by an American Diabetes Association basic research award (to J. K. K.).

The on-line version of this article (available at http://www.jbc.org) contains supplemental Figs. S1–S7.
- FXR
- farnesoid X receptor
- Nam
- nicotinamide
- CHX
- cycloheximide
- IP
- immunoprecipitation
- Ad
- adenovirus.
REFERENCES
- 1.Rodgers J. T., Lerin C., Gerhart-Hines Z., Puigserver P. (2008) FEBS Lett. 582, 46–53 [DOI] [PMC free article] [PubMed] [Google Scholar]
- 2.Sinclair D. A., Lin S. J., Guarente L. (2006) Science 312, 195–197 [DOI] [PubMed] [Google Scholar]
- 3.Yamamoto H., Schoonjans K., Auwerx J. (2007) Mol. Endocrinol. 21, 1745–1755 [DOI] [PubMed] [Google Scholar]
- 4.Guarente L. (2007) Cold Spring Harb. Symp. Quant. Biol. 72, 483–488 [DOI] [PubMed] [Google Scholar]
- 5.Rodgers J. T., Puigserver P. (2007) Proc. Natl. Acad. Sci. U.S.A. 104, 12861–12866 [DOI] [PMC free article] [PubMed] [Google Scholar]
- 6.Daitoku H., Hatta M., Matsuzaki H., Aratani S., Ohshima T., Miyagishi M., Nakajima T., Fukamizu A. (2004) Proc. Natl. Acad. Sci. U.S.A. 101, 10042–10047 [DOI] [PMC free article] [PubMed] [Google Scholar]
- 7.Li X., Zhang S., Blander G., Tse J. G., Krieger M., Guarente L. (2007) Mol. Cell 28, 91–106 [DOI] [PubMed] [Google Scholar]
- 8.Kemper J. K., Xiao Z., Ponugoti B., Miao J., Fang S., Kanamaluru D., Tsang S., Wu S. Y., Chiang C. M., Veenstra T. D. (2009) Cell Metab. 10, 392–404 [DOI] [PMC free article] [PubMed] [Google Scholar]
- 9.Lerin C., Rodgers J. T., Kalume D. E., Kim S. H., Pandey A., Puigserver P. (2006) Cell Metab. 3, 429–438 [DOI] [PubMed] [Google Scholar]
- 10.Rodgers J. T., Lerin C., Haas W., Gygi S. P., Spiegelman B. M., Puigserver P. (2005) Nature 434, 113–118 [DOI] [PubMed] [Google Scholar]
- 11.Puigserver P., Spiegelman B. M. (2003) Endocr. Rev. 24, 78–90 [DOI] [PubMed] [Google Scholar]
- 12.Baur J. A., Pearson K. J., Price N. L., Jamieson H. A., Lerin C., Kalra A., Prabhu V. V., Allard J. S., Lopez-Lluch G., Lewis K., Pistell P. J., Poosala S., Becker K. G., Boss O., Gwinn D., Wang M., Ramaswamy S., Fishbein K. W., Spencer R. G., Lakatta E. G., Le Couteur D., Shaw R. J., Navas P., Puigserver P., Ingram D. K., de Cabo R., Sinclair D. A. (2006) Nature 444, 337–342 [DOI] [PMC free article] [PubMed] [Google Scholar]
- 13.Lagouge M., Argmann C., Gerhart-Hines Z., Meziane H., Lerin C., Daussin F., Messadeq N., Milne J., Lambert P., Elliott P., Geny B., Laakso M., Puigserver P., Auwerx J. (2006) Cell 127, 1109–1122 [DOI] [PubMed] [Google Scholar]
- 14.Feige J. N., Lagouge M., Canto C., Strehle A., Houten S. M., Milne J. C., Lambert P. D., Mataki C., Elliott P. J., Auwerx J. (2008) Cell Metab. 8, 347–358 [DOI] [PubMed] [Google Scholar]
- 15.Osborne T. F. (2000) J. Biol. Chem. 275, 32379–32382 [DOI] [PubMed] [Google Scholar]
- 16.Horton J. D. (2002) Biochem. Soc. Trans. 30, 1091–1095 [DOI] [PubMed] [Google Scholar]
- 17.Shimano H. (2001) Prog. Lipid. Res. 40, 439–452 [DOI] [PubMed] [Google Scholar]
- 18.Brown M. S., Goldstein J. L. (1997) Cell 89, 331–340 [DOI] [PubMed] [Google Scholar]
- 19.Shimano H., Horton J. D., Shimomura I., Hammer R. E., Brown M. S., Goldstein J. L. (1997) J. Clin. Invest. 99, 846–854 [DOI] [PMC free article] [PubMed] [Google Scholar]
- 20.Toth J. I., Datta S., Athanikar J. N., Freedman L. P., Osborne T. F. (2004) Mol. Cell. Biol. 24, 8288–8300 [DOI] [PMC free article] [PubMed] [Google Scholar]
- 21.Horton J. D., Bashmakov Y., Shimomura I., Shimano H. (1998) Proc. Natl. Acad. Sci. U.S.A. 95, 5987–5992 [DOI] [PMC free article] [PubMed] [Google Scholar]
- 22.Chakravarty K., Leahy P., Becard D., Hakimi P., Foretz M., Ferre P., Foufelle F., Hanson R. W. (2001) J. Biol. Chem. 276, 34816–34823 [DOI] [PubMed] [Google Scholar]
- 23.Kim J. B., Sarraf P., Wright M., Yao K. M., Mueller E., Solanes G., Lowell B. B., Spiegelman B. M. (1998) J. Clin. Invest. 101, 1–9 [DOI] [PMC free article] [PubMed] [Google Scholar]
- 24.Ponugoti B., Fang S., Kemper J. K. (2007) Mol. Endocrinol. 21, 2698–2712 [DOI] [PubMed] [Google Scholar]
- 25.Li T., Kong X., Owsley E., Ellis E., Strom S., Chiang J. Y. (2006) J. Biol. Chem. 281, 28745–28754 [DOI] [PMC free article] [PubMed] [Google Scholar]
- 26.Bengoechea-Alonso M. T., Ericsson J. (2009) J. Biol. Chem. 284, 5885–5895 [DOI] [PubMed] [Google Scholar]
- 27.Giandomenico V., Simonsson M., Grönroos E., Ericsson J. (2003) Mol. Cell. Biol. 23, 2587–2599 [DOI] [PMC free article] [PubMed] [Google Scholar]
- 28.Sundqvist A., Bengoechea-Alonso M. T., Ye X., Lukiyanchuk V., Jin J., Harper J. W., Ericsson J. (2005) Cell Metab. 1, 379–391 [DOI] [PubMed] [Google Scholar]
- 29.Yoon Y. S., Seo W. Y., Lee M. W., Kim S. T., Koo S. H. (2009) J. Biol. Chem. 284, 10446–10452 [DOI] [PMC free article] [PubMed] [Google Scholar]
- 30.Kim K. H., Song M. J., Yoo E. J., Choe S. S., Park S. D., Kim J. B. (2004) J. Biol. Chem. 279, 51999–52006 [DOI] [PubMed] [Google Scholar]
- 31.Fang S., Tsang S., Jones R., Ponugoti B., Yoon H., Wu S. Y., Chiang C. M., Willson T. M., Kemper J. K. (2008) J. Biol. Chem. 283, 35086–35095 [DOI] [PMC free article] [PubMed] [Google Scholar]
- 32.Miao J., Xiao Z., Kanamaluru D., Min G., Yau P. M., Veenstra T. D., Ellis E., Strom S., Suino-Powell K., Xu H. E., Kemper J. K. (2009) Genes Dev. 23, 986–996 [DOI] [PMC free article] [PubMed] [Google Scholar]
- 33.Thomas M. C., Chiang C. M. (2005) Mol. Cell 17, 251–264 [DOI] [PubMed] [Google Scholar]
- 34.Nemoto S., Fergusson M. M., Finkel T. (2005) J. Biol. Chem. 280, 16456–16460 [DOI] [PubMed] [Google Scholar]
- 35.Kuninger D., Stauffer D., Eftekhari S., Wilson E., Thayer M., Rotwein P. (2004) Hum. Gene Ther. 15, 1287–1292 [DOI] [PubMed] [Google Scholar]
- 36.Fang S., Miao J., Xiang L., Ponugoti B., Treuter E., Kemper J. K. (2007) Mol. Cell. Biol. 27, 1407–1424 [DOI] [PMC free article] [PubMed] [Google Scholar]
- 37.Kemper J. K., Kim H., Miao J., Bhalla S., Bae Y. (2004) Mol. Cell. Biol. 24, 7707–7719 [DOI] [PMC free article] [PubMed] [Google Scholar]
- 38.Evans R. M., Barish G. D., Wang Y. X. (2004) Nat. Med. 10, 355–361 [DOI] [PubMed] [Google Scholar]
- 39.Kouzarides T. (2000) EMBO J. 19, 1176–1179 [DOI] [PMC free article] [PubMed] [Google Scholar]
- 40.Shimomura I., Bashmakov Y., Horton J. D. (1999) J. Biol. Chem. 274, 30028–30032 [DOI] [PubMed] [Google Scholar]
- 41.Purushotham A., Schug T. T., Xu Q., Surapureddi S., Guo X., Li X. (2009) Cell Metab. 9, 327–338 [DOI] [PMC free article] [PubMed] [Google Scholar]
- 42.You M., Liang X., Ajmo J. M., Ness G. C. (2008) Am. J. Physiol. Gastrointest Liver Physiol. 294, G892–G898 [DOI] [PubMed] [Google Scholar]
- 43.Walker A. K., Yang F., Jiang K., Ji J. Y., Watts J. L., Purushotham A., Boss O., Hirsch M. L., Ribich S., Smith J. J., Israelian K., Westphal C. H., Rodgers J. T., Shioda T., Elson S. L., Mulligan P., Najafi-Shoushtari H., Black J. C., Thakur J. K., Kadyk L. C., Whetstine J. R., Mostoslavsky R., Puigserver P., Li X., Dyson N. J., Hart A. C., Näär A. M. (2010) Genes Dev. 24, 1403–1417 [DOI] [PMC free article] [PubMed] [Google Scholar]
- 44.Biddinger S. B., Almind K., Miyazaki M., Kokkotou E., Ntambi J. M., Kahn C. R. (2005) Diabetes 54, 1314–1323 [DOI] [PubMed] [Google Scholar]
- 45.Im S. S., Hammond L. E., Yousef L., Nugas-Selby C., Shin D. J., Seo Y. K., Fong L. G., Young S. G., Osborne T. F. (2009) Mol. Cell. Biol. 29, 4864–4872 [DOI] [PMC free article] [PubMed] [Google Scholar]
Associated Data
This section collects any data citations, data availability statements, or supplementary materials included in this article.


