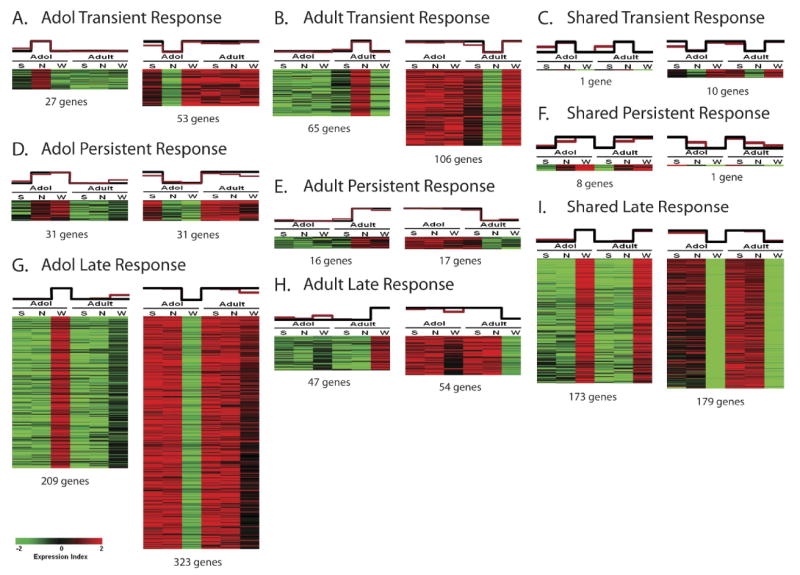
Figure 1.

Gene expression correlation with chronic nicotine exposure. Heat maps of template-matched genes show positive and negative correlations with chronic nicotine treatment. The black graph above each heat map represents the specific template employed for matching, whereas the red graph represents the mean expression values of all matched genes within each column. Each pattern includes both a positive template (corresponding to gene up-regulation, left) and a negative template (corresponding to gene down-regulation, right). A. Genes showing a transient response to chronic nicotine in adolescent rats. B. Genes showing a transient response to chronic nicotine in adult rats. C. Genes showing a transient response to chronic nicotine shared between adolescent and adult rats. D. Genes showing a persistent response to chronic nicotine in adolescent rats. E. Genes showing a persistent response to chronic nicotine in adult rats. F. Genes showing a persistent response to chronic nicotine shared between adolescent and adult rats. G. Genes showing a late response to chronic nicotine in adolescent rats. H. Genes showing a late response to chronic nicotine in adult rats. I. Genes showing a late response to chronic nicotine shared between adolescent and adult rats.
